The Parent Mealtime Action Scale (PMAS): Development and ...
The Parent Mealtime Action Scale (PMAS): Development and ...
The Parent Mealtime Action Scale (PMAS): Development and ...

You also want an ePaper? Increase the reach of your titles
YUMPU automatically turns print PDFs into web optimized ePapers that Google loves.
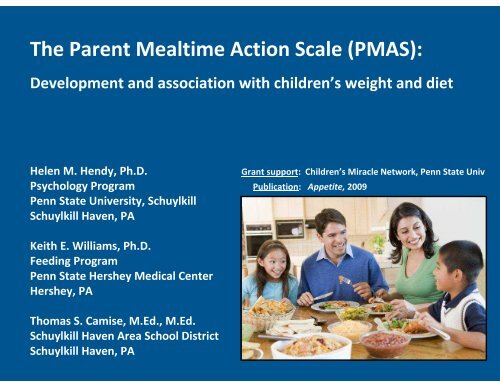
<strong>The</strong> <strong>Parent</strong> <strong>Mealtime</strong> <strong>Action</strong> <strong>Scale</strong> (<strong>PMAS</strong>):<br />
<strong>Development</strong> <strong>and</strong> association with children’s weight <strong>and</strong> diet<br />
Helen M. Hendy, Ph.D.<br />
Psychology Program Publication: Appetite, 2009<br />
Penn State University, Schuylkill<br />
Schuylkill Haven, PA<br />
Keith E. Williams, Ph.D.<br />
Feeding Program<br />
Penn State Hershey Medical Center<br />
Hershey, PA<br />
Thomas S. Camise, M.Ed., M.Ed.<br />
Schuylkill Haven Area School District<br />
Schuylkill Haven, PA<br />
Grant support: Children’s Miracle Network, Penn State Univ
1. INTRODUCTION<br />
2. METHODS<br />
3. RESULTS<br />
4. CONCLUSIONS
1. INTRODUCTION
Over 30% of American children are now overweight or obese:<br />
(Wang & Beydown, 2007)<br />
<strong>The</strong>y have more physical, social, psychological problems:<br />
Diabetes<br />
Bowed legs<br />
Asthma<br />
Peer teasing<br />
Fewer friends<br />
Stereotyped as lazy, ugly, stupid<br />
Anxiety disorders<br />
Depression<br />
Poor Quality of Life
<strong>Parent</strong> feeding measures available:<br />
Child Feeding Questionnaire (Birch et al., 2001)<br />
Infant <strong>and</strong> Preschooler Feeding Questionnaires (Baughcum et al., 2001)<br />
Caregiver Feeding Styles Questionnaire (Hughes et al., 2005)<br />
Comprehensive Feeding Practices Questionnaire (Musher-Eizenman & Holub, 2007)
Why develop another scale<br />
1.To focus on PARENT BEHAVIORS, NOT ATTITUDES . . . . . . . . .<br />
<strong>Parent</strong>s often want specific behavioral “do <strong>and</strong> “don’t” lists<br />
Attitudes are already quite consistent (.76), but behaviors are not (.55)<br />
2. To complete MORE PSYCHOMETRIC EXAMINATION<br />
Larger sample sizes<br />
Exploratory <strong>and</strong> confirmatory factor analysis<br />
Examination of gender differences<br />
Internal reliability<br />
Test-retest reliability<br />
Convergent validity<br />
3. To examine how well our scale EXPLAINED CHILDREN’S WEIGHT AND DIET<br />
BMI%, FRVEG, SNACKS
Selection of 66 possible <strong>PMAS</strong> items:<br />
FROM THEORY<br />
Social Cognitive <strong>The</strong>ory (B<strong>and</strong>ura, 1997)<br />
parent modeling<br />
verbal persuasion<br />
repeated experience<br />
offers of rewards<br />
consider physiological factors<br />
Group Socialization <strong>The</strong>ory (Harris, 1995)<br />
peer modeling<br />
Self-Determination <strong>The</strong>ory (Deci & Ryan, 1985)<br />
offers of food choice<br />
FROM PAST RESEARCH<br />
offers of rewards<br />
offers of food choice<br />
food restriction may backfire<br />
fat reduction may backfire<br />
avoidance of satiation<br />
avoidance of coercion<br />
repeated taste experiences (8-10 to “like” a food)<br />
special meals (parents give up after 3-5 attempts)<br />
FROM CLINICAL EXPERIENCE
2. METHODS
Sample 1<br />
2008 mothers, 130 fathers<br />
48% boys; mean age = 8.3 yrs; 87% Caucasian<br />
______________________________________________<br />
Procedures:<br />
R<strong>and</strong>om cluster sample of parents from schools in 67 counties of PA<br />
<strong>Parent</strong>s completed anonymous questionnaires<br />
Measures: FOR 66 <strong>PMAS</strong> ITEMS -- parent s used 3-pt rating to report use in a typical week<br />
1 = never<br />
2 = sometimes<br />
3 = always<br />
BMI% -- calculated from parent reports of child’s height <strong>and</strong> weight<br />
FRVEG -- # daily servings of 40 FRVEG from food frequency<br />
SNACKS -- # daily servings of 12 SNACKS from food frequency<br />
GENETIC RISK FOR OBESITY -- calculated as mother’s BMI from height <strong>and</strong> weight<br />
TELEVISION TIME -- # hours/day as estimated by parent<br />
EXERCISE -- # days/week exercise 30+ minutes as estimated by parent
Sample 2<br />
541 mothers, 309 fathers<br />
51% boys; mean age = 4.5 yrs; 64% Caucasian<br />
______________________________________________<br />
Procedures:<br />
Measures:<br />
Convenience sample from 1 elementary school, 3 preschools in eastern PA<br />
Both the mother <strong>and</strong> the father completed separate anonymous questionnaires<br />
FOR 66 <strong>PMAS</strong> ITEMS -- parent rated HIS/HER OWN USE of the action<br />
1 = never<br />
2 = sometimes<br />
3 = always<br />
FOR 66 <strong>PMAS</strong> ITEMS -- parent rated the OTHER PARENT’S USE of the action<br />
1 = never<br />
2 = sometimes<br />
3 = always
Sample 3<br />
49 mothers, 6 fathers<br />
46% boys; mean age = 8.1 yrs; 99% Caucasian<br />
______________________________________________<br />
Procedures:<br />
Convenience sample from 1 elementary school in eastern PA<br />
<strong>Parent</strong>s completed the same questionnaire twice, two weeks apart<br />
Measures:<br />
FOR 66 <strong>PMAS</strong> ITEMS -- parent used 3-pt rating to report use in a typical week<br />
1 = never<br />
2 = sometimes<br />
3 = always
3. RESULTS
Factor analysis approach:<br />
Eliminated 8 items with “floor effects” ( > 75% of parents said “never” used)<br />
Eliminated 2 items with “ceiling effects” ( > 75% of parents said “always ” used)<br />
Used varimax rotation<br />
Required each <strong>PMAS</strong> dimension to include 3+ items<br />
Required each item to have .40+ factor loads in only one <strong>PMAS</strong> dimension
FACTOR ANALYSES FOR 31-ITEM <strong>PMAS</strong> :<br />
Exploratory Confirmatory Confirmatory<br />
mean loads mean loads mean loads<br />
<strong>PMAS</strong> DIMENSION (# items) (2008 mothers (541 mothers (439 fathers of<br />
of Sample 1) of Sample 2) Sample 1 <strong>and</strong> 2)<br />
___________________________________________________________________________________<br />
SNACK LIMITS (3) .84 .81 .82<br />
POSITIVE PERSUASION (4) .72 .72 .72<br />
DAILY FV AVAILABILITY (3) .77 .72 .75<br />
USE OF REWARDS (4) .65 .63 .63<br />
INSISTENCE ON EATING (3) .75 .78 .80<br />
SNACK MODELING (3) .73 .75 .78<br />
SPECIAL MEALS (4) .58 .53 .44<br />
FAT REDUCTION (3) .71 .72 .71<br />
MANY FOOD CHOICES (4) .58 .55 .55<br />
___________________________________________________________________________________
<strong>PMAS</strong> RELIABILITY AND VALIDITY:<br />
Internal Test-retest Convergent<br />
reliability reliability validity<br />
(2549 mothers of (49 mothers (221 parent pairs<br />
<strong>PMAS</strong> DIMENSION (# items) Samples 1 <strong>and</strong> 2) of Sample 3) of Sample 2)<br />
___________________________________________________________________________________<br />
SNACK LIMITS (3) .81 .51 .70<br />
POSITIVE PERSUASION (4) .75 .56 .74<br />
DAILY FV AVAILABILITY (3) .70 .51 .70<br />
USE OF REWARDS (4) .65 .55 .78<br />
INSISTENCE ON EATING (3) .68 .74 .72<br />
SNACK MODELING (3) .54 .69 .59<br />
SPECIAL MEALS (4) .45 .58 .61<br />
FAT REDUCTION (3) .59 .75 .76<br />
MANY FOOD CHOICES (4) .42 .67 .60<br />
___________________________________________________________________________________<br />
MEANS = .62 .62 .69
Example of items within <strong>PMAS</strong> dimensions:<br />
DAILY FV AVAILABILITY =<br />
You gave the child fruit each day<br />
You ate fruit each day<br />
You ate vegetables each day<br />
FAT REDUCTION =<br />
You stopped the child from eating too much<br />
You made changes to the child’s food to lower fat<br />
You made change to your own food to lower fat
Example of items within <strong>PMAS</strong> dimensions:<br />
POSITIVE PERSUASION =<br />
You told the child how much you liked the food<br />
You told the child how good the food will taste if he/she tries it<br />
You told the child that his/her friends or siblings like the food<br />
You told the child that the food will make him/her healthy, smart, strong<br />
INSISTENCE ON EATING =<br />
You insisted the child eat even if he/she said “I’m not hungry”<br />
You insisted the child eat when he/she was sleepy, not feeling well<br />
You insisted the child eat when he/she was emotionally upset
Example of items within <strong>PMAS</strong> dimensions:<br />
SNACK MODELING =<br />
You drank soda each day<br />
You ate c<strong>and</strong>y or sweets each day<br />
You ate salty snacks each day<br />
SPECIAL MEALS =<br />
You sat with the child, but did not eat<br />
You prepared a special meal for the child, different from the family meal<br />
You ate the same foods as those offered to the child (REVERSED)<br />
You placed some of each food on the child’s plate (REVERSED)
Gender differences in use of <strong>PMAS</strong> dimensions<br />
Using 272 parent-pairs of Sample 2, with each parent’s self-rated <strong>PMAS</strong><br />
ANALYSIS: 2 X 2 repeated-measures ANOVA<br />
2 child genders -- boys, girls<br />
2 parent genders (repeated-measures for each child) -- mother, father<br />
OUTCOME MEASURE: mean 3-pt rating for <strong>PMAS</strong> dimension items<br />
RESULTS: (Only parent-gender significant)<br />
_______________________________________________________<br />
MOTHERS USE MORE:<br />
SNACK LIMITS<br />
DAILY FV AVAILABILITY<br />
FAT REDUCTION<br />
POSITIVE PERSUASION<br />
FATHERS USE MORE:<br />
INSISTENCE ON EATING
Multiple regression to examine how well <strong>PMAS</strong> dimensions<br />
explain children’s weight (BMI%) <strong>and</strong> diet (FRVEG, SNACKS),<br />
but first partialling out 3 known predictors:<br />
GENETIC RISK<br />
EXERCISE<br />
(mother’s BMI) TELEVISION TIME (# days/week)<br />
(# hours/day)
MULTIPLE REGRESSION RESULTS FOR <strong>PMAS</strong> DIMENSIONS<br />
ASSOCIATED WITH BMI%:<br />
R 2 = .11<br />
F = 24.21<br />
df = (6,1174)<br />
p = .000<br />
<strong>PMAS</strong> dimension beta t p<br />
________________________________________________________________________<br />
POSITIVE PERSUASION -.077 2.72 .01<br />
INSISTENCE ON EATING -.124 4.39 .001<br />
SNACK MODELING .088 3.19 .01<br />
FAT REDUCTION .120 4.25 .001<br />
________________________________________________________________________
MULTIPLE REGRESSION RESULTS FOR <strong>PMAS</strong> DIMENSIONS<br />
ASSOCIATED WITH FRVEG:<br />
R 2 = .13<br />
F = 57.85<br />
df = (4,1494)<br />
p = .000<br />
<strong>PMAS</strong> dimension beta t p<br />
________________________________________________________________________<br />
DAILY FV AVAILABILITY .318 12.95 .001<br />
POSITIVE PERSUASION .070 2.90 .01<br />
SPECIAL MEALS -.069 2.82 .01<br />
________________________________________________________________________
MULTIPLE REGRESSION RESULTS FOR <strong>PMAS</strong> DIMENSIONS<br />
ASSOCIATED WITH SNACKS:<br />
R 2 = .09<br />
F = 24.90<br />
df = (6,1492)<br />
p = .000<br />
<strong>PMAS</strong> dimension beta t p<br />
________________________________________________________________________<br />
SNACK MODELING .166 6.69 .001<br />
MANY FOOD CHOICES .075 3.00 .01<br />
POSITIVE PERSUASION .077 3.08 .01<br />
FAT REDUCTION -.078 3.11 .01<br />
________________________________________________________________________
1. CONCLUSIONS
<strong>Parent</strong> actions associated with children’s healthy weight <strong>and</strong> diet:<br />
DAILY FV AVAILABILITY<br />
POSITIVE PERSUASION<br />
INSISTENCE ON EATING
<strong>Parent</strong> actions associated with children’s healthy weight <strong>and</strong> diet:<br />
SNACK MODELING<br />
MANY FOOD CHOICES<br />
SPECIAL MEALS
Next research steps:<br />
1. Confirmatory factor analysis with sample of feeding clinic children<br />
2. Experimental evaluation of <strong>PMAS</strong> to improve children’s weight & diet<br />
FOR EASY-TO-SCORE <strong>PMAS</strong>:<br />
Helen Hendy<br />
HL4@PSU.EDU