Download PDF - Andrew Rambaut
Download PDF - Andrew Rambaut
Download PDF - Andrew Rambaut
- No tags were found...

You also want an ePaper? Increase the reach of your titles
YUMPU automatically turns print PDFs into web optimized ePapers that Google loves.
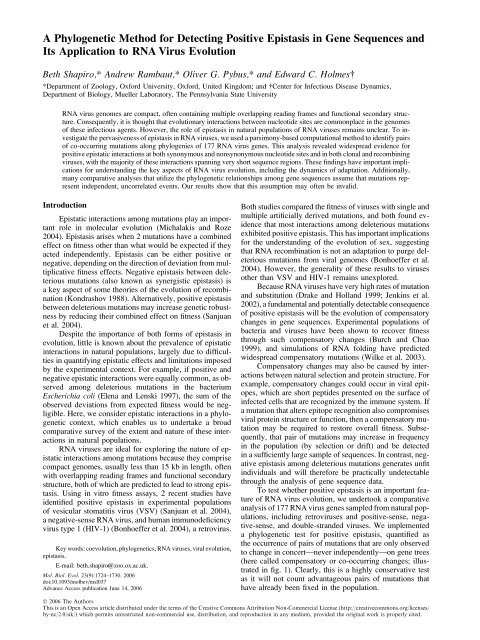
A Phylogenetic Method for Detecting Positive Epistasis in Gene Sequences and<br />
Its Application to RNA Virus Evolution<br />
Beth Shapiro,* <strong>Andrew</strong> <strong>Rambaut</strong>,* Oliver G. Pybus,* and Edward C. Holmes<br />
*Department of Zoology, Oxford University, Oxford, United Kingdom; and Center for Infectious Disease Dynamics,<br />
Department of Biology, Mueller Laboratory, The Pennsylvania State University<br />
RNA virus genomes are compact, often containing multiple overlapping reading frames and functional secondary structure.<br />
Consequently, it is thought that evolutionary interactions between nucleotide sites are commonplace in the genomes<br />
of these infectious agents. However, the role of epistasis in natural populations of RNA viruses remains unclear. To investigate<br />
the pervasiveness of epistasis in RNA viruses, we used a parsimony-based computational method to identify pairs<br />
of co-occurring mutations along phylogenies of 177 RNA virus genes. This analysis revealed widespread evidence for<br />
positive epistatic interactions at both synonymous and nonsynonymous nucleotide sites and in both clonal and recombining<br />
viruses, with the majority of these interactions spanning very short sequence regions. These findings have important implications<br />
for understanding the key aspects of RNA virus evolution, including the dynamics of adaptation. Additionally,<br />
many comparative analyses that utilize the phylogenetic relationships among gene sequences assume that mutations represent<br />
independent, uncorrelated events. Our results show that this assumption may often be invalid.<br />
Introduction<br />
Epistatic interactions among mutations play an important<br />
role in molecular evolution (Michalakis and Roze<br />
2004). Epistasis arises when 2 mutations have a combined<br />
effect on fitness other than what would be expected if they<br />
acted independently. Epistasis can be either positive or<br />
negative, depending on the direction of deviation from multiplicative<br />
fitness effects. Negative epistasis between deleterious<br />
mutations (also known as synergistic epistasis) is<br />
a key aspect of some theories of the evolution of recombination<br />
(Kondrashov 1988). Alternatively, positive epistasis<br />
between deleterious mutations may increase genetic robustness<br />
by reducing their combined effect on fitness (Sanjuan<br />
et al. 2004).<br />
Despite the importance of both forms of epistasis in<br />
evolution, little is known about the prevalence of epistatic<br />
interactions in natural populations, largely due to difficulties<br />
in quantifying epistatic effects and limitations imposed<br />
by the experimental context. For example, if positive and<br />
negative epistatic interactions were equally common, as observed<br />
among deleterious mutations in the bacterium<br />
Escherichia coli (Elena and Lenski 1997), the sum of the<br />
observed deviations from expected fitness would be negligible.<br />
Here, we consider epistatic interactions in a phylogenetic<br />
context, which enables us to undertake a broad<br />
comparative survey of the extent and nature of these interactions<br />
in natural populations.<br />
RNA viruses are ideal for exploring the nature of epistatic<br />
interactions among mutations because they comprise<br />
compact genomes, usually less than 15 kb in length, often<br />
with overlapping reading frames and functional secondary<br />
structure, both of which are predicted to lead to strong epistasis.<br />
Using in vitro fitness assays, 2 recent studies have<br />
identified positive epistasis in experimental populations<br />
of vesicular stomatitis virus (VSV) (Sanjuan et al. 2004),<br />
a negative-sense RNA virus, and human immunodeficiency<br />
virus type 1 (HIV-1) (Bonhoeffer et al. 2004), a retrovirus.<br />
Key words: coevolution, phylogenetics, RNA viruses, viral evolution,<br />
epistasis.<br />
E-mail: beth.shapiro@zoo.ox.ac.uk.<br />
Mol. Biol. Evol. 23(9):1724–1730. 2006<br />
doi:10.1093/molbev/msl037<br />
Advance Access publication June 14, 2006<br />
Both studies compared the fitness of viruses with single and<br />
multiple artificially derived mutations, and both found evidence<br />
that most interactions among deleterious mutations<br />
exhibited positive epistasis. This has important implications<br />
for the understanding of the evolution of sex, suggesting<br />
that RNA recombination is not an adaptation to purge deleterious<br />
mutations from viral genomes (Bonhoeffer et al.<br />
2004). However, the generality of these results to viruses<br />
other than VSV and HIV-1 remains unexplored.<br />
Because RNA viruses have very high rates of mutation<br />
and substitution (Drake and Holland 1999; Jenkins et al.<br />
2002), a fundamental and potentially detectable consequence<br />
of positive epistasis will be the evolution of compensatory<br />
changes in gene sequences. Experimental populations of<br />
bacteria and viruses have been shown to recover fitness<br />
through such compensatory changes (Burch and Chao<br />
1999), and simulations of RNA folding have predicted<br />
widespread compensatory mutations (Wilke et al. 2003).<br />
Compensatory changes may also be caused by interactions<br />
between natural selection and protein structure. For<br />
example, compensatory changes could occur in viral epitopes,<br />
which are short peptides presented on the surface of<br />
infected cells that are recognized by the immune system. If<br />
a mutation that alters epitope recognition also compromises<br />
viral protein structure or function, then a compensatory mutation<br />
may be required to restore overall fitness. Subsequently,<br />
that pair of mutations may increase in frequency<br />
in the population (by selection or drift) and be detected<br />
in a sufficiently large sample of sequences. In contrast, negative<br />
epistasis among deleterious mutations generates unfit<br />
individuals and will therefore be practically undetectable<br />
through the analysis of gene sequence data.<br />
To test whether positive epistasis is an important feature<br />
of RNA virus evolution, we undertook a comparative<br />
analysis of 177 RNA virus genes sampled from natural populations,<br />
including retroviruses and positive-sense, negative-sense,<br />
and double-stranded viruses. We implemented<br />
a phylogenetic test for positive epistasis, quantified as<br />
the occurrence of pairs of mutations that are only observed<br />
to change in concert—never independently—on gene trees<br />
(here called compensatory or co-occurring changes; illustrated<br />
in fig. 1). Clearly, this is a highly conservative test<br />
as it will not count advantageous pairs of mutations that<br />
have already been fixed in the population.<br />
Ó 2006 The Authors<br />
This is an Open Access article distributed under the terms of the Creative Commons Attribution Non-Commercial License (http://creativecommons.org/licenses/<br />
by-nc/2.0/uk/) which permits unrestricted non-commercial use, distribution, and reproduction in any medium, provided the original work is properly cited.
Positive Epistasis in RNA Viruses 1725<br />
A<br />
FIG. 1.—Detection of compensatory mutations between 3 positions<br />
(sites) in an alignment. Each circle represents a mutation occurring at 1<br />
of the 3 sites. In tree A, site 1 and site 2 are considered to be compensatory<br />
because at least 2 mutations occur at both sites, and every mutation at site<br />
1 is accompanied by a mutation at site 2. In tree B, the 2 sites are not<br />
compensatory.<br />
The analysis was conducted in 3 stages. First, the overall<br />
extent of epistasis in RNA viruses was estimated by calculating<br />
the number of sites involved in compensatory<br />
interactions for each data set. Second, we inferred the<br />
phylogenetic distribution of the observed compensatory<br />
mutations. Last, we mapped their genomic position and<br />
investigated the distance along the genome between each<br />
pair of co-occurring changes. At each stage, nucleotide<br />
and protein alignments were evaluated separately, and the<br />
significance of the results was evaluated by comparing<br />
the observed data with parametric simulations. Strikingly,<br />
we found evidence for positive epistasis in all major groups<br />
of RNA viruses, with the majority of compensatory interactions<br />
spanning short sequence regions.<br />
Materials and Methods<br />
We compiled, from GenBank, alignments of 177<br />
structural gene sequences representing 152 different RNA<br />
viruses and 30 virus families. Each sequence was taken from<br />
a different individual, and excessively passaged sequences<br />
were avoided. Alignments ranged from 468 to 2,741 nt<br />
(median 940) in length and included 10–75 (median 26)<br />
sequences. A detailed description of each alignment is<br />
available in the Supplementary Material online. A maximum<br />
likelihood (ML) phylogeny was then estimated for each<br />
alignment under the General Time Reversible (GTR) 1<br />
I 1 C model using PAUP* (Swofford 2003).<br />
Given the phylogenetic tree of each data set, the<br />
branch on which each mutation occurred was reconstructed<br />
using ACCTRAN parsimony reconstruction (Swofford<br />
and Maddison 1987) along the ML tree (positions with gaps<br />
were excluded from the analysis). In our analysis, pairs of<br />
mutations were identified as co-occurring if 1) each branch<br />
with a mutation at one site had a corresponding mutation<br />
at the other site and 2) this co-occurrence of mutations<br />
happened more than once in the phylogeny (i.e., on at least<br />
2 independent branches; see fig. 1). For each co-occurring<br />
mutation, we recorded 1) the codon position (i.e., 1st, 2nd,<br />
and 3rd), 2) whether it was a synonymous or nonsynonymous<br />
nucleotide mutation, 3) whether the mutation occurred<br />
on an internal or external phylogeny branch, 4)<br />
the nucleotide or amino acid position of the mutation along<br />
the sequence, and 5) the distance (in nucleotides or amino<br />
acids) between the co-occurring mutations. This parsimony<br />
B<br />
reconstruction was performed using both nucleotide and<br />
protein alignments.<br />
Because the GTR 1 I 1 C model does not take into<br />
account the possibility of covariation among nucleotide<br />
sites, lineages that contain the same covarying sites may<br />
cluster together in the phylogeny as each site will be evaluated<br />
independently. This will reduce the number of<br />
branches in the estimated phylogeny on which these 2<br />
changes will occur. Because our model only counts sites<br />
as covarying if they change simultaneously along at least<br />
2 branches in the phylogeny, the overall effect of using this<br />
model to infer trees will be to reduce the number of observed<br />
covarying sites, making our test highly conservative.<br />
For each data set, the total number of co-occurring<br />
pairs and the genomic distance between them were compared<br />
with those expected by chance through simulation.<br />
To assess statistical significance, parametric bootstrapping<br />
was employed as follows: For each virus phylogeny, ML<br />
branch lengths were first estimated using CODEML (Yang<br />
1997) under 3 models: (i) a codon substitution model (Yang<br />
and Nielsen 1998) in which the relative rate of transitions/<br />
transversions, j, and the relative rate of nonsynonymous/<br />
synonymous changes, x, were coestimated (for comparison<br />
to nucleotide data sets), (ii) the WAG model of amino acid<br />
evolution (Whelan and Goldman 2001) with C-distributed<br />
rate heterogeneity among sites (for comparison to amino acid<br />
data sets), and (iii) the WAG model without C-distributed<br />
rate heterogeneity (also for comparison to amino acid data<br />
sets). Rate variation in model (i) was modeled as a consequence<br />
of differences in nonsynonymous and synonymous<br />
rates of evolution.<br />
Three thousand alignments were simulated for each<br />
real data set (1,000 for each of the models (i), (ii), and<br />
(iii) described above) using the estimated branch lengths<br />
and substitution model parameters. Simulations were performed<br />
using the program Evolver in the PAML package<br />
(Yang 1997). Mutations in the resulting 531,000 (3,000 3<br />
177) simulated data sets were then reconstructed using the<br />
parsimony method described above. For each simulation,<br />
the number of co-occurring mutations and the genomic distance<br />
between them were estimated in the same manner as<br />
for the real data. The number of co-occurring mutations observed<br />
in a real virus alignment was considered significant<br />
if it was greater than that observed in .95% of the 1,000<br />
corresponding simulated alignments (each of the 3 models<br />
was evaluated separately). False discovery rate correction<br />
(Benjamini and Hochberg 1995) was used to account for<br />
the possibility of false positives under multiple testing.<br />
Results<br />
Measuring the Extent of Epistasis in RNA Viruses<br />
When compared with the parametric simulations, 55<br />
of the 177 RNA virus nucleotide alignments (31%) showed<br />
significantly more co-occurring changes than expected by<br />
chance, after correcting for false-positive discoveries<br />
(table 1). Furthermore, when the proportion of such sites<br />
was pooled across all 177 data sets, there was a highly significant<br />
excess of epistatic sites in the real data sets in comparison<br />
to the simulated ones (P , 0.001; table 1; depicted<br />
in fig. 2). This result is particularly notable given the
1726 Shapiro et al.<br />
Table 1<br />
Total Proportion of Sites across All 177 Data Sets That Are Involved in Compensatory Interactions<br />
Alignment Type<br />
Real Data Sets<br />
Simulated Data Sets<br />
(mean of 1,000 replicates)<br />
Significantly Higher Proportion<br />
of Sites in the Real<br />
Data Sets (P value) a<br />
Number of Real Data Sets<br />
with Significantly Higher<br />
Proportion of Sites b<br />
Nucleotide 0.027 0.023 Yes (P , 0.001) 55 (31%)<br />
Amino acid (with rate heterogeneity) 0.007 0.007 No 13 (7%)<br />
Amino acid (without rate heterogeneity) 0.007 0.008 No 44 (25%)<br />
a Significance is derived from the probability that a simulated data set has a higher proportion of compensatory sites than the real data set.<br />
b False discovery rate correction (Benjamini and Hochberg 1995) was used to correct for multiple testing.<br />
conservative nature of the test used. Fewer RNA virus data<br />
sets were found to contain significant epistasis when sequences<br />
were compared at the amino acid level, and the<br />
total proportion of sites involved in compensatory interactions<br />
was also not significant when compared against alignments<br />
simulated using either model (ii) or (iii) (table 1).<br />
Adding among-site rate heterogeneity to the amino acid<br />
simulations reduced the number of significant amino acid<br />
alignments from 44 to 13. This is expected as increasing<br />
rate heterogeneity will increase the probability that variable<br />
sites contain multiple mutations.<br />
Because multiple mutations at the same site are a common<br />
occurrence in RNA viruses, we also calculated the total<br />
proportion of reconstructed changes that were involved<br />
in epistatic interactions across all data sets (table 2). This<br />
statistic distinguishes more evolutionary events than the<br />
proportion of sites statistic (table 1) and is therefore more<br />
powerful. This ‘‘proportion of reconstructed changes’’ statistic<br />
indicated a significant excess of compensatory<br />
changes for both the nucleotide alignments (P , 0.001)<br />
and the amino acid alignments, when compared with simulations<br />
without rate heterogeneity (P , 0.001). As before,<br />
adding rate heterogeneity to the amino acid simulations led<br />
to a reduction in statistical significance.<br />
The Phylogenetic Distribution of Co-occurring Changes<br />
FIG. 2.—Frequency distribution of the total proportion of nucleotide<br />
sites involved in compensatory interactions for the 1,000 simulation replicates<br />
(in which each replicate contained 177 simulated alignments). The<br />
equivalent value for the 177 real RNA virus alignments is indicated by<br />
the arrow. This figure represents the results summarized in the top row<br />
of table 1.<br />
Next, we investigated the phylogenetic position of the<br />
reconstructed mutations that had been identified as cooccurring.<br />
Table 2 shows the total proportion of such mutations<br />
across all 177 data sets that occurred on internal or<br />
external phylogeny branches. In comparison to the parametric<br />
simulations, there was a significant excess of cooccurring<br />
changes on both internal and external branches<br />
for the nucleotide alignment and for the rate heterogeneity–<br />
free amino acid analysis (table 2). For the amino acid analysis<br />
incorporating rate heterogeneity, a significant excess<br />
of co-occurring mutations was found only on internal<br />
branches (table 2). ACCTRAN parsimony reconstruction<br />
will force mutations to occur more deeply in the tree, which<br />
could result in a bias toward mutations along internal rather<br />
than external branches. However, as the same parsimony<br />
reconstruction was performed on the real and simulated<br />
data, any potential methodological bias would not have<br />
affected our results.<br />
We then compared the probability that co-occurring<br />
mutations were identified along internal rather than external<br />
branches. Importantly, in the real data sets, compensatory<br />
mutations were significantly more likely to be found on internal<br />
branches than on external branches, in comparison to<br />
the parametric simulations (table 3). This was tested by calculating<br />
the total ratio of such mutations that fell on either<br />
external or internal branches. The excess of co-occurring<br />
changes on internal branches was significant for both the<br />
nucleotide alignments and for the amino acid alignments<br />
without rate heterogeneity (table 3).<br />
The Genomic Distribution of Co-occurring Changes<br />
Finally, we mapped the genomic position of each reconstructed<br />
mutation that had been identified as co-occurring.<br />
The spatial distribution of compensatory interactions along<br />
the genome was also significantly different between the<br />
real and simulated data sets (fig. 3). In the real data, epistatic<br />
interactions were more likely to occur between pairs of<br />
mutations that were located close together in the sequence<br />
alignment. This pattern was observed at both the nucleotide<br />
and amino acid levels (both with and without rate heterogeneity).<br />
At the nucleotide level, the majority of interacting<br />
pairs of mutations occurred within just 3 bases of each<br />
other. However, significantly more interacting pairs than<br />
were expected by chance were found at most distances<br />
(fig. 3A). At the amino acid level, the majority of interacting<br />
pairs were separated by fewer than 15 amino acids (fig. 3B).<br />
Discussion<br />
Despite the highly conservative nature of our parsimonybased<br />
method, the analysis conducted here revealed that<br />
positive epistasis is commonplace at the nucleotide level<br />
in natural populations of RNA viruses. Importantly, the
Positive Epistasis in RNA Viruses 1727<br />
Table 2<br />
Total Proportion of Reconstructed Mutations across All 177 Data Sets That Are Involved in<br />
Compensatory Interactions<br />
Alignment Type<br />
Real Data<br />
Sets<br />
Simulated<br />
Data Sets<br />
(mean of 1,000 replicates)<br />
Significantly Higher<br />
Proportion of Sites<br />
in the Real Data Sets<br />
(P value) a<br />
Nucleotide 0.11 0.084 Yes (P , 0.001)<br />
Internal branches only 0.11 0.082 Yes (P , 0.001)<br />
External branches only 0.1 0.083 Yes (P , 0.001)<br />
Amino acid (with rate heterogeneity) 0.039 0.035 No<br />
Internal branches only 0.042 0.034 Yes (P 5 0.02)<br />
External branches only 0.034 0.034 No<br />
Amino acid (without rate heterogeneity) 0.039 0.025 Yes (P , 0.001)<br />
Internal branches only 0.042 0.023 Yes (P , 0.001)<br />
External branches only 0.034 0.024 Yes (P , 0.001)<br />
a Significance is derived from the probability that a simulated data set has a higher proportion of compensatory changes than<br />
the real data set.<br />
majority of paired mutations that were found occurred<br />
along internal phylogeny branches, indicating that they<br />
have reached a relatively high frequency in the population.<br />
These mutations are, therefore, likely to be either selectively<br />
neutral or beneficial, as would be expected if the mutations<br />
were compensatory. The frequency of co-occurring mutations<br />
was not strongly correlated with most aspects of viral<br />
biology, including genomic segmentation, host type, or viral<br />
family. However, when viruses with different genome<br />
architectures were compared, approximately 2.5 times more<br />
compensatory evolution was found in negative-sense than<br />
in positive-sense viruses (Kolmogorov–Smirnov test, P 5<br />
0.001). Because negative-sense viruses are largely clonal<br />
(Chare and Holmes 2004), recombination is unlikely to<br />
be responsible for the independent occurrence of multiple<br />
mutations and, therefore, for the pattern observed in this<br />
analysis.<br />
Overall, our results suggest that, for RNA viruses, positive<br />
epistasis may be more important for nucleotide sequence<br />
evolution than for protein sequence evolution.<br />
Surprisingly, the majority of co-occurring nucleotide mutations<br />
were synonymous in that they did not result in a corresponding<br />
amino acid change. In fact, the probability that<br />
both mutations in a co-occurring pair were synonymous<br />
was 0.75 (2,766 out of 3,674 total pairs), compared with<br />
only 0.04 (130 of 3,119 average total pairs) in the simulations.<br />
Conversely, 96% of pairs in the simulated data sets<br />
contained at least one nonsynonymous mutation. Although<br />
previous phylogenetic studies have shown nonneutral evolution<br />
of synonymous sites in particular RNA virus species<br />
(e.g., GB virus C; Simmonds and Smith 1999), our results<br />
demonstrate that this is a general trend across RNA viruses.<br />
Crucially, the epistatic changes that we document are<br />
spatially restricted. In the nucleotide analysis, a large proportion<br />
of paired mutations occur within 3 nucleotides of<br />
each other (although significantly more interactions among<br />
nucleotides occur at most distances, in comparison to the<br />
parametric simulations; fig. 3A). In contrast, the spatial distribution<br />
of interacting pairs in the amino acid analysis is<br />
strongly skewed toward short distances, with most pairs<br />
of co-occurring changes separated by fewer than 15 amino<br />
acids (fig. 3B). This result strongly points toward the importance<br />
of structural constraints in RNA virus evolution,<br />
even within coding regions (see Simmonds et al. 2004;<br />
Thurner et al. 2004). The genomic proximity of compensatory<br />
changes may be explained by localized RNA or protein<br />
structure, such as hairpin loops or alpha helices, which<br />
impose selective constraints on otherwise beneficial mutations.<br />
Tightly linked compensatory changes have been implicated<br />
previously in the escape cytotoxic T-lymphocyte<br />
responses in both HIV and influenza A virus (Kelleher<br />
et al. 2001; Rimmelzwann et al. 2005).<br />
Localized structure may also be important in maintaining<br />
single-stranded RNA–binding domains in RNA viruses,<br />
as observed in untranslated regions (e.g., Gougas et al. 2004),<br />
structural genes (e.g., Isogai and Yoshikawa 2005), and<br />
nonstructural genes (e.g., Filmore et al. 2002). RNA-binding<br />
domains have been shown to play an important role in viral<br />
Table 3<br />
Internal/External Branch Ratio of Reconstructed Mutations That Are Involved in<br />
Compensatory Interactions<br />
Alignment Type<br />
Real Data Sets<br />
Simulated Data<br />
Sets (mean of<br />
1,000 replicates)<br />
Significantly Higher<br />
Ratio in the Real<br />
Data Sets (P value) a<br />
Nucleotide 1.24 1.01 Yes (P , 0.001)<br />
Amino acid (with rate heterogeneity) 1.11 0.97 No<br />
Amino acid (without rate heterogeneity) 1.11 0.75 Yes (P , 0.001)<br />
a Significance is derived from the probability that a simulated data set has a higher proportion of compensatory changes than<br />
the real data set.
Proportion of total possible pairs<br />
Proportion of total possible pairs<br />
1728 Shapiro et al.<br />
A<br />
4.00E-04<br />
3.50E-04<br />
3.00E-04<br />
2.50E-04<br />
2.00E-04<br />
1.50E-04<br />
1.00E-04<br />
5.00E-05<br />
0.00E+00<br />
1 11 21 31 41 51 61 71 81 91 101 111 121 131 141 151<br />
Distance between pairs of nucleotide sites<br />
B<br />
2.50E-04<br />
2.00E-04<br />
1.50E-04<br />
1.00E-04<br />
5.00E-05<br />
0.00E+00<br />
1 11 21 31 41 51 61 71 81 91 101 111 121 131 141 151<br />
Distance between pairs of amino acid sites<br />
FIG. 3.—The spatial distribution of pairs of compensatory mutations for (A) the nucleotide alignments and (B) the amino acid alignments. The x axis<br />
depicts the number of sites along the genome between each pair of coevolving sites. The y axis shows the proportion of the total number of possible pairs of<br />
sites at each distance that have been identified as coevolving. (Note that the number of possible pairs decreases as the distance between them increases.)<br />
Values from the real data set are shown as vertical bars. The 95% highest value (shaded area) and average value (solid horizontal lines) obtained from the<br />
1,000 parametric simulations are also given. In the nucleotide analysis, the majority of coevolving mutations occurred at third codon positions, resulting in<br />
a higher proportion of coevolving pairs of sites at distances that are multiples of 3. In (A), values for these distances are distinguished as light gray bars.<br />
Additionally, in (A), the 95% highest and average values obtained from the simulations were calculated separately for distances that are multiples of 3<br />
(gray) and all other distances (black).<br />
replication and assembly (Filmore et al. 2002; Gougas et al.<br />
2004), viral persistence (Simmonds et al. 2004), and the protection<br />
of viral RNA from RNAse attack (Taliansky and<br />
Robinson 2003). The ubiquity of RNA-binding nucleoproteins<br />
in negative-sense RNA viruses provides a possible explanation<br />
for the higher frequency of co-occurring changes<br />
in these viruses (as noted above). However, the biological<br />
role of localized structural constraints is likely to depend<br />
on specific aspects of viral life-history strategies; so further<br />
work focusing on specific virus groups is evidently necessary<br />
to differentiate the factors involved.<br />
Although more viruses were identified as showing significant<br />
positive epistasis in amino acid sequences when<br />
rate heterogeneity was excluded from the simulations,<br />
the addition of this parameter provided a better approximation<br />
of the real data in .95% of virus genes (data not
Positive Epistasis in RNA Viruses 1729<br />
shown). Rate heterogeneity alone, however, was not sufficient<br />
to account for the total extent of observed co-occurring<br />
mutations, suggesting that more sophisticated substitution<br />
models are required to better explain protein sequence<br />
evolution in RNA viruses.<br />
Many comparative analyses that utilize phylogenetic<br />
relationships among gene sequences assume that mutations<br />
represent independent and unlinked events. When this assumption<br />
is invalid, as our results show may be often, phylogeny<br />
estimation will be adversely affected. For example,<br />
if a pair of sites is evolving together but assumed to be<br />
evolving independently, then any phylogenetic information<br />
resulting from changes at these sites will be counted twice,<br />
resulting in overestimates of confidence in well-supported<br />
phylogenetic clades and underestimates of confidence in alternate<br />
arrangements (Jow et al. 2002). Although progress<br />
has been made in developing more realistic models of RNA<br />
evolution, current methods that allow for nonindependence<br />
between sites require either compensatory sites to be identified<br />
a priori (Jow et al. 2002; Hudolet et al. 2003) or nonindependence<br />
to occur only among neighboring sites (Lunter<br />
and Hein 2004; Siepel and Haussler 2004), which is insufficient<br />
to explain the covariation in RNA virus genes observed<br />
here. However, phylogenetic methods that allow<br />
evolutionary rates to be autocorrelated along gene sequences<br />
may reasonably approximate RNA virus evolution<br />
when the locations of interacting sites are unknown. Such<br />
a method was previously implemented by Felsenstein and<br />
Churchill (1996) but has not been widely used. Ideally,<br />
a method is required that both explicitly models the evolution<br />
of covarying sites and estimates their frequency as well<br />
as the phylogeny itself. It should be noted, however, that the<br />
total number of sites that were conclusively identified as<br />
being compensatory is small. Although this could be due,<br />
at least in part, to the extremely conservative nature of<br />
our test, the true amount of compensatory evolution is likely<br />
to vary greatly among species and genes, in turn having<br />
more or less significant effects on phylogeny estimation.<br />
The precise evolutionary effects of positive epistasis<br />
are complex and still to be determined and are influenced<br />
by factors such as the number of sites involved, the heterogeneity<br />
of the environment, and the balance between mutation,<br />
selection, and drift. Depending on the scenario,<br />
positive epistasis can either reduce the burden of deleterious<br />
mutations or act as a constraint to adaptive evolution. In<br />
RNA viruses, epistasis may therefore be central to epidemiologically<br />
important phenomena as host switching, immune<br />
escape, and the development of antiviral resistance.<br />
Supplementary Material<br />
Supplementary Material is available at Molecular<br />
Biology and Evolution online (http://www.mbe.<br />
oxfordjournals.org/).<br />
Acknowledgments<br />
We thank A. Drummond and C. Holmes for advice on<br />
the statistical analysis. We also thank P. H. Harvey for discussion<br />
and comments on the manuscript. This work was<br />
supported by the Wellcome Trust and the Royal Society.<br />
Funding to pay the Open Access publication charges<br />
for this article was provided by the Department of Zoology,<br />
Oxford University.<br />
Literature Cited<br />
Benjamini Y, Hochberg Y. 1995. Controlling the false discovery<br />
rate: a practical and powerful approach to multiple testing. J R<br />
Stat Soc B 57:289–300.<br />
Bonhoeffer S, Chappey C, Parkin NT, Whitcomb JM, Petropoulos<br />
CJ. 2004. Evidence for positive epistasis in HIV-1. Science<br />
306:1547–50.<br />
Burch CL, Chao L. 1999. Evolution by small steps and rugged<br />
landscapes in the RNA virus phi 6. Genetics 151:921–7.<br />
Chare ER, Holmes EC. 2004. Selection pressures in the capsid<br />
genes of plant RNA viruses reflect mode of transmission.<br />
J Gen Virol 85:3149–57.<br />
Drake JW, Holland JJ. 1999. Mutation rates among RNA viruses.<br />
Proc Natl Acad Sci USA 96:13910–13.<br />
Elena SF, Lenski RE. 1997. Test of synergistic interactions among<br />
deleterious mutations in bacteria. Nature 390:395–8.<br />
Felsenstein J, Churchill GA. 1996. A hidden Markov model approach<br />
to variation among sites in rate of evolution. Mol Biol<br />
Evol 13:93–104.<br />
Filmore GC, Lin H, Li JK-K. 2002. Localization of the singlestranded<br />
RNA-binding domains of Bluetongue virus nonstructural<br />
protein NS2. J Virol 76:499–506.<br />
Gougas LM, Filman DJ, Hogle JM, Gehrke L. 2004. Cofolding<br />
organizes alfalfa mosaic virus RNA and coat protein for replication.<br />
Science 306:2108–11.<br />
Hudolet C, Gowri-Shankar V, Jow H, Rattray M, Higgs PG. 2003.<br />
RNA-basedphylogeneticmethods:applicationtomammalianmitochondrial<br />
RNA sequences. Mol Phylogenet Evol 28:241–52.<br />
Isogai M, Yoshikawa N. 2005. Mapping the RNA-binding domain<br />
on the apple chlorotic leaf spot virus movement protein. J Gen<br />
Virol 86:225–9.<br />
Jenkins GM, <strong>Rambaut</strong> A, Pybus OG, Holmes EC. 2002. Rates of<br />
molecular evolution in RNA viruses: a quantitative phylogenetic<br />
analysis. J Mol Evol 54:152–61.<br />
Jow H, Hudolet C, Rattray M, Higgs PG. 2002. Bayesian phylogenetics<br />
using an RNA substitution model applied to early<br />
mammalian evolution. Mol Biol Evol 19:1591–601.<br />
Kelleher AD, Long C, Holmes EC, et al. (18 co-authors). 2001.<br />
Clustered mutations in HIV-1 gag are consistently required for<br />
escape from HLA-B27-restricted cytotoxic T-lymphocyte<br />
responses. J Exp Med 193:375–85.<br />
Kondrashov AS. 1988. Deleterious mutations and the evolution of<br />
sexual reproduction. Nature 336:435–40.<br />
Lunter G, Hein J. 2004. A nucleotide substitution model with<br />
nearest-neighbor interactions. Bioinformatics 20:i216–23.<br />
Michalakis Y, Roze D. 2004. Epistasis in RNA viruses. Science<br />
306:1492–3.<br />
Rimmelzwann GF, Berkhoff EG, Nieuwkoop NJ, Smith DJ,<br />
Fouchier RA, Osterhaus AD. 2005. Full restoration of viral fitness<br />
by multiple compensatory mutations in the nucleoprotein<br />
of influenza A virus cytotoxic T-lymphocyte escape mutants.<br />
J Gen Virol 86:1801–5.<br />
Sanjuan R, Moya A, Elena SF. 2004. The distribution of fitness<br />
effects caused by single-nucleotide substitutions in an RNA<br />
virus. Proc Natl Acad Sci USA 101:8396–401.<br />
Siepel A, Haussler D. 2004. Phylogenetic estimation of contextdependent<br />
substitution rates by maximum likelihood. Mol Biol<br />
Evol 21:468–88.<br />
Simmonds P, Smith DB. 1999. Structural constraints on RNA<br />
virus evolution. J Virol 73:5787–94.
1730 Shapiro et al.<br />
Simmonds P, Tuplin A, Evans DJ. 2004. Detection of genomescale<br />
ordered RNA structure (GORS) in genomes of<br />
positive-stranded RNA viruses: implications for virus evolution<br />
and host persistence. RNA 10:1337–51.<br />
Swofford DL. 2003. PAUP*. Phylogenetic analysis using parsimony<br />
(*and other methods). Sunderland, MA: Sinauer Associates.<br />
Swofford DL, Maddison DR. 1987. Reconstructing ancestral character<br />
states under Wagner parsimony. Math Biosci 87:199–229.<br />
Taliansky ME, Robinson DJ. 2003. Molecular biology of umbraviruses:<br />
phantom warriors. J Gen Virol 84:1951–60.<br />
Thurner C, Witwer C, Hofacker IL, Stadler PF. 2004. Conserved<br />
RNA secondary structures in Flaviridae genomes. J Gen Virol<br />
85:1113–24.<br />
Whelan S, Goldman N. 2001. A general empirical model of<br />
protein evolution derived from multiple protein families<br />
using a maximum-likelihood approach. Mol Biol Evol 18:<br />
691–9.<br />
Wilke CO, Lenski RE, Adami C. 2003. Compensatory mutations<br />
cause excess of antagonistic epistasis in RNA secondary structure<br />
folding. BMC Evol Biol 3:3.<br />
Yang ZH. 1997. PAML: a program package for phylogenetic analysis<br />
by maximum likelihood. Comput Appl Biosci 13:555–6.<br />
Yang ZH, Nielsen R. 1998. Synonymous and nonsynonymous<br />
rate variation in nuclear genes of mammals. J Mol Evol<br />
46:409–18.<br />
Peter Lockhart, Associate Editor<br />
Accepted June 1, 2006