1 - Typhoon Committee
1 - Typhoon Committee
1 - Typhoon Committee
- No tags were found...

Create successful ePaper yourself
Turn your PDF publications into a flip-book with our unique Google optimized e-Paper software.
ECONOMIC AND SOCIAL COMMISSION<br />
FOR ASIA AND THE PACIFIC<br />
AND<br />
WORLD METEOROLOGICAL ORGANIZATION<br />
WRD/TC.43/5.1 Add. 1<br />
18 January 2011<br />
<strong>Typhoon</strong> <strong>Committee</strong><br />
Forty Third Session<br />
17 to 22 January 2011<br />
Jeju, Republic of Korea<br />
REPORT ON AMENDMENTS TO THE TYPHOON COMMITTEE<br />
OPERATIONAL MANUAL<br />
(Item 5 of the Provisional Agenda)<br />
Submitted by the Rapporteur<br />
1
Introduction<br />
1. The <strong>Typhoon</strong> <strong>Committee</strong> Operational Manual - Meteorological Component (TOM) has<br />
been reviewed and updated every year since its first issue in 1987. The 2010 edition was<br />
completed and posted on the WMO website in March 2010 in accordance with the approval of<br />
amendments to the previous issue by the 42nd session of the <strong>Typhoon</strong> <strong>Committee</strong> (25 to 29<br />
January 2010, Singapore).<br />
2. At the 42nd session, the <strong>Committee</strong> decided that the rapporteur of the Japan<br />
Meteorological Agency (JMA) would continue arrangements for updating the TOM. In this<br />
connection, on 15 September 2010, the rapporteur, Mr Masashi Kunitsugu, Head of the JMA<br />
National <strong>Typhoon</strong> Center invited the focal points of the meteorological component of the<br />
Members to provide proposals for updates to the TOM.<br />
3. As of the end of December 2010, proposals for updates to the TOM had been submitted<br />
by the five focal points of Hong Kong - China, Japan, Macao - China, Malaysia and Thailand.<br />
4. Proposed amendments to the TOM are attached as Annex 1 and given below are the<br />
major points of the amendments:<br />
- Inclusion of guidelines for converting between various wind averaging periods in tropical<br />
cyclone conditions (Chapter 1 and a new appendix 1-A)<br />
- Update of information on RADOB and SAREP reports (Chapter 2)<br />
- Update of information on telecommunication network (Chapter 5)<br />
- Update of information on technical specifications of radars in Japan, Macao - China<br />
(Appendix 2-D)<br />
- Update of outline of RSMC Tokyo tropical cyclone prediction models (Appendix 3-A)<br />
- Update of information on operational typhoon track forecast methods of Hong Kong -<br />
China (Appendix 3-B)<br />
- Update of outline of HKO models (Appendix 3-E)<br />
- Adding weather forecast area of Malaysia (4-B)<br />
- Update of contact list of Hong Kong – China, Japan and Malaysia (Appendix 5-A)<br />
- Update of data distribution tables (Appendix 5-C)<br />
<br />
Action Proposed<br />
5. The <strong>Committee</strong> is invited to:<br />
(a) Note the information given in this document,<br />
(b) Review and approve the proposed amendments to the TOM attached as Annex 1 with<br />
necessary modifications.<br />
2
Annex 1<br />
Draft Amendments to<br />
the <strong>Typhoon</strong> <strong>Committee</strong> Operational Manual – Meteorological Component (TOM)<br />
proposed by the Members<br />
Page Line Present Description Proposed Amendment<br />
Chapter 1<br />
<br />
Maximum sustained wind:<br />
Chapter 2<br />
8 8 <br />
JPBN, JGQH, JDWX, JIVB and<br />
JCCX<br />
8 12 JMA research vessels JGQH,<br />
JDWX, JIVB and JCCX<br />
8 33 <br />
Reports will be coded in the RADOB<br />
code (FM 20-VIII)<br />
9 14 <br />
2.4.2 SAREP reports<br />
Chapter 3<br />
15 Table <br />
3.3 MTSAT-1R<br />
Maximum sustained wind*:<br />
<br />
For converting the wind speeds of different<br />
averaging periods such as 1-min, 2-min, 3-min<br />
and 10-min, Tropical Cyclone Programme of<br />
WMO recommends to follow the guidelines as<br />
shown in the Appendix 1-B.<br />
<br />
JPBN and JGQH<br />
JMA research vessel JGQH<br />
Reports will be coded in the BUFR code<br />
(FM-94) with RADOB Template<br />
(TM316050) and/or the RADOB code (FM<br />
20-VIII)<br />
<br />
New document (see Annex 1-2)<br />
MTSAT-2<br />
(a) Surface data<br />
(b) Upper-air data<br />
Chapter 4<br />
18 25 <br />
In the special case of SIGMET<br />
messages for tropical cyclones, an<br />
outlook should be included, giving<br />
information for up to 24 hours ahead<br />
concerning the expected positions of<br />
the centre of the tropical cyclone.<br />
18 40 , to be used in the preparation of the<br />
outlook part of the SIGMET<br />
messages for tropical cyclones<br />
(a) Surface data<br />
(TAC/TDCF)<br />
(b) Upper-air data<br />
(TAC/TDCF)<br />
<br />
<br />
3
Chapter 5<br />
21 Table<br />
5.1<br />
<br />
Beijing - Tokyo<br />
Cable (MPLS), 1 Mbps TCP/IP<br />
Beijing 2 Mbps/Tokyo 3 Mbps<br />
Beijing - Tokyo<br />
Cable (MPLS), TCP/IP<br />
Beijing 3 Mbps/Tokyo 3 Mbps<br />
Bangkok - Beijing<br />
Cable (IPLC), 64 kbps, FTP protocol<br />
Bangkok - Hanoi<br />
Cable (IPLC), 64 kbps, FTP protocol<br />
Bangkok - Phnom Penh<br />
Internet (VPN)<br />
Bangkok - Vientiane<br />
Cable (DDN), 64 kbps, FTP protocol<br />
Bangkok - Kuala Lumpur<br />
Cable (IP-VPN), 64 kbps, socket<br />
Bangkok - Singapore<br />
Cable (IP-VPN), 64 kbps, socket<br />
21 Bangkok - Beijing<br />
Cable, 9600 bps X.25<br />
21 Bangkok - Hanoi<br />
Cable, 1200 bauds<br />
21 Bangkok - Phnom Penh<br />
Internet, IP VPN<br />
21 Bangkok - Vientiane<br />
DDN, 64 kbps, FTP Protocol<br />
22 Bangkok - Kuala Lumpur<br />
Cable (FR), 64 kbps/CIR 16<br />
22 Bangkok - Singapore<br />
Cable (FR), 16 kbps<br />
Appendix 2-A<br />
32 23 <br />
Thailand<br />
Thailand<br />
432, 455, 456<br />
432, 453, 456<br />
Appendix 2-B<br />
33 <br />
New document (see Annex 1-3)<br />
Appendix 2-D<br />
40-42 <br />
New document (see Annex 1-4)<br />
43 <br />
Appendix 2-E<br />
60 33 <br />
Technical specification of LRIT is<br />
given in JMA LRIT Mission<br />
Specification Implementation (Issue<br />
6, 1 Jan. 2003).<br />
61-66 <br />
Fig 2-E<br />
Appendix 2-F<br />
68 footn<br />
ote<br />
<br />
* Macao, China receives AQUA<br />
(MODIS), FY-1D (CHRPT), FY-2C&2D<br />
(S-VISSR) and TERRA (MODIS).<br />
<br />
New document (see Annex 1-5)<br />
<br />
Visible imagery of full earth’s disk of<br />
normalized geostationary projection has<br />
been disseminated via LRIT since 1 July,<br />
2010. Technical specification of LRIT is<br />
given in JMA LRIT Mission Specification<br />
Implementation (Issue 7, 1 Jul. 2010).<br />
<br />
New document (see Annex 1-6)<br />
<br />
* Macao, China receives AQUA (MODIS),<br />
FY-1D (CHRPT), FY-2 (S-VISSR) and TERRA<br />
(MODIS).<br />
4
Appendix 3-A<br />
70-71 <br />
Appendix 3-B<br />
77 <br />
Appendix 3-E<br />
135 <br />
Operational Regional Spectral<br />
Model<br />
(B) From FY-2C meteorological<br />
satellite of CMA<br />
FY-2C IR1 brightness<br />
temperature data<br />
137-<br />
138<br />
Appendix 5-A<br />
154 <br />
(Attn. Mr. Edwin S.T. Lai)<br />
stlai@hko.gov.hk<br />
154 <br />
(Director: K. Takase)<br />
155 <br />
Director: Mr. Low Kong Chiew<br />
Tel.: (+60) (3) 7957 8116<br />
(Office hours)<br />
E-mail: cfo@kjc.gov.my<br />
Appendix 5-C<br />
161-<br />
162<br />
<br />
Appendix 5-D<br />
166 <br />
RADB reports (RADB)<br />
Appendix 6-B<br />
168 <br />
iv) hourly radar observations<br />
(RADOB code)<br />
170 RADOB (PART A)<br />
RADOB<br />
<br />
New document (see Annex 1-7)<br />
<br />
New document (see Annex 1-8)<br />
<br />
(1) Operational Regional Spectral Model<br />
New document (see Annex 1-9)<br />
(B) From FY-2E meteorological satellite of<br />
CMA<br />
FY-2E IR1 brightness temperature data<br />
<br />
New document (see Annex 1-10)<br />
(Attn. Mr. K.C. Tsui)<br />
E-mail: kctsui@hko.gov.hk<br />
(Director: A. Muranaka)<br />
Director: Mr. Saw Bun Liong<br />
Tel.: (+60) (3) 7967 8116<br />
(+60) (3) 7967 8119<br />
E-mail: cfo@met.gov.my<br />
<br />
New document (see Annex 1-11)<br />
<br />
Radar reports<br />
iv) hourly radar observations (BUFR and/or<br />
RADOB codes)<br />
RADAR<br />
RADAR reports<br />
5
Annex 1-1<br />
APPENDIX 1-B<br />
GUIDELINES FOR CONVERTING BETWEEN VARIOUS WIND AVERAGING PERIODS IN<br />
TROPICAL CYCLONE CONDITIONS<br />
This note is based on recommendations from Harper et al. (2010) and extracts from Knaff and Harper<br />
(2010), providing advice on why, when and how “wind averaging conversions” can be made.<br />
a) Why Convert Wind Speeds<br />
From the observational perspective, the aim is to process measurements of the wind so as to extract<br />
an estimate of the mean wind at any time and its turbulence properties. From the forecasting<br />
viewpoint, the aim is, given a specific wind speed metric derived from a process or product, to usefully<br />
predict other metrics of the wind. Typically these needs revolve around the concept of the mean wind<br />
speed and an associated peak gust wind speed; such that the statistical properties of the expected<br />
level of wind turbulence under different exposures can be used to permit useful conversions<br />
between peak gust wind speed estimates.<br />
b) When to Convert Wind Speeds<br />
Wind speed conversions to account for varying averaging periods only apply in the context of a<br />
maximum (peak gust) wind speed of a given duration observed within some longer interval. Simply<br />
measuring the wind for a shorter period of time at random will not ensure that it is always higher than<br />
the mean wind (given that there are both lulls and gusts). It is important that all wind speed values be<br />
correctly identified as an estimate of the mean wind or an estimate of a peak gust.<br />
Once the mean wind is reliably estimated, the random effects of turbulence in producing higher but<br />
shorter-acting wind gusts, typically of greater significance for causing damage, can be estimated using<br />
a “gust factor”. In order for a gust factor to be representative, certain conditions must be met, many of<br />
which may not be exactly satisfied during a specific weather event or at a specific location:<br />
• Wind flow is turbulent with a steady mean wind speed (statistically stationary);<br />
• Constant surface features exist within the period of measurement, such that the boundary<br />
layer is in equilibrium with the underlying surface roughness (exposure);<br />
• The conversion assumes the mean wind speed and the peak gust wind speed are at the same<br />
height (e.g. the WMO standard observation height +10 m) above the surface.<br />
c) How to Convert Individual Point-Specific Wind Speeds<br />
Firstly, the mean wind speed estimate V should be explicitly identified by its averaging period T o in<br />
seconds, described here as V To , e.g.<br />
V 600 is a 10-min averaged mean wind estimate;<br />
V 60 is a 1-min averaged mean wind estimate;<br />
V 3 is a 3-sec averaged mean wind estimate.<br />
Next, a peak gust wind speed should be additionally prefixed by the gust averaging period τ , and the<br />
time period over which it is observed (also termed the reference period), described here as Vτ ,To , e.g.<br />
V 60,600 is the highest 1-min mean (peak 1-min gust) within a 10-min observation period;<br />
is the highest 3-sec mean (peak 3-sec gust) within a 1-min observation period.<br />
V 3,60<br />
The “gust factor” Gτ ,To then relates as follows to the mean and the peak gust:<br />
,<br />
where the (true) mean wind V is estimated on the basis of a suitable sample, e.g. V 600 or V 3600 .<br />
On this basis, Table 1 provides the recommended near-surface (+10 m) conversion factors Gτ ,To<br />
between typical peak gust wind averaging periods, which are a strong function of the exposure class<br />
because the turbulence level varies depending on the surface roughness. Table 1 only provides a<br />
range of indicative exposures for typical forecasting environments and Harper et al. (2010) or WMO<br />
(2008) should be consulted for more specific advice regarding particular types of exposures -<br />
especially if it is intended to calibrate specific measurement sites to “standard exposure”.<br />
6
Table 1 Wind speed conversion factors for tropical cyclone conditions (after Harper et al. 2010).<br />
Exposure at +10 m Reference Gust Factor Gτ ,To<br />
Period<br />
Gust Duration τ (s)<br />
Class Description<br />
In-Land<br />
Off-Land<br />
Off-Sea<br />
At-Sea<br />
Roughly open<br />
terrain<br />
Offshore<br />
winds at a<br />
coastline<br />
Onshore<br />
winds at a<br />
coastline<br />
> 20 km<br />
offshore<br />
T o (s) 3 60 120 180 600<br />
3600 1.75 1.28 1.19 1.15 1.08<br />
600 1.66 1.21 1.12 1.09 1.00<br />
180 1.58 1.15 1.07 1.00<br />
120 1.55 1.13 1.00<br />
60 1.49 1.00<br />
3600 1.60 1.22 1.15 1.12 1.06<br />
600 1.52 1.16 1.09 1.06 1.00<br />
180 1.44 1.10 1.04 1.00<br />
120 1.42 1.08 1.00<br />
60 1.36 1.00<br />
3600 1.45 1.17 1.11 1.09 1.05<br />
600 1.38 1.11 1.05 1.03 1.00<br />
180 1.31 1.05 1.00 1.00<br />
120 1.28 1.03 1.00<br />
60 1.23 1.00<br />
3600 1.30 1.11 1.07 1.06 1.03<br />
600 1.23 1.05 1.02 1.00 1.00<br />
180 1.17 1.00 1.00 1.00<br />
120 1.15 1.00 1.00<br />
60 1.11 1.00<br />
Some example applications of the above recommendations are:<br />
• To estimate the expected “off-land” 3-sec peak gust in a 1-min period, multiply the estimated<br />
“off-land” mean wind speed by 1.36<br />
• To estimate the expected “off-sea” 3-sec peak gust in a 10-min period, multiply the estimated<br />
“off-sea” mean wind speed by 1.38<br />
• To estimate an “at-sea” 1-min peak gust in a 10-min period, multiply the estimated “at-sea”<br />
mean wind speed by 1.05<br />
Note that it is not possible to convert from a peak gust wind speed back to a specific time-averaged<br />
mean wind – only to the estimated true mean speed. Hence to estimate the “off-sea” mean wind<br />
speed given only a peak observed gust of 1-min duration (τ = 60 s) measured in a 10-min period (T o =<br />
600 s), multiply the observed 1-min peak gust by (1/1.11) = 0.90. This does not guarantee that the<br />
estimated mean wind will be the same as the 10-min averaged wind at that time but, because the<br />
10-min average is normally a reliable estimate of the true mean wind, it will likely be similar. In all<br />
cases, measurement systems should aim to reliably measure the mean wind speed and the standard<br />
deviation using a sample duration of not less than 10-min (WMO 2008), i.e. V 600 . Additional shorter<br />
averaging periods and the retaining of peak information should then be targeted at operational needs.<br />
d) Converting Between Agency Estimates of Storm Maximum Wind Speed Vmax<br />
This is a slightly different situation from converting a point specific wind estimate because the concept<br />
of a storm-wide maximum wind speed Vmax is a metric with an associated spatial context (i.e.<br />
anywhere within or associated with the storm) as well as a temporal fix context (at this moment in time<br />
or during a specific period of time). While it may be expressed in terms of any wind averaging period it<br />
remains important that it be unambiguous in terms of representing a mean wind or a peak gust.<br />
Agencies that apply the WMO standard 10-min averaged Vmax wind have always applied a<br />
wind-averaging conversion to reduce the maximum “sustained” 1-min wind value (a 1-min peak gust)<br />
that has been traditionally associated with the Dvorak method (Dvorak 1984, Atkinson and Holliday<br />
1977)1. As noted in the previous section, it is technically not possible to convert from a peak gust back<br />
to a specific time-averaged mean wind – only to the estimated true mean wind speed. However, in<br />
Harper et al. (2010) a practical argument is made for nominal conversion between Vmax 60 and<br />
1 As detailed in Harper et al. (2010), this traditional assumption is without a firm basis.<br />
7
Vmax 600 values via an hourly mean wind speed reference, and the recommendations are summarised<br />
in Table 2.<br />
It can be noted that the recommended conversion for at-sea exposure is about 5% higher than the<br />
“traditional” value of 0.88 (WMO 1993), which is more appropriate to an off-land exposure. This has<br />
special implications for the Dvorak method because “at sea” is the typical exposure of interest where<br />
such conversions have been traditionally applied.<br />
Table 2 Conversion factors between agency estimates of maximum 1-min and maximum 10-min<br />
averaged tropical cyclone wind speed Vmax. (after Harper et al. 2010).<br />
e) References<br />
Vmax 600 =K Vmax 60 At-Sea Off-Sea Off-land In-Land<br />
K 0.93 0.90 0.87 0.84<br />
Atkinson, G.D., and C. R. Holliday, 1977: Tropical cyclone minimum sea level pressure/maximum<br />
sustained wind relationship for the Western North Pacific. Mon. Wea. Rev., 105, 421-427.<br />
Dvorak, V.F., 1984: Tropical cyclone intensity analysis using satellite data. NOAA Tech. Rep.<br />
NESDIS 11, National Oceanic and Atmospheric Administration, Washington, DC, 47 pp.<br />
Knaff, J.A. and B.A. Harper, 2010: Tropical cyclone surface wind structure and wind-pressure<br />
relationships. In: Proc. WMO IWTC-VII, World Meteorological Organization , Keynote 1,La<br />
Reunion, Nov.<br />
Harper, B.A.,, J. D. Kepert, and J. D. Ginger, 2010: Guidelines for converting between various wind<br />
averaging periods in tropical cyclone conditions. World Meteorological Organization, TCP<br />
Sub-Project Report, WMO/TD-No. 1555.<br />
WMO 1993: Global guide to tropical cyclone forecasting. Tropical Cyclone Programme Report No.<br />
TCP-31, World Meteorological Organization, WMO/TD – No. 560, Geneva.<br />
WMO 2008: Guide to meteorological instruments and methods of observation. World Meteorological<br />
Organization , WMO-No. 8, 7th Ed, 681pp.<br />
8
Annex 1-2<br />
2.4.2 SAREP reports<br />
SAREP reports (Part A) are disseminated eight times a day in the following cases<br />
from the RSMC Tokyo - <strong>Typhoon</strong> Center to <strong>Typhoon</strong> <strong>Committee</strong> Members through the GTS<br />
under the heading of IUCC10 RJTD in the BUFR code (FM 94):<br />
(i)<br />
(ii)<br />
(iii)<br />
when a tropical cyclone of TS intensity or higher is located in the<br />
responsible area of the RSMC Tokyo - <strong>Typhoon</strong> Center;<br />
when a tropical depression existing in the responsible area is forecasted to<br />
have an intensity of TS or higher within 24 hours; or<br />
when an area of wind speed of 34 knots or higher caused by a tropical<br />
cyclone is forecasted to be in the responsible area within 24 hours.<br />
9
Annex 1-3<br />
APPENDIX 2-B<br />
LIST OF STATIONS FROM WHICH ENHANCED<br />
UPPER-AIR OBSERVATIONS ARE AVAILABLE<br />
The following stations will make 6-hourly upper-air observations when they are<br />
within 300 km of the centre of a tropical cyclone of TS intensity or higher:<br />
Cambodia<br />
China<br />
(54): 857<br />
(57): 083, 494, 972<br />
(58): 150, 457, 847<br />
(59): 316, 758, 981<br />
Democratic People's Republic of Korea<br />
(47): 041, 058<br />
Hong Kong, China<br />
Japan<br />
(45): 004<br />
# radiosonde observations supplemented by wind profiler observations at 06<br />
and 18 UTC when necessary<br />
(47): 401, 412, 418, 582, 600, 646, 678, 741, 778,<br />
807, 827, 909, 918, 945, 971*, 991*<br />
* except 18 UTC<br />
Lao People's Democratic Republic<br />
12/13/10 4:49 PM<br />
Deleted: 420<br />
12/13/10 4:49 PM<br />
Deleted: 744<br />
Macao, China<br />
Malaysia<br />
(48): 601, 615, 650, 657<br />
(96): 413, 441, 471, 481<br />
Philippines<br />
(98): 223, 433, 444, 618, 646, 573<br />
Republic of Korea<br />
Thailand<br />
(47): 090, 102, 122, 138, 158, 169, 185<br />
(48): 327, 407, 453, 480, 500, 551, 565, 568<br />
12/27/10 2:30 PM<br />
Deleted: 455<br />
10
Annex 1-4<br />
APPENDIX 2-D, p.5<br />
Name of the Member Japan - 2<br />
NAME OF<br />
STATION<br />
Tokyo<br />
/Kashiwa<br />
Niigata<br />
/Yahikoyama<br />
Fukui<br />
/Tojimbo<br />
Nagano<br />
/Kurumayama<br />
Shizuoka<br />
/Makinohara<br />
SPECIFICATIONS<br />
Unit<br />
Index number 47695 47572 47705 47611 47659<br />
Location of station<br />
35° 52´ N 37° 43´ N 36° 14´ N 36° 06´ N 34° 45´ N<br />
139° 58´ E 138° 49´ E 136° 09´ E 138° 12´ E 138° 08´E<br />
Antenna elevation m 74.0 645.0 107.0 1937.1 186.0<br />
Wave length cm 5.59 5.61 5.59 5.64 5.66<br />
Peak power of transmitter kW 250 250 250 250 250<br />
Pulse length µ s 1.1/2.6 1.0/2.6 1.1/2.7 2.6 2.6<br />
12/13/10 4:51 PM<br />
Deleted: 68<br />
Sensitivity minimum of<br />
receiver<br />
Beam width<br />
(Width of over -3dB<br />
antenna gain of maximum)<br />
dBm<br />
deg<br />
-109/-113 -109/-113 -109/-113 -114 -113<br />
1.0(H)<br />
1.0(V)<br />
1.0(H)<br />
1.0(V)<br />
1.1(H)<br />
1.0(V)<br />
1.1(H)<br />
1.1(V)<br />
Detection range km 400 400 400 400 400<br />
1.0(H)<br />
1.1(V)<br />
12/13/10 4:51 PM<br />
Deleted: -112<br />
12/13/10 4:51 PM<br />
Deleted: 1<br />
Scan mode in observation<br />
1.Fixed<br />
elevation<br />
2.CAPPI<br />
3.Manually<br />
controlled<br />
DATA PROCESSING<br />
MTI processing<br />
1.Yes, 2.No<br />
Doppler processing<br />
1.Yes, 2.No<br />
Display<br />
1.Digital,<br />
2.Analog<br />
OPERATION MODE (When tropical<br />
2 2 2 2 2<br />
1 1 1 1 1<br />
1 1 1 2 2<br />
1 1 1 1 1<br />
12/13/10 4:51 PM<br />
Deleted: 2<br />
cyclone is within range of detection)<br />
1.Hourly<br />
2.3-hourly<br />
3.Others<br />
1 1 1 1 1<br />
PRESENT STATUS<br />
1.Operational<br />
1 1 1 1 1<br />
2.Not operational (for research etc.)<br />
11
APPENDIX 2-D, p.6<br />
Name of the Member Japan - 3<br />
NAME OF<br />
STATION<br />
Nagoya<br />
Osaka<br />
/Takayasuyama<br />
Matsue<br />
/Misakayama<br />
Hiroshima<br />
/Haigamine<br />
Murotomisaki<br />
SPECIFICATIONS<br />
Unit<br />
Index number 47636 47773 47791 47792 47899<br />
Location of station<br />
35° 10´ N 34° 37´ N 35° 33´ N 34° 16´ N 33° 15´ N<br />
136° 58´ E 135° 39´ E 133° 06´ E 132° 36´ E 134° 11´E<br />
Antenna elevation m 73.1 497.6 553.0 746.9 198.9<br />
Wave length cm 5.59 5.61 5.61 5.59 5.60<br />
Peak power of transmitter kW 250 250 250 250 250<br />
Pulse length µ s 1.1/2.6 1.0/2.6 1.1/2.6 1.1/2.7 1.1/2.6<br />
Sensitivity minimum of<br />
receiver<br />
Beam width<br />
(Width of over -3dB<br />
antenna gain of maximum)<br />
dBm<br />
deg<br />
-108/-112 -108/-112 -109/-112 -109/-111 -109/-113<br />
1.0(H)<br />
1.0(V)<br />
1.1(H)<br />
1.1(V)<br />
1.0(H)<br />
1.1(V)<br />
1.1(H)<br />
1.0(V)<br />
Detection range km 400 400 400 400 400<br />
Scan mode in observation<br />
elevation<br />
controlled<br />
1.Fixed<br />
2.CAPPI<br />
3.Manually<br />
DATA PROCESSING<br />
MTI processing<br />
1.Yes, 2.No<br />
1.0(H)<br />
1.0(V)<br />
2 2 2 2 2<br />
1 1 1 1 1<br />
12/13/10 4:52 PM<br />
Deleted: 6<br />
12/13/10 4:53 PM<br />
Deleted: 66<br />
12/13/10 4:52 PM<br />
Deleted: 2.8<br />
12/13/10 4:53 PM<br />
Deleted: 2.8<br />
12/13/10 4:52 PM<br />
Deleted: -113<br />
12/13/10 4:53 PM<br />
Deleted: -112<br />
12/13/10 4:53 PM<br />
Deleted: 0<br />
12/13/10 4:54 PM<br />
Deleted: 0<br />
12/13/10 4:53 PM<br />
Deleted: 0<br />
Doppler processing<br />
1.Yes, 2.No<br />
Display<br />
1.Digital,<br />
2.Analog<br />
OPERATION MODE (When tropical<br />
1 1 1 1 1<br />
1 1 1 1 1<br />
12/13/10 4:53 PM<br />
Deleted: 2<br />
12/13/10 5:06 PM<br />
Deleted: 2<br />
cyclone is within range of detection)<br />
1.Hourly<br />
2.3-hourly<br />
3.Others<br />
1 1 1 1 1<br />
PRESENT STATUS<br />
1.Operational<br />
1 1 1 1 1<br />
2.Not operational(for research etc.)<br />
12
APPENDIX 2-D, p.7<br />
Name of the Member Japan - 4<br />
NAME OF<br />
STATION<br />
Fukuoka<br />
/Sefurisan<br />
Tanegashima<br />
/Nakatane<br />
Naze<br />
/Funchatoge<br />
Naha<br />
/Itokazu<br />
Ishigakijima<br />
/Omotodake<br />
SPECIFICATIONS<br />
Unit<br />
Index number 47806 47869 47909 47937 47920<br />
Location of station<br />
33° 26´ N 30° 38´ N 28° 24´ N 26° 09´ N 24° 26´ N<br />
130° 21´ E 130° 59´ E 129° 33´ E 127° 46´ E 124° 11´E<br />
Antenna elevation m 982.7 290.5 315.7 208.2 535.5<br />
Wave length cm 5.60 5.60 5.66 5.60 5.61<br />
Peak power of transmitter kW 250 250 250 250 250<br />
Pulse length µ s 1.1/2.7 1.1/2.7 2.6 1.0/2.5 1.1/2.7<br />
12/13/10 5:07 PM<br />
Deleted: 5.70<br />
Sensitivity minimum of<br />
receiver<br />
dBm<br />
-109/-112 -108/-112 -113 -109/-113 -107/-111<br />
12/13/10 5:07 PM<br />
Beam width<br />
(Width of over -3dB<br />
antenna gain of maximum)<br />
deg<br />
1.0(H)<br />
1.0(V)<br />
1.1(H)<br />
1.0(V)<br />
1.1(H)<br />
1.0(V)<br />
1.0(H)<br />
1.0(V)<br />
1.1(H)<br />
1.1(V)<br />
Deleted: -113<br />
Detection range km 400 400 400 400 400<br />
Scan mode in observation<br />
1.Fixed<br />
elevation<br />
2.CAPPI<br />
3.Manually<br />
controlled<br />
DATA PROCESSING<br />
MTI processing<br />
1.Yes, 2.No<br />
Doppler processing<br />
1.Yes, 2.No<br />
Display<br />
1.Digital,<br />
2.Analog<br />
OPERATION MODE (When tropical<br />
2 2 2 2 2<br />
1 1 1 1 1<br />
1 1 2 1 1<br />
1 1 1 1 1<br />
12/13/10 5:07 PM<br />
Deleted: 2<br />
cyclone is within range of detection)<br />
1.Hourly<br />
2.3-hourly<br />
3.Others<br />
1 1 1 1 1<br />
PRESENT STATUS<br />
1.Operational<br />
1 1 1 1 1<br />
2.Not operational(for research etc.)<br />
13
Annex 1-5<br />
APPENDIX 2-D, p.8<br />
Name of the Member Macao, China<br />
NAME OF<br />
STATION<br />
TAIPA<br />
GRANDE<br />
SPECIFICATIONS<br />
Unit<br />
Index number 45011<br />
Location of station<br />
22.1599N<br />
113.5624E<br />
Antenna elevation m 183<br />
Wave length cm 3.4<br />
Peak power of transmitter kW 200<br />
Pulse length<br />
Sensitivity minimum of<br />
receiver<br />
µ s<br />
dBm<br />
0.4, 0.8, 1.0,<br />
2.0<br />
-113<br />
12/20/10 1:37 PM<br />
Deleted: 285714<br />
12/20/10 1:38 PM<br />
Deleted: 0.2, 0.5,<br />
Beam width<br />
(Width of over -3dB<br />
antenna gain of maximum)<br />
deg<br />
1°<br />
Detection range km 128<br />
Scan mode in observation<br />
1. Fixed elevation<br />
3<br />
2. CAPPI<br />
3. Manually controlled<br />
12/20/10 1:38 PM<br />
Deleted: 500 (reflection)<br />
250 (velocity)<br />
12/20/10 1:38 PM<br />
Deleted: Others<br />
DATA PROCESSING<br />
MTI processing<br />
1.Yes, 2.No<br />
Doppler processing<br />
1.Yes, 2.No<br />
Display<br />
1.Digital, 2.Analog<br />
2<br />
1<br />
1<br />
OPERATION MODE (When tropical<br />
cyclone is within range of detection)<br />
1. Hourly<br />
3<br />
2. 3-hourly<br />
3. Others<br />
PRESENT STATUS<br />
1.Operational<br />
2<br />
2.Not operational (for research etc.)<br />
14
Annex 1-6<br />
APPENDIX 2-E, p.2<br />
Figure 2-E.1 Time Table for Operation of MTSAT-2 (1/5)<br />
15<br />
12/13/10 6:10 PM<br />
Deleted: 1R
APPENDIX 2-E, p.3<br />
Figure 2-E.1 Time Table for Operation of MTSAT-2 (2/5)<br />
16<br />
12/13/10 6:10 PM<br />
Deleted: 1R
APPENDIX 2-E, p.4<br />
A. Notes<br />
- This timetable is effective from 0230 UTC on 1 July 2010.<br />
- For updated information on the dissemination timetable, please refer to MANAM, which is<br />
disseminated via MTSAT-1R and is also available on our web site.<br />
Via MTSAT-1R<br />
HRIT: MANAM is sent along with imagery of N02 and N08<br />
(shown as “N02” or “N08” on a sky-blue ground in the timetable)<br />
LRIT: MANAM is sent along with imagery of PS-N02 and PS-N08<br />
(shown as “PS-N02” or “PS-N08” on a green ground in the timetable)<br />
Website:<br />
URL: http://mscweb.kishou.go.jp/operation/index.htm<br />
Fig 2-E.1 Time Table for Operation of MTSAT-2 (3/5)<br />
17<br />
12/13/10 6:21 PM<br />
Deleted: 1R
APPENDIX 2-E, p.5<br />
Figure 2-E.1 Time Table for Operation of MTSAT-2 (4/5)<br />
18<br />
12/13/10 6:23 PM<br />
Deleted: 1R
APPENDIX 2-E, p.6<br />
Figure 2-E.1 Time Table for Operation of MTSAT-2 (5/5)<br />
19<br />
12/13/10 6:22 PM<br />
Deleted: 1R
APPENDIX 2-E, p.7<br />
Full earth's Disk of normalized geostationary<br />
projection<br />
Polar-stereographic projection covering East<br />
Asia<br />
Polar-stereographic projection covering the<br />
north-east of Japan<br />
Polar-stereographic projection covering the<br />
south-west of Japan<br />
Figure 2-E. 2 LRIT Images<br />
20
Annex 1-7<br />
APPENDIX 3-A, p1<br />
OUTLINE OF RSMC TOKYO - TROPICAL CYCLONE PREDICTION MODELS<br />
(a) Global Spectral Model (GSM-1011)<br />
Data Assimilation:<br />
- 4-D variational calculus (4D-VAR) with its own 3 to 9-hours prediction used as a first<br />
guess back ground (6-hours assimilation window)<br />
- Data cut-off at 2.3 hours from synoptic time for prediction model, at 5.6 ~ 11.6 hours<br />
from synoptic time for assimilation cycle<br />
- Dynamic quality control considering temporal and spatial variabilities<br />
- Reduced Gaussian grid, roughly equivalent to 0.1875° x 0.1875° lat-lon<br />
- Model p-sigma hybrid levels (60) + surface (1)<br />
(bogusing of tropical cyclones)<br />
- Axis-symmetric structure based on Frank’s (1977) empirical formula with parameters<br />
prescribed on forecasters’ analysis mainly applying the Dvorak method to MTSAT<br />
imagery<br />
- Asymmetric structure derived from first-guess field (prediction using GSM)<br />
- Bogus structure is given as pseudo-observation data to the analysis for the prediction<br />
model<br />
Operation:<br />
(schedule)<br />
Four times a day (0000, 0600, 1200 and 1800 UTC)<br />
(integration time)<br />
84 hours from 0000, 0600 and 1800 UTC, and 216 hours from 1200 UTC<br />
12/13/10 5:08 PM<br />
Deleted: 0711<br />
12/13/10 5:08 PM<br />
Deleted: 2<br />
12/13/10 5:08 PM<br />
Deleted: 2<br />
12/13/10 5:08 PM<br />
Deleted: 0.1875° x 0.1875°<br />
12/13/10 5:09 PM<br />
Deleted: (1920 x 960)<br />
12/13/10 5:09 PM<br />
Deleted: Initialization:<br />
Incremental initialization by Ballish et al.<br />
(1992) and vertical mode initialization by<br />
Bourke and McGregor (1983)<br />
Prediction model:<br />
(dynamics)<br />
- Hydrostatic, primitive, semi-Lagrangian-form equations<br />
- Semi-implicit time integration<br />
- TL959 (~20km grid) spectral discretization in the horizontal direction<br />
- Finite differencing on 60 p-sigma hybrid levels in the vertical direction<br />
- Horizontal diffusion by linear second-order Laplacian<br />
(physics)<br />
- Arakawa-Schubert (1974) cumulus parameterization with modifications by Moorthi and<br />
Suarez (1992), Randall and Pan (1993) and Kuma and Cho (1994)<br />
- Prognostic cloud water scheme by Smith (1990)<br />
- Bulk formulae for surface fluxes with similarity functions by Louis (1982)<br />
- Vertical diffusion with the level-2 closure model by Mellor and Yamada (1974) with moist<br />
effect included<br />
- Gravity wave drag by Palmer et al. (1986) and Iwasaki et al. (1989)<br />
- Simple Biospheric Model (SiB) by Sellers et al. (1986) and Sato et al. (1989a,b)<br />
12/13/10 5:10 PM<br />
Deleted: - Horizontal diffusion by linear<br />
second-order Laplacian<br />
Boundary conditions:<br />
(SST)<br />
0.25° x 0.25° daily analysis with climatic seasonal trend<br />
APPENDIX 3-A, p2<br />
(b) <strong>Typhoon</strong> Ensemble Prediction System (TEPS)<br />
21
Initial condition:<br />
Interpolation of the initial condition for GSM plus ensemble perturbations<br />
Methods to make ensemble perturbations:<br />
- Singular vector (SV) method<br />
- Linearized model and its adjoint version based on those adopted in 4-D variational<br />
calculus, which consist of full dynamics of Eulerian integrations and full physical<br />
processes containing representations of vertical diffusion, gravity wave drag, large-scale<br />
condensation, long-wave radiation and deep cumulus convection<br />
- T63 (~180 km grid) spectral discretization in the horizontal direction<br />
- Finite differencing on 40 p-sigma hybrid levels in the vertical direction<br />
Ensemble size:<br />
11<br />
Operation:<br />
(schedule)<br />
Four times a day (0000, 0600, 1200 and 1800 UTC)<br />
(tropical cyclone conditions that can trigger model prediction)<br />
- a tropical cyclone of TS intensity or higher exists in the area of responsibility (0°N - 60°N,<br />
100°E - 180°E)<br />
- a tropical cyclone is expected to reach TS intensity or higher in the area within the next<br />
24 hours<br />
- a tropical cyclone of TS intensity or higher is expected to move into the area within the<br />
next 24 hours<br />
(maximum number of predictions)<br />
Three for each synoptic time (0000, 0600, 1200 and 1800 UTC)<br />
(integration time)<br />
132 hours<br />
(domain)<br />
globe<br />
12/13/10 5:10 PM<br />
Deleted: (to be determined)<br />
12/13/10 5:11 PM<br />
Deleted: (to be determined)<br />
(Prediction model)<br />
- Lower-resolution version of the GSM<br />
- TL319 (~55 km grid) spectral discretization in the horizontal direction<br />
- Finite differencing on 60 p-sigma hybrid levels in the vertical direction<br />
12/13/10 5:11 PM<br />
Deleted: Initialization:<br />
Non-linear normal mode initialization<br />
based on Machenhauer (1977)<br />
22
Annex 1-8<br />
APPENDIX 3-B, p.6<br />
Name of the Member Hong Kong, China<br />
Item Method Type of output<br />
Name of the<br />
method<br />
Description of<br />
the method<br />
Operational Regional Spectral Model<br />
(ORSM)<br />
Non-Hydrostatic Model (NHM)<br />
See Appendix 3-E<br />
Tropical cyclone<br />
position forecasts,<br />
surface and upper<br />
level prognoses up<br />
to 72 hours from<br />
60-km ORSM and<br />
up to 42 hours from<br />
20-km ORSM.<br />
Tropical cyclone<br />
forecast guidance<br />
bulletins based on<br />
the 60-km ORSM<br />
will be<br />
disseminated<br />
through the GTS<br />
when a tropical<br />
cyclone is within<br />
10N to 30N and<br />
105E to 125E.<br />
Development is<br />
underway to<br />
generate tropical<br />
cyclone forecast<br />
guidance bulletins<br />
based on 10-km<br />
NHM to replace<br />
ORSM products.<br />
23
Annex 1-9<br />
APPENDIX 3-E, p.3<br />
(2) Non-Hydrostatic Model (NHM)<br />
Name of the method:<br />
Non-Hydrostatic Model (NHM)<br />
Description of the method:<br />
HKO started to operate NHM system based on JMA-NHM (Saito et al. 2006) with horizontal<br />
resolution at 10-km and 2-km in June 2010 to provide forecasts up to 72 hours and 15 hours<br />
ahead respectively (Wong 2010). Development of TC track and intensity forecast products<br />
based on the 10-km NHM is underway to replace those from ORSM forecasts.<br />
In NHM, a 3-dimensional variational data assimilation (3DVAR) system is used to generate<br />
the initial condition on model levels using the following meteorological observations:<br />
(A)<br />
GTS<br />
SYNOP, SHIP and BUOY<br />
TEMP and PILOT<br />
AMDAR and AIREP<br />
AMV<br />
ATOVS<br />
synoptic stations, ship and buoy data<br />
radiosonde and pilot data<br />
aircraft data<br />
atmospheric motion vectors from MTSAT-2/MTSAT-1R<br />
retrieved temperature profiles from NOAA<br />
(B)<br />
(C)<br />
(D)<br />
Internet<br />
(i) NCEP global high resolution daily sea surface temperature analysis at 0.083<br />
degree resolution<br />
(ii) Retrieved total precipitable water over ocean surface from SSM/I and AMSR-E<br />
Regional data exchange<br />
Data from automatic weather stations over the south China coastal areas<br />
Local data<br />
(i) Tropical cyclone bogus data based on forecasters’ analysis during TC situations<br />
(ii) Automatic weather station data<br />
(iii) Wind profiler data<br />
(iv) Doppler weather radar data<br />
(v) GPS total precipitable water vapour<br />
The 3DVAR analysis for 10-km NHM is produced eight times a day at 00, 03, 06, 09, 12,<br />
15, 18, and 21 UTC. Hourly analysis is performed for the 2-km NHM.<br />
Specifications of the forecast model are given in the following table:<br />
Basic equations<br />
Vertical coordinates<br />
Forecast parameters<br />
Map projection<br />
Number of grid points<br />
Forecast range<br />
Initial condition<br />
Fully compressible non-hydrostatic governing equations<br />
Terrain following height coordinates system<br />
wind (u,v,w), 3-dimensional pressure, potential temperature,<br />
specific humidity of water vapour, cloud water, cloud ice, rain<br />
water, hail/graupel and snow<br />
Mercator<br />
10-km NHM: 585x405, 50 levels<br />
2-km NHM: 305x305, 60 levels<br />
10-km NHM: 72 hours<br />
2-km NHM: 15 hours<br />
Analysis from NHM 3DVAR on model levels<br />
24
APPENDIX 3-E, p.4<br />
Boundary condition<br />
For 10-km NHM, 3-hourly interval boundary data including<br />
horizontal wind, temperature, relative humidity, geopotential<br />
height and surface pressure from JMA Global Spectral Model<br />
forecast at horizontal resolution of 0.5 degree in<br />
latitude/longitude and on 21 pressure levels (1000, 975, 950,<br />
925, 900, 850, 800, 700, 600, 500, 400, 300, 250, 200, 150,<br />
100, 70, 50, 30, 20, and 10 hPa)<br />
Nesting configuration<br />
Topography and land-use<br />
Dynamics<br />
Moisture process<br />
For 2-km NHM, hourly interval boundary data provided from<br />
10-km NHM forecasts<br />
One-way nesting<br />
USGS GTOPO30 (30 second data smoothed to 1.5 times of<br />
horizontal resolution)<br />
USGS Global Land Cover Characterization (GLCC) 30<br />
second data<br />
Non-hydrostatic governing equations solved by time-splitting<br />
horizontal-explicit-vertical-implicit (HEVI) scheme using<br />
4-order centred finite difference in flux form<br />
Kain-Fritsch convective parameterization (JMA-NHM version)<br />
Three ice bulk microphysics scheme<br />
Surface process Flux and bulk coefficients: Beljaars and Holtslag (1991)<br />
Stomatal resistance and temporal change of wetness<br />
included<br />
4-layer soil model to predict ground temperature and surface<br />
heat flux.<br />
Turbulence closure model<br />
and planetary boundary<br />
Mellor-Yamada-Nakanishi-Niino Level 3 (MYNN-3) (Nakanishi<br />
and Niino, 2004) with partial condensation scheme (PCS) and<br />
layer process<br />
implicit vertical turbulent solver. Height of PBL calculated<br />
from virtual potential temperature profile.<br />
Radiation Long wave radiation process follows Kitagawa (2000)<br />
Short wave radiation process using Yabu and Kitagawa<br />
(2005)<br />
Prognostic surface temperature included; Cloud fraction<br />
determined from PCS.<br />
Reference<br />
Beljaars, A. C. M., and A. A. M. Holtslag, 1991: Flux parameterization and land surfaces in atmospheric models.<br />
J. Appl. Meteor., 30, 327-341.<br />
Kitagawa, H., 2000: Radiation process. NPD Report No. 46, Numerical Prediction Division, JMA, 16-31. (in<br />
Japanese)<br />
Nakanishi, M. and H. Niino, 2004: Improvement of the Mellor-Yamada level 3 model with condensation physics:<br />
Its de-sign and verification. Bound.-Layer Meteor., 112, 1-31.<br />
Saito, K., T. Fujita, Y. Yamada, J. Ishida, Y. Kumagai, K. Aranami, S. Ohmori, R. Nagasawa, S. Kumagai, C.<br />
Muroi, T. Kato, H. Eito, and Y. Yamazaki, 2006: The Operational JMA Nonhydrostatic Mesoscale Model. Mon.<br />
Wea. Rev., 134, 1266-1298.<br />
Wong, W.K., 2010: Development of Operational Rapid Update Non-hydrostatic NWP and Data Assimilation<br />
Systems in the Hong Kong Observatory, 3rd International Workshop on Prevention and Mitigation of<br />
Meteorological Disasters in Southeast Asia, 1-4 March 2010, Beppu, Japan. [Reprint available at<br />
http://www.hko.gov.hk/publica/reprint/r882.pdf]<br />
Yabu, S., S. Murai, and H. Kitagawa, 2005: Clear-sky radiation scheme. NPD Report No. 51, Numerical<br />
Prediction Division, JMA, 53-64. (in Japanese)<br />
25
Annex 1-10<br />
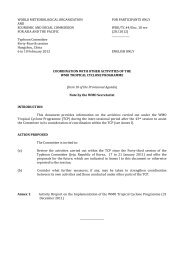
APPENDIX 4-B, p.7<br />
MALAYSIA<br />
WEATHER FORECAST AREAS<br />
26
Annex 1-11<br />
APPENDIX 5-C, p.1<br />
COLLECTION AND DISTRIIBUTION OF INFORMATION<br />
RELATED TO TROPICAL CYCLONES<br />
Receiving station<br />
Type of Data Heading TD BJ BB HH MM SL NN KK IV PP MC<br />
Enhanced SNCI30 BABJ BJ O BJ BJ TD TD BJ BB BB BB<br />
surface SNHK20 VHHH HH HH BJ O TD BB BB BB BB<br />
observation SNJP20 RJTD O TD TD TD TD BB BB BB BB<br />
SNKO20 RKSL SL TD TD TD O BB BB BB BB<br />
SNLA20 VLIV BB BB IV BB BB O BB<br />
SNMS20 WMKK BB BB KK BJ BB O BB BB<br />
SNMU40 VMMC MC BJ BJ TD BB BB BB BB O<br />
SNPH20 RPMM MM TD TD TD O TD BB BB BB BB<br />
SNTH20 VTBB BB TD O TD TD BB BB BB BB<br />
SNVS20 VNNN BB NN BJ O BB BB BB<br />
12/20/10 2:19 PM<br />
Deleted: HH<br />
Enhanced USCI01 BABJ BJ O BJ BJ TD TD BJ BB BB BB<br />
upper-air USCI03 BABJ BJ O BJ BJ TD TD BJ BB BB BB<br />
observation USCI05 BABJ BJ O BJ BJ TD TD BJ BB BB BB<br />
USCI07 BABJ BJ O BJ BJ TD TD BJ BB BB BB<br />
USCI09 BABJ BJ O BJ BJ TD TD BJ BB BB BB<br />
UKCI01 BABJ BJ O BJ BJ TD BJ BB BB BB<br />
ULCI01 BABJ BJ O BJ BJ TD BB BB BB BB<br />
ULCI03 BABJ BJ O BJ BJ TD BB BB BB BB<br />
ULCI05 BABJ BJ O BJ BJ TD BB BB BB BB<br />
ULCI07 BABJ BJ O BJ BJ TD BB BB BB BB<br />
ULCI09 BABJ BJ O BJ BJ TD BJ BB BB BB<br />
UECI01 BABJ BJ O BJ BJ TD BB BB BB BB<br />
USHK01 VHHH HH HH BJ O TD TD BB BB BB BB<br />
UKHK01 VHHH HH HH BJ O TD BB BB BB BB<br />
ULHK01 VHHH HH HH BJ O TD BB BB BB BB<br />
UEHK01 VHHH HH HH BJ O TD BB BB BB BB<br />
USJP01 RJTD O TD TD TD TD TD BB BB BB BB<br />
UKJP01 RJTD O TD TD TD TD BB BB BB BB<br />
ULJP01 RJTD O TD TD TD TD BB BB BB BB<br />
UEJP01 RJTD O TD TD TD TD BB BB BB BB<br />
USKO01 RKSL SL TD TD TD TD O BB BB BB BB<br />
UKKO01 RKSL SL TD TD TD O BB BB BB BB<br />
ULKO01 RKSL SL TD TD TD O BB BB BB BB<br />
UEKO01 RKSL SL TD TD TD O BB BB BB BB<br />
USMS01 WMKK BB TD KK TD TD TD BB O BB BB<br />
UKMS01 WMKK BB TD KK TD TD TD BB O BB BB<br />
ULMS01 WMKK BB TD KK TD TD TD BB O BB BB<br />
UEMS01 WMKK BB TD KK TD TD TD BB O BB BB<br />
USPH01 RPMM MM TD TD TD O TD BB BB BB<br />
UKPH01 RPMM MM TD TD TD O TD BB BB BB<br />
ULPH01 RPMM MM TD TD TD O TD BB BB BB<br />
Continued to UEPH01 RPMM MM TD TD TD O TD BB BB BB<br />
the next page USTH01 VTBB BB TD O TD TD TD BB BB BB BB<br />
27
APPENDIX 5-C, p.2<br />
Receiving station<br />
Type of Data Heading TD BJ BB HH MM SL NN KK IV PP MC<br />
Enhanced UKTH01 VTBB BB TD O TD TD BB BB BB BB<br />
Upper-air ULTH01 VTBB BB TD O TD TD BB BB BB BB<br />
observation UETH01 VTBB BB TD O TD TD BB BB BB BB<br />
USVS01 VNNN BB TD NN TD TD TD O BB BB BB<br />
UKVS01 VNNN BB TD NN TD TD O BB BB BB<br />
ULVS01 VNNN BB TD NN TD TD TD O BB BB BB<br />
UEVS01 VNNN BB TD NN TD TD TD O BB BB BB<br />
URPA10 PGTW * TD TD TD TD TD BB BB BB BB<br />
URPA11 PGTW * TD TD TD TD TD BB BB BB BB<br />
URPA12 PGTW * TD TD TD TD TD BB BB BB BB<br />
URPA14 PGTW * TD TD TD TD TD BB BB BB BB<br />
URPN10 PGTW * TD TD TD TD TD BB BB BB BB<br />
UZPA13 PGTW * TD TD TD TD TD BB BB BB BB<br />
UZPN13 KNHC * TD TD TD BB BB BB BB<br />
UZPN13 KWBC * TD TD TD TD BB BB BB BB<br />
UZPN13 PGTW * TD TD TD TD BB BB BB BB<br />
Enhanced SNVB20 VTBB O BB BB BB BB<br />
ship SNVB20 RJTD O TD TD TD TD TD BB BB BB BB<br />
observation SNVD20 RJTD O TD TD TD TD TD BB BB BB BB<br />
SNVE20 RJTD O TD TD TD TD TD BB BB BB BB<br />
SNVX20 RJTD O TD TD TD TD TD BB BB BB BB<br />
SNVB21 RJTD O TD TD TD TD TD BB BB BB BB<br />
SNVD21 RJTD O TD TD TD TD TD BB BB BB BB<br />
SNVE21 RJTD O TD TD TD TD TD BB BB BB BB<br />
SNVX21 RJTD O TD TD TD TD TD BB BB BB BB<br />
SNVX20 RPMM MM TD TD TD O TD BB BB BB<br />
SNVX20 VHHH HH HH BJ O TD TD BB BB BB BB<br />
SNVX20 VNNN BB TD NN TD TD O BB BB BB<br />
Enhanced SBCI30 BABJ BJ O BJ TD TD TD BJ BB BB BB<br />
radar SCCI30 BABJ O BJ BJ BB BB BB BB<br />
observation SBCI60 BCGZ O BJ BJ BB BB BB<br />
SCCI60 BCGZ HH O BJ BB BB BB BB<br />
SBHK20 VHHH HH HH BJ O TD BB BB BB BB<br />
ISBC01 VHHH HH HH HH O TD TD BB BB BB<br />
ISBC01 RJTD O TD TD TD TD TD BB BB BB<br />
SDKO20 RKSL O<br />
SDMS20 WMKK BB TD KK TD BB O BB BB<br />
SDPH20 RPMM MM TD TD O TD BB BB BB<br />
SDTH20 VTBB BB TD O TD BB BB BB BB<br />
SDVS20 VNNN BB TD NN TD TD O BB BB BB<br />
1/7/11 2:27 PM<br />
Deleted: SBJP20<br />
1/7/11 2:27 PM<br />
Deleted: RJTD<br />
1/7/11 2:27 PM<br />
Deleted: O<br />
1/7/11 2:27 PM<br />
Deleted: TD<br />
1/7/11 2:27 PM<br />
Deleted: TD<br />
1/7/11 2:27 PM<br />
Deleted: TD<br />
1/7/11 2:27 PM<br />
Deleted: TD<br />
1/7/11 2:27 PM<br />
Deleted: TD<br />
1/7/11 2:27 PM<br />
Deleted: BB<br />
1/7/11 2:27 PM<br />
Deleted: BB<br />
1/7/11 2:27 PM<br />
Deleted: BB<br />
1/7/11 2:27 PM<br />
Deleted: BB<br />
28
APPENDIX 5-C, p.3<br />
Receiving station<br />
Type of Data Heading TD BJ BB HH MM SL NN KK IV PP MC<br />
*<br />
Satellite TPPN10 PGTW TD TD BB BB BB BB<br />
guidance TPPN10 PGUA * TD TD BB BB BB BB<br />
TPPA1 RJTY * TD TD TD TD BB BB BB BB<br />
TPPA1 RODN * TD TD TD TD BB BB BB BB<br />
IUCC10 RJTD O TD TD TD TD TD BB BB BB<br />
Tropical FXPQ01 VHHH HH HH BJ O BB BB BB BB<br />
Cyclone FXPQ02 VHHH HH HH BJ O BB BB BB BB<br />
Forecast FXPQ03 VHHH HH HH BJ O BB BB BB BB<br />
FXPQ20 VHHH HH HH BJ O TD TD BB BB BB BB<br />
FXPQ20 RJTD O TD TD TD TD TD BB BB BB BB<br />
FXPQ21 RJTD O TD TD TD TD TD BB BB BB BB<br />
FXPQ22 RJTD O TD TD TD TD TD BB BB BB BB<br />
FXPQ23 RJTD O TD TD TD TD TD BB BB BB BB<br />
FXPQ24 RJTD O TD TD TD TD TD BB BB BB BB<br />
FXPQ25 RJTD O TD TD TD TD TD BB BB BB BB<br />
FXPQ29 VTBB O<br />
FXPH20 RPMM MM TD TD TD O TD BB BB BB BB<br />
FXSS01 VHHH HH HH BJ O BB BB BB BB<br />
FXSS02 VHHH HH HH BJ O BB BB BB BB<br />
FXSS03 VHHH HH HH BJ O BB BB BB BB<br />
FXSS20 VHHH HH HH BJ O TD TD BB BB BB BB<br />
Warning WDPN31 PGTW * TD TD TD TD TD BB BB BB BB<br />
WDPN32 PGTW * TD TD TD TD TD BB BB BB BB<br />
WHCI28 BCGZ HH HH BJ BJ BJ BB BB BB<br />
WHCI40 BABJ BJ O BJ BJ BJ BB BB BB<br />
WSPH RPMM * TD TD TD O TD BB BB BB BB<br />
WTMU40 VMMC BJ MC BJ BJ BB BB BB BB O<br />
WTPN21 PGTW * TD TD TD TD TD BB BB BB BB<br />
WTPN31 PGTW * TD TD TD TD TD BB BB BB BB<br />
WTPN32 PGTW * TD TD TD TD TD BB BB BB BB<br />
WTPH20 RPMM MM TD TD TD O BB BB BB<br />
WTPH21 RPMM TD O BB BB BB<br />
WTPQ20 VHHH HH HH BJ O TD BB BB BB BB<br />
WTSS20 VHHH HH HH BJ O BB BB BB BB<br />
WTTH20 VTBB BB TD O TD BB BB BB BB<br />
WTVS20 VNNN NN BJ O BB BB BB<br />
WTPQ20 RJTD O TD TD TD TD TD BB BB BB BB<br />
WTPQ21 RJTD O TD TD TD TD TD BB BB BB BB<br />
WTPQ22 RJTD O TD TD TD TD TD BB BB BB BB<br />
Continued to WTPQ23 RJTD O TD TD TD TD TD BB BB BB BB<br />
the next page WTPQ24 RJTD O TD TD TD TD TD BB BB BB BB<br />
1/7/11 2:24 PM<br />
Deleted: TCNA20<br />
1/7/11 2:24 PM<br />
Deleted: RJTD<br />
1/7/11 2:24 PM<br />
Deleted: O<br />
1/7/11 2:24 PM<br />
Deleted: TD<br />
1/7/11 2:24 PM<br />
Deleted: TD<br />
1/7/11 2:24 PM<br />
Deleted: TD<br />
1/7/11 2:24 PM<br />
Deleted: TD<br />
1/7/11 2:24 PM<br />
Deleted: TD<br />
1/7/11 2:24 PM<br />
Deleted: BB<br />
1/7/11 2:24 PM<br />
Deleted: BB<br />
1/7/11 2:24 PM<br />
Deleted: BB<br />
1/7/11 2:24 PM<br />
Deleted: BB<br />
1/7/11 2:24 PM<br />
Deleted: TCNA21<br />
1/7/11 2:24 PM<br />
Deleted: RJTD<br />
1/7/11 2:24 PM<br />
Deleted: O<br />
1/7/11 2:24 PM<br />
Deleted: TD<br />
1/7/11 2:24 PM<br />
Deleted: TD<br />
1/7/11 2:24 PM<br />
Deleted: TD<br />
1/7/11 2:24 PM<br />
Deleted: TD<br />
1/7/11 2:24 PM<br />
Deleted: TD<br />
1/7/11 2:24 PM<br />
Deleted: BB<br />
1/7/11 2:24 PM<br />
Deleted: BB<br />
1/7/11 2:24 PM<br />
Deleted: BB<br />
1/7/11 2:24 PM<br />
Deleted: BB<br />
29