第四節
第四節
第四節

You also want an ePaper? Increase the reach of your titles
YUMPU automatically turns print PDFs into web optimized ePapers that Google loves.
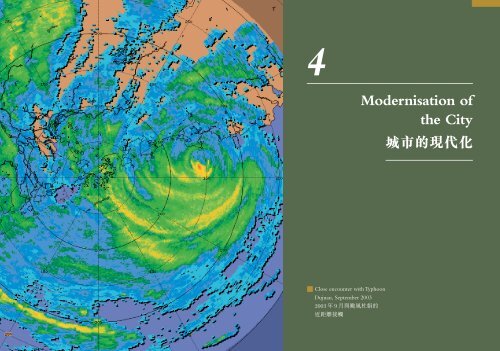
4<br />
Modernisation of<br />
the City<br />
9:#;
Post-war Regeneration<br />
During the Japanese occupation, the Observatory was reorganised into a<br />
!"#$<br />
!"#$%&'()*+,-./0)123456&'()789:;<br />
meteorological department. When Hong Kong was liberated, it was found<br />
@AB9 (Milne-Shaw horizontal seismograph) +"CDE&FGHIJK<br />
that some of the Observatory instruments had been removed by the Japanese,<br />
LMANOPIQ+RSTU&VWXY1R6&'()Z[\]^C_\]`<br />
including two sets of Milne-Shaw horizontal seismographs. Some out-stations,<br />
Cab& 146 cdef\]^Cg`CM/0hijk1 1946 l 5 m 1 "23n<br />
such as the terrestrial magnetic observation station at Au Tau, had been<br />
oXpqr'()&stQuuv)5w&xjQ;
In the 20 years immediately after the war, the work of the Observatory<br />
was concerned primarily with surface and upper air meteorological<br />
measurements. The major components of surface observation were the same<br />
as those before the war, and included measurements of air temperature,<br />
atmospheric pressure, humidity, wind strength, cloud amount, cloud height,<br />
visibility, sunshine duration and rainfall. The major breakthrough in the postwar<br />
era was to receive meteorological messages with the wireless<br />
communications equipment used during the war.<br />
R6M20l&'()Mt«¬A®/0¯°_±`/0¯°.²1A®<br />
¯°t«³´R›°µX&;
came into operation respectively and the staff there conducted meteorological<br />
observations once every half hour, thus enhancing aviation safety.<br />
The reports put out by the Observatory were not confined to local<br />
meteorological information; they also reported on the meteorological conditions<br />
in the Asia-Pacific region to facilitate movement of incoming and outgoing<br />
flights. The special status of the upper air meteorological observation section<br />
at the airport operating independently from the Observatory headquarters started<br />
to fade out with the official establishment of the Central Forecasting Office in<br />
1957, when the section was transferred back to the Observatory headquarters.<br />
Since then upper air observation work has been under the control of the<br />
headquarters. In addition to serving the aviation industry, the upper air<br />
meteorological data is also important in public weather forecasting.<br />
The rapid rise in population in the post-war years led to the development<br />
of an urbanisation strategy that differed greatly from the pre-war years. The<br />
first post-war population census carried out in 1951 gave a population figure<br />
of 2,010,000, an increase of 91% over the 1939 figure of 1,050,000. Ten years<br />
later, the figure increased by a further 56% to 3,130,000. The two decades in<br />
the 1950s and 1960s saw the highest population growth rates in the entire<br />
post-war period up to 2001.<br />
Table 4.1 Population Growth in Hong Kong (1939–2001)<br />
Fig. 4.4 An Observatory aviation forecaster<br />
briefing an Canadian Air Force crew on the weather<br />
conditions along the flight route (1965). Courtesy<br />
Hong Kong SAR Information Services Department<br />
4.4‘'()æ`his#JÆ`CKLö<br />
=æMM±`'/NO (1965l)123FG=<br />
nHnopIë—˜<br />
Modernisation of the City<br />
238<br />
Year Population (10 thousand) Rate of Population Growth<br />
1939 105 –<br />
1951 201 +91%<br />
1961 313 +56%<br />
1971 393 +26%<br />
1981 499 +27%<br />
1991 547 +10%<br />
2001 671 +23%<br />
Sources:<br />
Hong Kong Census and Statistics Department, Demographic Trends in Hong Kong 1971–82, Hong Kong<br />
Government Printer, 1983, p. 3.<br />
Hong Kong Census and Statistics Department, Hong Kong Annual Digest of Statistics, Hong Kong Government<br />
Printer, 1992, p. 11.<br />
Hong Kong Census and Statistics Department, Hong Kong Statistics 1947–67, Hong Kong Government Printer,<br />
1969, p. 15.<br />
Hong Kong Special Administrative Region Government, Hong Kong 2001, Hong Kong, Government Printer,<br />
2002.<br />
The rapid increases in population were due principally to the large numbers<br />
of immigrants. On one hand, these people represented the economic resources<br />
behind Hong Kong’s development. On the other hand, they imposed severe<br />
pressure on the city’s development in the areas of housing, transport, education<br />
°&PË´EQîïR@Aêæ-S_TU/0-SVW&X'Y«=Z…†<br />
2,000[¤ 5,000[_ 10,000[±`/0 &\ö=Ùs]^ú_$`9HI<br />
Û#a23AH/ÄMbc&1951lÆd_efÃHI&X6>$g\'/<br />
ihFù ; 1952 l 12 m 1 "_ 1953 l 1 m 1 "&ijkgþfÃHIdl€<br />
´&PXm>$
and medical services. The Observatory, in tune with the structural changes in<br />
society, also made directional adjustments to its services in the late 1950s and<br />
early 1960s. The Observatory shifted its emphasis from serving mainly<br />
government departments and various major institutions, to serving the livelihood<br />
of ordinary people. The expansion of the Observatory followed closely the pace<br />
of social development. The following description of the expansion of the<br />
Observatory’s organisation structure may be useful for reference purposes.<br />
% 4.1‘o3lÙÚÛþ 7 (1939–2001 l)<br />
&' ()*+,-. /01<br />
1939 105 –<br />
1951 201 +91%<br />
1961 313 +56%<br />
1971 393 +26%<br />
1981 499 +27%<br />
1991 547 +10%<br />
2001 671 +23%<br />
Reorganisation of Structure<br />
For the first 20 years after the war, the work of the Observatory remained<br />
more or less the same as that before the war, as evidenced by the unchanged<br />
organisation structure up to 1964. During this period, the main tasks were<br />
surface meteorological observation, marine weather services, geomagnetic<br />
measurements, typhoon warning services, etc. A lithographic press section<br />
was set up in 1947 to facilitate the publication of research reports, indicating<br />
that research and publication activities were gaining importance after the war.<br />
In 1957, the Central Forecasting Office was established at the headquarters to<br />
co-ordinate meteorological observations of all out-stations, including the Kai<br />
Tak Meteorological Office.<br />
îï.¡ :<br />
Hong Kong Census and Statistics Department, Demographic Trends in Hong Kong 1971–82, Hong Kong<br />
Government Printer, 1983, p. 3.<br />
Hong Kong Census and Statistics Department, Hong Kong Statistics 1947–67, Hong Kong Government Printer,<br />
1969, p. 15.<br />
Hong Kong Census and Statistics Department, Hong Kong Annual Digest of Statistics, Hong Kong Government<br />
Printer, 1992, p. 11.<br />
Hong Kong Special Administrative Region Government, Hong Kong 2001, Hong Kong, Government Printer,<br />
2002.<br />
¢ŸÛþMÙÚˆê.²&£¤F{®Ê23äåMÜÝî¡&„¥F<br />
{®&¦aŽ M§¨¤‰Ð¤©ª_«¬ÃMäåe®ÆM¸¼1'()M<br />
OPQ56¯°±²M,c&! 1950 lÖפ 1960 lÖ³«8{´Mˆ<br />
µ·²1.no7¸_¹Ætº‚g\OP»„¼ˆ°±ê½OP&'(<br />
)¾¿MÀZÁ’°±äåMÂÃ&Ä…†'()-S²ÀZxOò/«]<br />
^“´1<br />
Modernisation of the City<br />
240<br />
From 1965 onwards, the Observatory’s structure underwent bigger changes<br />
to embrace modern sciences and new technologies. New divisions developed<br />
included the Geophysics Division (1965), the Training Division (1966), the<br />
Computer Division (1973), the Air Pollution Meteorology Research Units (1980)<br />
and the Physical Oceanography Division (1988). Such expansion was necessary<br />
for the Observatory to constantly keep up with the pace of new requirements.<br />
In 1993, the Observatory was restructured into four branches: the Forecasting<br />
and Warning Services Branch; the Development, Research and Administration<br />
Branch; the Radiation Monitoring and Assessment Branch; and the Aviation<br />
Meteorological Services Branch. The Forecasting and Warning Services Branch<br />
comprised three divisions: Central Forecasting Office Operations; Radar, Satellite<br />
and Instruments; and Special Meteorological Services and Telecommunication.<br />
The Development, Research and Administration Branch consisted of three<br />
divisions: Development, Research and Administration. The Radiation<br />
Monitoring and Assessment Branch was made up of three divisions: Operation<br />
and System Development; Training and Emergency Preparedness; and Assessment<br />
and Observational Network. The Aviation Meteorological Services Branch was<br />
made up of the Airport Meteorological Office (Kai Tak) and the Airport<br />
Meteorological Office (Chek Lap Kok).<br />
23#4<br />
R6MÅ20l'()Mt«gR›ÆñdÆ&)·R61964l%À&'()<br />
M-S²sc&¬³´ÇC/ÈÉ1)Ê%À²1M7¸;
William Doberck<br />
í î (1883–1907)<br />
Frederick George Figg<br />
ïð (1907–1912)<br />
Thomas Folks Claxton<br />
ñòóô (1912–1932)<br />
Charles William Jeffries<br />
õö÷ó (1932–1941)<br />
Benjamin Davies Evans<br />
ø½ó (1941–1945)<br />
Graham Scudamore<br />
Percival Heywood<br />
ùà (1946–1956)<br />
Ian Edward Mein Watts<br />
úFó (1956–1965)<br />
Gordon John Bell<br />
û@ü (1965–1981)<br />
John Edgar Peacock<br />
ýþ (1981–1983)<br />
Fig. 4.6 Group photograph of Hong Kong<br />
Observatory staff in 1960. Courtesy Hong Kong<br />
Observatory<br />
4.6 1960l23'()wsœ 123'<br />
()—˜<br />
×1'/h°_ÎhOP×)8.'/h°~7¤;÷*+_9:¤FG/0O<br />
P_ÏÑ7úèå¤ÑÒ_nP×8.OPèå¤ÑÒ_=n*7,úé꯰<br />
_ëì×!8.=á_-ìäå¤ÜÝ_ÁV./01¤ëì_Ë°23*7<br />
Modernisation of the City<br />
242<br />
Sham Pak, Patrick<br />
ÿ! (1984–1995)<br />
Lau Chi-kwan, Robert<br />
Ÿª" (1995–1996)<br />
Lam Hung-kwan<br />
#$% (1996–2003)<br />
Fig. 4.5 Directors of Hong Kong Observatory<br />
from past to present. Courtesy Hong Kong<br />
Observatory and Hong Kong SAR Information<br />
Services Department<br />
4.5‘'('()þ123'()—˜_23<br />
FG=nHnopIë—˜<br />
8ú„æ`/0OP×8.€ ‚ƒ/07_e45‚ƒ/071<br />
2001l'()6ùX-&X-6-SÆñg1993lMødÆ&¬çœ<br />
×.²71FGg\p×ÙM7-QdlÛ#&;
Fig. 4.7 Group photograph of Hong Kong Observatory in 2003. Courtesy Hong Kong Observatory 4.7‘2003 l23'()o7wsœ 123'()—˜
In 2001, another reorganisation of the Observatory took place. The<br />
organisation structure after the exercise was similar to the one in 1993, with<br />
four branches as the backbone. Sections dealing with new technologies were<br />
added, including: the Forecast Development and System Development units<br />
under the Forecasting and Warning Services Branch; the E-Government,<br />
Geophysics, Time and Port Meteorological Services unit, and the Long Range<br />
Forecasting and Hydrometeorology unit, under the Development, Research<br />
and Administration Branch. The expansion of the Aviation Meteorological<br />
Service Branch was most significant: new additions included the Windshear<br />
and Turbulence Detection unit, the Aerodrome Meteorological<br />
Instrumentation unit, and the Weather Radar and Satellites unit. The aviation<br />
meteorological services place emphasis on aviation safety, and every effort is<br />
made to meet the increasing demands of the thriving air transport industry.<br />
This structure has remained largely unchanged to 2003.<br />
5678<br />
Allocation of Resources<br />
The functions of the Observatory and its relationship with the social<br />
development of Hong Kong can be observed from the growth in expenditure<br />
and staff numbers, and the expansion of its organisation. 150 When the<br />
Observatory was first established in 1883, its annual expenditure was only<br />
HK$2,740. In 1940, one year before the fall of Hong Kong, that amount had<br />
increased to HK$136,261, a 49.7-fold increase. This was fairly in line with<br />
the 48.3-fold growth in Hong Kong government expenditure for the same<br />
period.<br />
Modernisation of the City<br />
246<br />
Between 1883 and 1940, the expenditure of the Observatory was<br />
generally on an upward trend. In descending order, the years that saw the<br />
highest expenditure increases were: 1884 (98.2%), 1890 (92.7%), 1930<br />
(54%), 1931 (37%) and 1903 (36.6%). Within this period, there were years<br />
that registered expenditure reductions. The years with the highest reduction<br />
were: 1918 (-25.5%), 1891 (-22.1%), 1927 (-18.8%), 1924 (-14.9%) and<br />
1898 (-12.6%). Of the period in question, there were 24 years that recorded<br />
reductions and 33 years that registered increases. The 98.2% increase in 1884<br />
was the highest on record. This was merely a reflection of an incomplete<br />
establishment at the very beginning of operation of the Observatory in 1883.<br />
As the establishment finally took shape, expenditure rose dramatically in 1884.<br />
As such, the rise in the second year was not representative of the true expansion<br />
and development of the organisation. From the expenditure’s upward trend,<br />
'()MK¾g23°±äåM†L&/MN…†On.8MÛþ¤stÙç<br />
MÛ#_-SÀã‘¿PQ1 150 '()|1883lY)LFlMol~.8R<br />
… 2,740 3S&! 1940 l&T23UV›FlWÛ 136,261 S&Ûþ±÷<br />
48.7 X&g_%o3On~.8MÛY 47.3 XdÆ1<br />
1883 1940 lÀ&'()On.8M 7&Æ7Fë|F"Z[&.8Å<br />
ÆÛYMl,… 1884 l (98.2%)¤ 1890 l (92.7%)¤ 1930 l (54%)¤ 1931 l<br />
(37%) _ 1903 l (36.6%)1„xjolÜý.8Q…E\zM&\YÅÆMl,<br />
… 1918 l (-25.5%)¤ 1891 l (-22.1%)¤ 1927 l (-18.8%)¤ 1924 l (-14.9%)<br />
_ 1898 l (-12.6%)1gFldý„ë|\YMl,… 24 l&s_ë|ÛYM<br />
33l]11884l (98.2%) MÛY/ Ê'lÅ]ÛYMl,&^_`:³%¬a<br />
…bcdC&!ùlƒ}`).8ÜýƵg±&5e1884l.8MÛY0€P<br />
s¾ÖÐ-SMäåÀZ1·.8F"MZ[&/fg 1930 á 1931 lM•¯Û<br />
Y&ÖЯ‚!1930lÖ³MžŸÛþ1¥F{®&FGl,J1891l22.1%<br />
M\Y&Êå|1890lM92.7%Ûþ6M²´ˆµ&a¾ ”‚h\ÜýM<br />
²1$Ê1 1918 l.8ÄÁ 25.5% ¤ 1924 lM 14.9% _ 1927 lM 18.8% &ƒ<br />
i ^_f'()…h\Ï.MxO1Æ7. &'()MOn.8jo3On~<br />
.8Mklz| 0.3% 1<br />
R6'()Mäå&kØR›p…N“„Ís_1µ7. &OnM.8_<br />
wsMçµÆ7,$ÀÊë|F"MZM&R…çl&T 1958–59l (-10.6%)¤<br />
1966–67 l (-1.8%)¤ 1967–68 l (-9.7%) _ 2000–01 l (-1.3%)&Üýg›F<br />
ldý…\zm0&xn$ÀOn.8oë|F"Z[&ÅÆM"YR6˜Fl<br />
1946–47 lÅ.•¯&±÷ 870% &eH 1947–48 l (81.3%)¤ 1948–49 l<br />
(46.1%)¤ 1957–58 l (44.7%)_ 1979–80 l (40%).ÅÇ81 1945–46 l&R<br />
6MLFl&'()Mt«¬a op&On.8R…11,339S&.1946–47<br />
lM10.3%&5eÄMíq1946–47l.ëìR6'()On.8ÛþMØ<br />
&ÊlM.8.109,987Sú„2001–02lM.8.221,296,000S&%Àô<br />
Û#f 2,011 X&go3On~.8M 2,343 XÛþký&r.st1uË<br />
1946–472001–02l56lÀ&'()On.8Ml@oÛþÿ.15.7%&g<br />
o3On~.8l@oÛþÿ15.9%dÆ&/¿R6'()Mä徿g23µ<br />
7äå_Â1FGÜýh\Ml,&/f«Ê²´ˆµ&J!1958–59lM<br />
\Y&Ê561957–58lM44.7%ÛYMˆµ&a¾i ÖÐî¡pvM\z1<br />
kýwQ†xMÊ1967–68lyá6z\9.7%M.8&²1{gµ7n#/|<br />
}~&Êlo3On.8gFFldýQ… 2.2% M\Y1<br />
!<br />
"<br />
#<br />
$<br />
%<br />
&<br />
247
one can see that the spectacular rises in 1930 and 1931 marked the rapid<br />
development in the 1930s. On the other hand, the 22.1% reduction in<br />
expenditure in 1891 was due to the structural adjustments to the previous<br />
year’s dramatic increase of 92.7%, and was not suggestive of the year being<br />
part of the period of major expenditure reduction. The reduction of expenditure<br />
in 1918 (-25.5%), 1924 (-14.9%) and 1927 (-18.8%), however, truly reflected<br />
the expenditure cuts suffered by the Observatory. On the whole, the<br />
Observatory accounted for less than 0.3% of Hong Kong’s total public spending<br />
in a given fiscal year — a very small fraction indeed.<br />
'()MÜý.8Õ1883le:.&Rjo3On.8M0.3%Äk<br />
l/€d0>& ‚dƒ„"a ê"…½à}~XÆM'/îÑ&E†Mý´<br />
Ê)‡ˆ>ú·ÜÝ5º.f&'()MOPÜÝŒ‰d0±&[|‚On.<br />
8jo3lo~On.8Mkld0>&ŠxÜýMÛ\ÂÃ&2a3gnoµ<br />
7MOn.8d_1<br />
·‚MÙsdC.f&xÛþMxO‹s_ÜÝî¡M”•1 151 GR<br />
›²1Mst (s;
derived from the Observatory’s services are very great. As it represents only a<br />
very small proportion of the total public spending, the rate of increase or<br />
decrease in its funding did not always follow that of the overall government<br />
spending pattern.<br />
% 4.2 23'()aHOPìí (1957–2002 l)<br />
&' =>*+ &@A=>B+ @C (DE)<br />
1957–1960 369 16 1,686<br />
1961–1965 578 55 2,700<br />
1966–1970 608 100 5,600<br />
Looking at staffing levels, the increase in staff numbers was not as<br />
conspicuous as the growth in economic resources. 151 Before the war<br />
commenced, there were only 24 principal officers (excluding low-ranking<br />
staff). This represented just an increase of 100% over the 1884 figure of 12.<br />
The increase was far below the increases in expenditure over the same period.<br />
1971–1975 664 194 18,739<br />
1976–1980 682 179 28,470<br />
1981–1985 2,205 710 209,341<br />
1986–1990 2,660 752 245,647<br />
1991–1995 4,040 962 925,547<br />
1996–2000 4,752 1,138 1,505,226<br />
The growth of staffing levels was higher in the post-war years. From a<br />
figure of 24 in 1947, the staff numbers increased to 217 in 1980 — a nine-fold<br />
increase. Although the increase in percentage was rather insignificant relative<br />
to the growth in public spending, the staff size nevertheless had become much<br />
bigger than before the war. The procurements of advanced meteorological<br />
instruments and the introduction of modern operational procedures that<br />
characterised the expansion of the Observatory’s services probably explains<br />
why the growth in manpower was not comparable with the rate of increase in<br />
expenditure.<br />
2001–2002 1,718 316 441,971<br />
~í 18,276 4,422 3,384,927<br />
îï.¡½<br />
23'()Ž7îï1<br />
FGHI<br />
›¾T³¦´¿ÀMîï&aÁê_æ^ÙóÅ.…´1'()e:›&…†<br />
¦´¿ÀMÂÃiy&²1ÄÅÙ'Æg\1iÇÉFÈîï…-ìAh°¦´<br />
¿ÀMiy/ÉÊ›¾T³×%&ËÌMæ^'(ÍÎ'Ï (Nautical Almanac<br />
Office in London) ÉÐÑÒÎåAE9M¦´Õá°µíQMîï&h°<br />
a.FÓu3X"¦Å±_ÅŒ±º& 153 P}o3ű_ÅŒ¦´¿ÀMAH<br />
ÔÕ\]^&\ŒÖ×Ø3_Áê8^ÙÚM»Û1<br />
Urban Construction<br />
Modernisation of the City<br />
250<br />
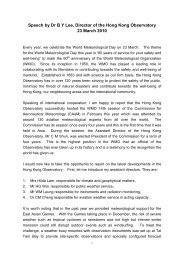
Meteorological data had a decisive influence on Hong Kong’s urban<br />
construction. With the rapid rise in population after the war, the primary<br />
concern in Hong Kong’s urban development was to exploit usable land<br />
resources effectively. For Hong Kong, a city desperately short of land resources,<br />
it was no easy task to level an area of land and reclaim part of the sea to build<br />
skyscrapers. Examples of construction projects that needed meteorological data<br />
include the consideration of the effects of storm surges to optimise the depth<br />
of sea to be reclaimed and the materials to be used, both of which were closely<br />
related to the construction costs; and the estimation of possible maximum wind<br />
speeds in building skyscrapers so that they can withstand the passage of typhoons<br />
in summer. Thus, vital meteorological data such as the directions and strength<br />
of typhoons passing through Hong Kong over the years, the impact on the coast<br />
of rising sea levels caused by storm surges and the rainfall distribution were all<br />
indispensable for the construction of the city. The records made by the<br />
Observatory on wind directions, speeds and strength on the passage of each<br />
typhoon, and the regular reports issued on rainfall distribution and tides, became<br />
23Ë´Ï:ÙÚ°µ¦´¿ÀMxO&ÅÜ/¿|1940lÖ&@^Ì×<br />
ØØÝ!3EÌ´MÏ:¦´³911951l1m23Åù!C:ÞåAnßÕ<br />
ᦴ°µí&1952l10mˆàgá5&66+~âãÚä&´Ë妿<br />
ÀM¾æ_@oµ²1Õᦴ°µía23^t¡Mäå… ÆMç<br />
è&}~ý¢‹M^t¡…1950l3kéHM^t¡¤1970lÖêë3M<br />
^t¡_Ñì jkM^t¡Ã1 1983 l23'()]^#JÆ^Ì×Ø<br />
Øݦ´M8í{î
important reference materials for infrastructure projects and the construction<br />
sector. These data sources have become a prerequisite to the massive scale of<br />
infrastructural development undertaken since the end of the 1960s. 152<br />
Table 4.2 contains statistics on the various meteorological data services<br />
provided by the Observatory. Some of the services required the payment of<br />
fees. Judging from the increasing incomes that were matched by rising number<br />
of enquiries, it shows that such data have a certain practical value.<br />
Table 4.2 Statistics on External Services Rendered by the Observatory (1957–2002)<br />
Year Total Number of Enquiries Number of Charged Enquiries Revenue (HK$)<br />
1957–1960 369 16 1,686<br />
1961–1965 578 55 2,700<br />
1966–1970 608 100 5,600<br />
1971–1975 664 194 18,739<br />
1976–1980 682 179 28,470<br />
1981–1985 2,205 710 209,341<br />
1986–1990 2,660 752 245,647<br />
1991–1995 4,040 962 925,547<br />
1996–2000 4,752 1,138 1,505,226<br />
2001–2002 1,718 316 441,971<br />
Total 18,276 4,422 3,384,927<br />
Fig. 4.8 Tsim Bei Tsui Tide Station (2000).<br />
Courtesy Hong Kong Observatory<br />
4.8‘Ðøù¦´Ë°I (2000l)123'<br />
()—˜<br />
Source:<br />
Internal records of the Hong Kong Observatory.<br />
Tidal Predictions<br />
Modernisation of the City<br />
252<br />
In the nineteenth century, data on the ebb and flow of tides were essential to<br />
fishermen and seafarers. Before the establishment of the Observatory, reports<br />
on tides were provided sporadically, mainly by private companies. Systematic<br />
reporting in newspapers of tidal predictions can be traced back to the late<br />
nineteenth century. The Nautical Almanac Office in London, making use of<br />
the tidal data collected by the automated instruments installed at the Marine<br />
Police base in Tsim Sha Tsui, provided forecasts of Hong Kong’s daily<br />
maximum and minimum tidal heights for the coming week. 153 It also listed<br />
the areas in Hong Kong with the highest and lowest tides, so as to reduce the<br />
risks faced by ships mooring and fishermen going out to sea.<br />
The earliest use of electronic technology to measure the ebb and flow of<br />
tides was in the 1940s when the British Oceanic Institute installed electronic<br />
tide recorders to measure the tides. In January 1951, Hong Kong set up its<br />
own automatic tide gauges at the Arsenal base for the first time. In October<br />
Fig. 4.9 Waglan Island Tide Station (1993).<br />
Courtesy Hong Kong Observatory<br />
4.9‘ijk¦´Ë°I (1993l)123'<br />
()—˜<br />
!<br />
"<br />
#<br />
$<br />
%<br />
&<br />
253
1952, the instrument was moved to North Point and later to Quarry Bay.<br />
The purpose was to observe the pattern of tidal flows and the structure of the<br />
mean vector. These automatic tide gauges were a great help to land reclamation<br />
projects. Examples include the Eastern District reclamation project on Hong<br />
Kong Island in 1950, and the reclamation works carried out at Tolo Harbour<br />
and Sha Tin New Town in 1970s. In 1983, the Observatory conducted research<br />
on tides, based on the analytical methodology developed by the Canadian<br />
Marine Institute. By 1987, Hong Kong officially employed computer<br />
programmes to predict the distribution of tides.<br />
The Observatory periodically disseminates the tidal data collected from<br />
selected locations along the coast as reference materials to relevant departments<br />
and private companies. Information provided includes the daily highest- and<br />
lowest-tide readings, the daily tide times at selected locations, storm surge<br />
conditions during the typhoon season and the mean sea levels. With<br />
observations carried out at regular intervals over a long period, the Observatory<br />
makes use of the storm surge data accumulated to make predictions on the<br />
‘super’ storm surge that happens once every 50 years. This is important<br />
information for reclamation and construction projects.<br />
'()E9M¦´Ë°I&Õ1950lÖ.&oBœ¯Ž äåM£1&<br />
.^t¡g\¦´¿À_»y¦Mîï&úqpYeM—AûœnoVW_÷<br />
gűÜÝŒ‰11950lÖ¦´Ë°I²18¯|3kéH&Já5¤ãÚä&<br />
_pUÆüý1 154 1975l&’¯Ñì jk¤þÿ!_"#Mäå&pM¦´<br />
Ë°I,9|ÑìjkH¤þÿ!_±>$1|ËåÍ»òÕ»y¦_ű^<br />
@®M¦´Ë°&!9!o3M%³AHJijk¤&'¤þf¤"#¤(¸<br />
_ÐøùÃ1Õ1986lØ&o3M¦´ËåI…9œ&;$¤Æüý¤Ðøù¤*n¢¤Æd¤+,$_ijk1[|ÏÞÙ<br />
ÚMä÷&^-±º_^®xO/Ë´.ìM»Ÿ¤»H¤^-±ºÃþ%.<br />
M³_d/M†L.h°&Š¦´Ë°Ws301A9!XäåMH21<br />
2003l¦´°µI²19!FGX1MAð “&6œ°µ¦´MX8G |<br />
ãÚä¤Æüý¤Æ3$¤ijk¤Ðøù_451<br />
Modernisation of the City<br />
254<br />
Tide stations have been established since the 1950s to cater for the<br />
development needs of the city. They provide tidal and storm surge data for land<br />
reclamation works, ensuring that reclaimed land complies with safety standards<br />
while attaining maximum economic efficiency. In the 1950s the tide stations<br />
were situated mainly on the eastern side of Hong Kong Island, such as at North<br />
Point and Quarry Bay, and also at Tai Po Kau in the New Territories. 154 In<br />
1975, following the development of the Sha Tin New Town, Ma On Shan and<br />
Sai Kung, new tide stations were established in Sha Tin, Ma On Shan and Ko<br />
Lau Wan. To observe the storm surges associated with typhoons and making<br />
measurements at the highest sea level point, stations were set up at locations<br />
close to the coastline such as Waglan Island, Mui Wo, Cheung Chau, Sai Kung,<br />
Tuen Mun and Yuen Long. From 1986 onwards, there were a total of nine tide<br />
stations and they were situated at the Royal Navy base at Tamar, Quarry Bay,<br />
Ko Lau Wan, Tai Po, Tsim Bei Tsui, Lok On Pai, Tai O, Chi Ma Wan and<br />
Waglan Island. Due to advances in computer technology, it is now possible to<br />
make use of the records on wind speed, wind region, strength and wave heights,<br />
and the interrelationship between these elements, to predict wave heights and<br />
sea conditions. To carry out tidal measurements, it is no longer necessary to<br />
have tide stations located at all principal development districts. As at 2003, the<br />
six principal tidal observation locations are: Quarry Bay, Tai Po Kau, Joss House<br />
Bay, Waglan Island, Tsim Bei Tsui and Shek Pik.<br />
— »AQM¦´¿Àçé Observed tide level<br />
— ö»y¦$¦´¿Àh° Theoretical tide level without storm surge<br />
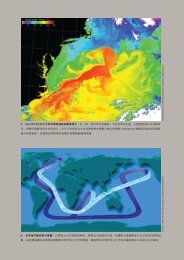
Fig. 4.10 On 6 July 2001, during the passage<br />
of Typhoon Utor, storm surges appeared in Lau<br />
Fau Shan and Tai O area. At 10 AM, the tide<br />
reached a level of about 3.6 metres. Courtesy Hong<br />
Kong Observatory<br />
4.10‘2001 l 7 m 6 "Í»6Fª3&><br />
7!_ÆdF88m»y¦ &7m6"F910<br />
$¦¿: 3.6 ;123'()—˜<br />
!<br />
"<br />
#<br />
$<br />
%<br />
&<br />
255
Hydrometeorology<br />
JKLM<br />
Hydrometeorological observations have a decisive role in the conservation and<br />
allocation of water resources. Hydrometeorology is mainly concerned with the<br />
analysis of the different states of water — water vapour, liquid water and ice —<br />
that enter the atmosphere from the oceans, the land, animals and plants through<br />
evaporation and transpiration, and eventually return to the earth’s surface through<br />
a series of processes. Since the end of the twentieth century, the most important<br />
contribution made by local hydrometeorological research has been to ensure<br />
the safety of people in their daily lives. As 60% of Hong Kong is made up of<br />
hilly terrain, loose materials on the slopes due to wind erosion will, after severe<br />
rainstorms, subside rapidly as loose rubble and soil, and can cause the collapse of<br />
large areas of surface rock. 155 The risk is particularly high during storms in the<br />
colluvium belt of hilly areas where granite rocks come into contact with volcanic<br />
rocks. 156 Thus, rainfall distribution, rain forecasts and warnings, are all indispensable<br />
in landslide prevention.<br />
Apart from being closely related to the prevention of landslides, rainfall<br />
data are also linked to the allocation of fresh water resources. Since 1862,<br />
when the Hong Kong government planned to build reservoirs to store rainwater<br />
as the principal source of drinking water for Hong Kong people, calculations<br />
were carried out after the wet season (May to October) to work out the<br />
annual rainfall, the reservoir storage levels, water from subterranean sources<br />
and the flow rates from streams so as to plan a timetable of fresh water supply<br />
for the following year. In years when abnormally low rainfall was registered,<br />
the government would implement water restriction measures from November<br />
to April the following year. This was to ensure that Hong Kong’s drinking<br />
water storage would be adequate to meet the basic needs of its people before<br />
the arrival of the rainy season. 157<br />
(/0Ë°aî¡MqM˜˜@¤A_B˜˜Õ^̤CA_áD%MNEä_E<br />
F
Observatory co-operated with the Waterworks Office of the Public Works<br />
Department (now the Water Supplies Department) to collect rainfall data in<br />
major reservoirs. They were Tai Tam, Tai Tam Tuk, Pokfulam, Aberdeen,<br />
Wong Nei Chung, Shek Lei Pui, Kowloon and Shing Mun reservoirs (see<br />
Table 4.3 for statistics on rainfall stations).<br />
Table 4.3 Statistics on Rainfall Stations — Hong Kong Observatory (1906–1939)<br />
Year Number of Locations<br />
Rainfall Stations<br />
1906–1909 1 Tai Po Police Station<br />
1910–1913 2 Tai Po Police Station, Botanical Garden<br />
1914–1928 3 Tai Po Police Station, Botanical Garden, Matilda Hospital<br />
1929 4 Tai Po Police Station, Botanical Garden, Matilda Hospital, The<br />
Royal Hong Kong Golf Club (Fanling)<br />
1930 5 Tai Po Police Station, Botanical Garden, Matilda Hospital, The<br />
Royal Hong Kong Golf Club (Fanling), Naval Hospital<br />
1931–1936 4 Tai Po Police Station, Botanical Garden, Matilda Hospital, The<br />
Royal Hong Kong Golf Club (Fanling)<br />
1937 8 Tai Po Police Station, Botanical Garden, Matilda Hospital, The<br />
Royal Hong Kong Golf Club (Fanling), Cheung Chau Police<br />
Station, Sai Kung Police Station, Lok Ma Chau Police Station,<br />
Ping Shan Police Station<br />
1938–1939 20 Tai Po Police Station, Botanical Garden, Matilda Hospital, The<br />
Royal Hong Kong Golf Club (Fanling), Cheung Chau Police<br />
Station, Sai Kung Police Station, Lok Ma Chau Police Station,<br />
Ping Shan Police Station, Victoria Peak, Pokfulam, Aberdeen,<br />
Wong Nei Chung, Tai Tam, Tai Tam Tuk, Kowloon Reservoir,<br />
Shek Lei Bui, Shing Mun No. 1, Shing Mun No. 2, Shing Mun<br />
No. 3, Yuen Long<br />
Fig. 4.12 Precipitation alarm (1972). Courtesy<br />
Hong Kong SAR Information Services Department<br />
4.12‘ÄÂÎi: (1972 l)123FG=<br />
nHnopIë—˜<br />
(Remark: The rainfall stations did not include the Observatory headquarters)<br />
Sources:<br />
Hong Kong Observatory, Meteorological Observations Made at the Hong Kong Observatory in the Year 1908, Hong<br />
Kong, Noronha & Co., 1909.<br />
Hong Kong Observatory, ‘Report of the Director of the Hong Kong Observatory’, Hong Kong Government,<br />
1907–1940.<br />
Hong Kong Observatory website, <br />
Modernisation of the City<br />
258<br />
With the increased number of rainfall stations and a wider area of coverage,<br />
the frequency of data transmissions to the Observatory headquarters also went<br />
up. In addition to better understanding the weather conditions in the different<br />
districts, it was also helpful in forecasting the occurrence of severe rainstorms.<br />
After the war, the network of the rainfall stations reached Sai Kung to the<br />
east, Tai Tam to the south, Ping Shan to the west and Lok Ma Chau to the<br />
north. The locations for collection of rainfall data concentrated on the fisheries<br />
and agricultural regions so as to provide the farmers with more information<br />
on farmland irrigation and flooding. In addition, in the 1950s and 60s, the<br />
authorities had also built many rainfall out-stations in the vicinity of the planned<br />
Fig. 4.13 Automatic rain gauge (1972). Courtesy<br />
Hong Kong SAR Information Services Department<br />
4.13‘Õájµ: (1972l)123FG<br />
=nHnopIë—˜<br />
!<br />
"<br />
#<br />
$<br />
%<br />
&<br />
259
eservoir sites. In 1952, there were 50 rainfall out-stations in Hong Kong. By<br />
1969, the number had increased to 122, with a total of 154 rain gauges — the<br />
year with the highest number of rain gauges on record. In 2001, 65 rainfall<br />
stations were in operation. Forty-six of these stations were manned and the<br />
remaining ones were automatic stations. In 2003, the number of rainfall stations<br />
has already reached 90. Some of these stations are operated by voluntary<br />
associations, religious groups and schools. They regularly send rainfall records<br />
to the Observatory for analysis. The dense network of rainfall stations copes<br />
well in monitoring the rather uneven distribution of rainfall in Hong Kong.<br />
Their data also help to improve the exploitation of the city’s water resources.<br />
·iÇFfg½1840 lÖM/0ih&aÁÂM³€X ÈÁÂMx<br />
O¤$ÀMþ‚&¦J…ÁµMìíçƒú1850lÖ/Â+A„gÁµMì<br />
íçƒ1 1906 l'()|ÆüÎ…9:˜FœÂµHI&ämxEQMçƒ<br />
gÐÑÒ'()³d–20%½ 158 1910l6µHIƒC‹Û#&E9MA<br />
]pUÎ…_ª†-S_‡7.²1 1930 lÖÙÚMÛþEˆeM\¸<br />
¼&ÌnoV£o®r‰¹ÆaMÁÂxO11938l'()gP…œ«&b<br />
c23¹ÆaJÆs¤ÆsŠ¤‹Œ#¤23 ¤ŽRä¤4 ¤¾‘¤Ž<br />
¸ÃMÁ³ (…† 1906 1939 lo3µÂIMìí&”]’{Ð 4.3)1<br />
% 4.3 23'()µÓcA“” (1906–1939 l)<br />
Modernisation of the City<br />
260<br />
Table 4.4 Rain Gauges and Rainfall Stations — Hong Kong Observatory (1952–2003)<br />
Year Number of Rain Gauges Number of Rainfall Stations<br />
1952–53 50 –<br />
1959–60 92 –<br />
1969–70 154 122<br />
1979–80 130 98<br />
2003 108 90<br />
Sources:<br />
Hong Kong Annual Departmental Report by the Director, Royal Observatory, for the financial years 1952–53,<br />
1959–60, 1969–70, 1979–80, Hong Kong, Government Printer.<br />
Internal records of the Hong Kong Observatory.<br />
Methods of rainfall measurement include the use of measuring cylinders<br />
to directly find out the amount of rainfall collected, and the use autographic<br />
rain gauges such as the tilting-siphon and the tipping-bucket rain gauges. In<br />
the late 1970s, the technology for real-time transmission of rainfall data to the<br />
Observatory headquarters became available. Today, in addition to real-time<br />
rainfall data from its own network, the Observatory can also access real-time<br />
rainfall data from a network of automatic rain gauges operated by the<br />
Geotechnical Engineering Office through computer links.<br />
The rainfall data were disseminated via weather bulletins released by the<br />
Observatory. After collation, the data were used to produce regional rainfall<br />
distribution charts and published in the Monthly Weather Summary. Records of<br />
rainfall stations, in particular the annual rainfall data, were published in the<br />
Summary of the Hong Kong Meteorological Observations, Surface Observations in<br />
Hong Kong, Meteorological Results Part I and Hong Kong Rainfall and Runoff.<br />
Besides, an independent research report is prepared for each severe rainstorm<br />
to find out the relationship between rainstorms and the weather systems.<br />
&' NOP+Q RS<br />
1906–1909 1 ÆüÎ…<br />
1910–1913 2 ÆüÎ…¤23D%'•<br />
1914–1928 3 ÆüÎ…¤23D%'•¤” «Ý<br />
1929 4 ÆüÎ…¤23D%'•¤” «Ý¤–—23\]±˜Û±<br />
1930 5 ÆüÎ…¤23D%'•¤” «Ý¤–—23\]±˜Û<br />
±¤^C«Ý<br />
1931–1936 4 ÆüÎ…¤23D%'•¤” «Ý¤–—23\]±˜Û±<br />
1937 8 ÆüÎ…¤23D%'•¤” «Ý¤–—23\]±˜Û<br />
±¤þfÎ…¤"#Î…¤õþfÎ…¤t!Î…<br />
1938–1939 20 ÆüÎ…¤23D%'•¤” «Ý¤–—23\]±˜Û<br />
±¤þfÎ…¤"#Î…¤õþfÎ…¤t!Î…¤š›!¤‹<br />
Œ#¤23 ¤ŽRä¤Æs¤ÆsŠ¤¾‘a¤4 ¤Ž<br />
¸ 1 œ¤Ž¸ 2 œ¤Ž¸ 3 œ¤S<br />
(ž : FµÂIPs;
In 1997, the Observatory developed a ‘nowcasting’ system and a rainstorm<br />
warning system SWIRLS (Short-range Warning of Intense Rainstorms in<br />
Localised Systems). In essence, SWIRLS makes use of the data captured by<br />
the Doppler weather radar within a 256-km radius of Hong Kong, satellite<br />
cloud images, local surface rainfall data as well as parameters of atmospheric<br />
stability to predict the movement and development of rain areas for the next<br />
three hours. 159 After considering the short-term objective rainstorm forecasts,<br />
rainstorm warning signals will be issued as and when necessary. The new<br />
system reduces the chance of false alarms, thereby raising the awareness of the<br />
public to mitigate unnecessary casualties caused by landslides and flooding.<br />
The new system also addresses the needs of economic activities in Hong Kong<br />
by minimising disruptions due to false alarms.<br />
The Observatory was not only tasked to perform detailed analysis and<br />
forecasts of rainy weather, it was also occasionally invited to play rainmaker<br />
during dry spells. In 1954 and 1955, the Observatory performed detailed research<br />
into man-made rain, such as dry ice seeding, silver iodide seeding and water<br />
MµI… 90 œ1FGª†‡7¤Å©‡7¤ØÆuu#µbct«M=<br />
Õ&}jgMµìí¥‰'()8í1Áµ¯°/€ÆÆÇÈf23µ<br />
8¯®soÉ)Z'M±V&Pµsâ,ÊŽ î¡M· 1(…† 1952 <br />
2003 lo3µÂIM~ç”]’{Ð 4.4)1<br />
% 4.4 23'()µÂË_µÂI~ç (1952–2003 l)<br />
&' NOT+Q NOP+Q<br />
1952–53 50 –<br />
1959–60 92 –<br />
1969–70 154 122<br />
1979–80 130 98<br />
2003 108 90<br />
îï.¡½<br />
Hong Kong Observatory, Hong Kong Annual Departmental Report by the Director, Royal Observatory, for the Financial<br />
Years 1952–53, 1959–60, 1969–1970, 1979–1980, Hong Kong: Government Printer.<br />
23'()Ž7îï1<br />
µºÂµM{î&_Ë´µ bcÂ&GaµºÂµH&Q…´¡¢ŽÕ<br />
j9_£¤ŽÕj9Ã…ÕájµK¾M9:1sN&jgMçƒ/Ga<br />
T$.¥'()~7MÙÚ1g 1970 lÖ6%ƒ¾i<br />
»m1¦›_FÈM<br />
µº{îH&'()p/MNÏÞ&Ga§¸—¼t¡ë¨©Âµ:23Mµ<br />
îï1<br />
µíMîï±['()'/ihªŽiy&µð6Mçé…YeAHÂ<br />
µ8¯ |«Xm'/¬1äÐú¹ÂµIM³¤o3loµÃîï±!<br />
«23/0Ë°¬1¤«23A®Ë°li¤«/0îï˜F78A®Ë<br />
°_«23µá®>ï%¯°1eH&œGyÂQ…}:MÑÒih&<br />
«œ˜8í&fLyÂá'/-ìM†L1<br />
1997l&'()äåi|'/hiÙÚ&_$ÏäuAi|yÂÎh-ì<br />
(SWIRLS)&h°{î²1ʱœ]²ò;÷!23 256 '³klŽ´°Mç<br />
Modernisation of the City<br />
é¤*+½ Mîï¤uAA®µÂíM³_Æ/µcº8í&hìa.*<br />
>$ÂHMˆá¤äå_ÁÂNO1 159 èé‚%yÂh°8í6xä8yÂh<br />
΃œ&p-ìsŠ/\zyÂh΃œ·iMxO&g± êMθ&\zs<br />
316xÊ!R]^¤yÃM1H¹º&_$2/Aµ»¼ÜÝ£1&\Œh<br />
ì½·a"…àáM¾¿1<br />
!<br />
"<br />
#<br />
$<br />
%<br />
&<br />
262<br />
Fig. 4.14 A SWIRLS rainfall warning system<br />
product, for rainfall nowcasting. Courtesy Hong<br />
Kong Observatory<br />
Ð 4.14‘Ì´i|yÂÎh-ì (SWIRLS)<br />
«i|Áµhi123'()—˜<br />
(/0t«À䀾a'Â
seeding. In May 1954, it once attempted the dry ice seeding method to make<br />
rain in the skies over the catchment areas of Shing Mun and Kowloon Reservoirs.<br />
Planes were employed to drop dry ice on the large cumulus clouds and spray<br />
water on the relatively smaller warm cumuli. This experimental programme<br />
was suspended as a result of heavy rainfall in June that same year. In January and<br />
April 1955, the Observatory sent out planes to Victoria Peak and Mount Gough<br />
and attempted to create rain by spraying water on the cumuli. 160 Unfortunately,<br />
the exercise was unable to increase the rainfall for the year. 161 In 1963, Hong<br />
Kong was in the grip of a severe drought and the Observatory once again<br />
adopted the dry ice seeding method and spread dry ice at a height of 7,000 feet<br />
over Cheung Chau. The result, too, was unsuccessful despite repeated attempts.<br />
ˆÂ{î…]Ì&;
weather reports, route and aerodrome forecasts. In the mid-1970s, a new<br />
dimension emerged — preparation for a new airport. When the government’s<br />
proposal to build a second airport was announced, the choice of a site came<br />
under close scrutiny from all quarters. 162<br />
In 1973, the Civil Aviation Department engaged Ralph M. Parson Co.<br />
to perform a comprehensive and long-term evaluation of the development of<br />
the aviation transport system in Hong Kong. Between 1973 and 1975, that<br />
company inspected 20 sites which included Nim Wan, San Tin, Channel<br />
Water, Cheung Chau, Lamma Island and Chek Lap Kok to look for the best<br />
site for the new airport. The consultants considered the major issues of<br />
construction costs, economic benefits, environmental factors, aviation safety<br />
and regional development, and came up with the conclusion that Chek Lap<br />
Kok was the best site for the new airport. In 1975 to 1977, the Aviation<br />
Advisory Board conducted further research on the consultants’<br />
recommendation. In 1979, the government formally began to plan for the<br />
development of northern Lantau Island. 163 In the same year, the Observatory<br />
Fig. 4.16 Hong Kong Observatory staff making<br />
weather observations at the Chek Lap Kok<br />
temporary meteorological station (1979). Courtesy<br />
Hong Kong SAR Information Services Department<br />
4.16‘'()ws!e45i$/0I
set up a meteorological station at Chek Lap Kok to carry out observations of<br />
weather, marine conditions, turbulence, windshear, etc. 164 Between 1979 and<br />
1982, the Observatory published research reports on the meteorological<br />
conditions at Chek Lap Kok and the nearby region. 165 Concurrently, the Royal<br />
Air Force was responsible for making windshear observations in Chek Lap<br />
Kok, collecting climatological data to ensure safety at the new airport.<br />
Since the opening of Chek Lap Kok airport in July 1998, questions have<br />
been raised regarding the safety of aircraft landing and taking off. Of most<br />
concern is the issue of windshear. Windshear refers to the encountering in<br />
flight of a change in wind direction or wind speed, which leads to a change in<br />
headwind. This change affects the lift of the aircraft and causes the aircraft to<br />
divert from its intended flight path. If windshear occurs during landing or<br />
take-off, a pilot has to take corrective action, or else the plane may land<br />
prematurely, overshoot the runway or result in take-off failure. 166 Windshear<br />
can be caused by many factors such as strong winds passing hills, sea breezes,<br />
low-level jet streams, strong monsoon winds, tropical cyclones, thunderstorms,<br />
cold and warm fronts, etc. 167 Windshear that occurs at Chek Lap Kok airport<br />
Õ1998l7mÆý!e45‚ƒ Ž€´.&ö‚"ÁMnoøùFG<br />
+{Q$&„xjÅ{†xMÊ»e 3 211 {¹<br />
`‚6@&e45‚ƒÕ+«.&ä½»
Modernisation of the City<br />
270<br />
are mainly caused by strong winds blowing across the hills of Lantau Island to<br />
the south of the airport. 168 The hills on Lantau Island are steep, with the<br />
highest mountain reaching a height of over 900 metres above sea level. When<br />
winds with wind speeds reaching 15 knots (equivalent to 28 kilometres per<br />
hour) or above blow from the east, south-east, south or south-west over the<br />
hills on Lantau Island, windshear or turbulence may occur at Chek Lap Kok<br />
airport at the northern part of Lantau Island. 169<br />
Chek Lap Kok airport has an area of 950 acres; 650 acres of which lies on<br />
a reclaimed island. Due to its unique geographical location, it has long been<br />
suspected that the frequency of windshear will be higher than other regions.<br />
Since the Chek Lap Kok airport commenced operation in 1998, reports on the<br />
windshear frequency differ significantly between government and nongovernment<br />
sources. On 23 August 1999, the Sing Tao Daily reported the crash<br />
of a China Airlines passenger plane on the previous day while landing at Chek<br />
Lap Kok, killing three people and injuring 211 others. It claimed that since the<br />
opening of the airport in 1998, the frequency of windshear occurrence was<br />
17%. 170 There were similar reports from other sources and widespread discussions<br />
ensued on the appropriateness of the new airport site. This reported figure was<br />
considerably higher than the official figure released in 2001 on windshear<br />
frequency. According to government statistics, between August 1998 and<br />
December 2000, there were 636 windshear events in the air space near Chek<br />
Lap Kok airport. The figure represented 0.15% of total number of inbound and<br />
outbound flights during the two-and-a-half-year period. Since the airport was<br />
opened, 29 flights had to abort landing due to windshear. Five of the aircraft had<br />
to fly to other airports and the remaining 24 planes were able to land successfully<br />
on a second attempt. 171 For the three-and-a-half-year period between August<br />
1998 and December 2001, the Observatory reported in 2002 that the windshear<br />
frequency was one for every 700 flights, which worked out to 0.14% of the total<br />
inbound and outbound flights. For every 2,500 flights, there was one reported<br />
incidence of severe turbulence — equivalent to 0.04% of the total inbound and<br />
outbound flights. 172 The windshear figures of the Observatory for 2001 to 2002<br />
came primarily from flight reports, which might have differed from the actual<br />
figures. However, according to the Observatory’s statistics for the period from<br />
1998 to 2002, cases of strong winds (wind speed of 41 to 62 kilometres per<br />
hour) represented only 0.31% and cases of gales exceeding 63 kilometres per<br />
hour accounted for a mere 0.03%. 173 Based on these statistics, it would be<br />
impossible for windshear to occur 17% of the time. Actually, for a city like<br />
Hong Kong that is short of land resources, to find a site for the new airport that<br />
is free from windshear is virtually impossible.<br />
{…†»
To improve aircraft safety in take-off and landing, the Observatory had set<br />
up, long before the opening of the airport, various instruments in the vicinity of<br />
the airport to measure windshear and to improve the windshear alert system. In<br />
mid-1996, the Observatory installed a US-made Doppler weather radar at Tai<br />
Lam Chung. The radar was able to detect automatically windshear caused by<br />
systems such as thunderstorms and tropical cyclones. 174 At Sha Lo Wan and Siu<br />
Ho Wan on Lantau Island, the Observatory also installed wind profilers to measure<br />
the winds at different heights in the lower atmosphere to provide information<br />
on vertical windshear. In addition, the Observatory also established anemometer<br />
stations near the airport. They included Sha Chau, Tai Mo To, Siu Ho Wan, Yi<br />
Tung Shan, Nei Lak Shan, Sham Wat and Tai O. The Observatory made use of<br />
the wind direction measurements and wind speed data to study how terrain<br />
affected the air currents over Chek Lap Kok airport and to calculate terraininduced<br />
low-level windshear.<br />
Modernisation of the City<br />
In 2002, the Observatory deployed two weather buoys in the waters<br />
about one kilometre west of Chek Lap Kok airport. The weather buoys collect<br />
meteorological data on wind, air pressure, temperature and relative humidity;<br />
and provide meteorological information over the waters for evaluation of<br />
windshear events. Weather buoys are able to detect windshear caused by sea<br />
breezes from the west earlier than land-based automatic weather stations.<br />
In August 2002, the Observatory completed the acceptance testing of a<br />
Doppler LIght Detection And Ranging (LIDAR) system. The LIDAR is located<br />
near the centre of Chek Lap Kok airport. Through a laser beam, the system<br />
detects the movement of aerosols in the air and monitors the occurrence of<br />
windshear and turbulence on the two runways even when there is no rain. 175<br />
In the four years between 1998 and 2002, the number of aircraft landings<br />
and take-offs rose by an average of 5.1% per annum. The figure increased from<br />
164,072 in 1997–98 to 197,743 in 2001–02. During the same period, the air<br />
passenger numbers grew by an annual average rate of 4.4% — rising from<br />
27,288,882 to 32,117,879; while airfreight volumes grew by an average of 4.5%<br />
and increased from 1,795,740 tonnes to 2,119,620 tonnes. These figures show<br />
clearly the immense potential of Hong Kong’s aviation transport industry. 176<br />
Environmental Monitoring<br />
ßf/>Qí9&µºÆ/ŒÕ¹±ºM»»Ÿ&|IâRG»E6½M}~&_íq[AªE«PMŒ`»
and became urban pollution sources. The population at that time was fully<br />
engaged in developing the economy, without paying due attention to the<br />
protection of the environment. But when the economy was thriving, the<br />
public who had become well to do began to worry about the health hazards<br />
posed by environmental pollution. The widespread fears in the mid-1980s<br />
about the building of a nuclear power plant at Daya Bay, Guangdong, were<br />
symbolic of the struggle between economic development and personal safety.<br />
The Observatory’s radiation monitoring work has played an important<br />
reassuring role in allaying public fears.<br />
Radiation Monitoring<br />
The fact that the Observatory was tasked with monitoring the radiological impact<br />
of the Guangdong Nuclear Power Station at Daya Bay had its historical origins.<br />
Back in June 1958, the Observatory, for the first time, measured the level of<br />
atmospheric radioactivity. This aim was to monitor the effects of atmospheric<br />
nuclear testing in the 1950s on air quality. 177 The findings were presented in the<br />
\]^_<br />
gÆv$iÏI…†MÔçé꯰t«['()ÿ!Ê…x'~t¡M11958<br />
l6m'()ź$bcÆ/<br />
jM[…Fù1<br />
3. X 24 >$ÕµÂí|¸Â‡u1<br />
4. |¸¾‘mk‘LMz‡u1<br />
Modernisation of the City<br />
!<br />
"<br />
#<br />
$<br />
%<br />
&<br />
274<br />
Fig. 4.21 Guangdong Daya Bay Nuclear Power<br />
Station (2002). Courtesy Hong Kong Observatory<br />
4.21‘`éÆv$iÏI (2002 l)123<br />
'()—˜<br />
Fig. 4.22 Lingao Nuclear Power Station (2002).<br />
Courtesy Hong Kong Observatory<br />
4.22‘—diÏI (2002 l)123'()<br />
—˜<br />
275
Meteorological Report, published by the Observatory, for research use by the World<br />
Meteorological Organisation. The findings were also sent to the Puna Observatory<br />
in India for comparison with its local findings. 178 In 1960, apart from atmospheric<br />
radioactivity monitoring, the Observatory also undertook radioactivity<br />
monitoring of rain and drinking water. In 1961, sample collection at the King’s<br />
Park Radiation Monitoring Station followed the procedures below:<br />
1. Use a fibreglass filter with a diameter of 2.2 inches to collect<br />
air samples.<br />
2. Fill a 20-inch diameter container with half an inch of water<br />
and collect airborne particulates once every 48 hours.<br />
3. Collect samples of rainwater from rain gauges once every<br />
24 hours.<br />
4. Collect drinking water samples from water taps in<br />
Kowloon Peninsula.<br />
The samples were sent to the radiology unit at Queen Mary Hospital for<br />
testing. In 1965, the scope of monitoring included gross gamma radioactivity<br />
and caesium-137 radioactivity concentration level measurement.<br />
Fig. 4.24 Radiation measurement instruments<br />
at the King’s Park Meteorological Station (2002).<br />
Courtesy Hong Kong Observatory<br />
4.24‘{ó!é꯰9: (2002l)1 2<br />
3'()—˜<br />
Modernisation of the City<br />
!<br />
"<br />
#<br />
$<br />
%<br />
&<br />
276<br />
Fig. 4.23 Staff carrying out a radioactivity check<br />
on imported livestock (2002). Courtesy Hong Kong<br />
Observatory<br />
4.23‘t«Ùs .
In 1983, when the decision to build the Daya Bay Nuclear Power Station<br />
was made, residents of Hong Kong were deeply concerned with safety. A<br />
background radiation monitoring programme was implemented as a result.<br />
The objective was to determine the baseline radiation level before the Daya<br />
Bay Nuclear Power Station commenced operation, and to evaluate the changes<br />
in radiation levels after the nuclear power plant started to operate. Major<br />
components of the programme included measuring the ambient gamma<br />
radiation level, and the alpha, beta and gamma radioactivity levels of the<br />
environmental samples. For this project, the government allocated an initial<br />
sum of HK$2 million for equipment procurement. In 1985, samples collected<br />
were limited to drinking water, inter-tidal sediments, soil and seawater. 179 In<br />
1987 the scope of the monitoring programme was expanded to cover measuring<br />
the radioactivity of air, drinking water, soil and foodstuffs.<br />
To monitor radiation exposure through the atmosphere, enviromental<br />
gamma radiation levels are measured round-the-clock by 10 high pressure<br />
ionization chambers in the territory. Another of 27 thermoluminescent<br />
dosimeters were placed in Hong Kong, Kowloon and the New Territories to<br />
measure the accumulated ambient gamma dose. Each year, the Observatory<br />
carries out four upper air radioactivity observations and collects samples of<br />
airborne particulates and wet deposition at King’s Park, Sha Tau Kok and<br />
Yuen Ng Fan.<br />
‡u±‰[Š‹«Ýéê-‡×11965léê°µkl;uŒéê@åÎ&´ëìiÏÞp6<br />
6éê@M,c&_¯°éê‘’MxO1¯°Žž;
direct links with the mainland’s meteorological agencies and the authorities in<br />
charge of nuclear emergencies to strengthen information exchange. A<br />
contingency plan has been formulated for nuclear emergencies, and has put in<br />
place a warning system for abnormally high radiation levels. In the case of<br />
radiological emergencies, the Observatory co-ordinates emergency monitoring<br />
with other government departments and renders support.<br />
a¤¦$ Þ_ÆMäaÃ&'()|§ŽŒþ¨î9ÉFÈA——M<br />
vê´iu«Œþ¨î8í1<br />
z˜‡uM|×uAᢠ½6Mz%&J;¤©¤ª«¤¬«¤¬×<br />
®¤¯¤°¤¢±¤±k_2²Ãolo…\6Mz%.²&¸‡oÿ.X*œ<br />
mFù1<br />
The work of environmental radiation monitoring of the Observatory<br />
has spanned over 40 years, from a limited scope in monitoring atmospheric<br />
radioactivity in the 1950s to the present full-fledged environmental monitoring<br />
programme that took shape in the 1980s. Such a development was in line<br />
with the changing needs of society. Since the establishment of the capability,<br />
there has not been a single incident requiring the Observatory to execute the<br />
contingency procedures. However, the monitoring results that are published<br />
at regular intervals are not only of important scientific research value, but they<br />
also form the basis for the government to formulate its contingency plans.<br />
The monitoring work is indispensable in assuring the health of the public of<br />
Hong Kong.<br />
eH'()pË´G"‚_³´‰Ð&PCcF><br />
佟Š$M6c01&Jéê@VMÎi-ì&|éêšµ—|…$&<br />
gx£no7¸Bœg\./1<br />
é꯰t«· 1950 lÖ×%Æ/¯°&N·g 1980 lÖÔçéê¯<br />
°&„W…40]lMÜ×&xäåM{Ê56°±äåM£1„»cM1Õ<br />
¯°í÷I=.&ÁVM6c01 FGa…‚±»1&Š¯°M²wc%ä<br />
¯&sŠ…®±M×ØÑÒ]^¼w&_$2ÊnoCcŽ ÁVŸŠh\_6<br />
c01MX1²é&»ÊmÖŽ ÙqÉgh½à3s/zMÔÕ1<br />
Ultraviolet Index Application<br />
`abc+def<br />
Modernisation of the City<br />
280<br />
With the rapid development of the world’s economy, the damage inflicted on<br />
the environment has risen sharply. In the mid-1980s, scientists discovered that<br />
in the Southern Hemisphere, during the spring season from September to<br />
November, the ozone concentration in the atmosphere dropped drastically.<br />
Ozone is usually most abundant at 20 to 25 km above the earth’s surface. The<br />
fact that the atmosphere can absorb the sun’s ultraviolet (UV) rays depends<br />
largely on the presence of ozone, which makes up less than 1% of the<br />
atmosphere. 181 Without the protection of the ozone layer, the UV radiation<br />
will pass through the atmosphere unimpeded and endanger some of the living<br />
species on earth. On days when there is plenty of sunshine, UV radiation will<br />
be strong. People who are exposed to UV radiation unprotected for a long<br />
period can suffer skin and eye damage. For serious cases this can lead to skin<br />
cancer and cataracts. 182<br />
In 1985, 28 countries from all over the world reached an agreement in<br />
Vienna on ozone layer protection — the Vienna Convention for the Protection<br />
of the Ozone Layer. On 16 September 1987, 26 nations met in Montreal,<br />
Canada, and signed the ‘Montreal Protocol on Substances that Deplete the<br />
oÛÜÝMV äå&ÌAÛÔç{ȸM¡º#¹1 1980 lÖj%&×Ø]<br />
ämrmÛMºò˜˜T 9 11 m%À&r®F`Æ/Õ»¼ŽºÆY\z1<br />
»¼Fðc²|óA®:2025'³1Æ/Õ¾¢Ów½4M¾HÎ&²1Ê<br />
²ÄÆ/vµs•1%M»¼1 181 J…Æ/Õ»¼M¿À&w½M¾HÎGa<br />
êAÛ&±ÁÂAÛF78½%1½4ãÃM":&¾H4¼º±&ÙA!Íq<br />
Ozone Layer’ to control the use of chlorofluorocarbons. The protocol came<br />
into force on 1 January 1989. 183 At the United Nations Conference on<br />
Environment and Development held in 1992, the ‘Agenda 21’ plan was<br />
adopted; this plan of action called for urgent research on the effects of the<br />
depletion of the stratospheric ozone layer and the UV radiation on human<br />
health. After this conference, the World Meteorological Organisation, the<br />
World Health Organisation, the United Nations Environment Programme,<br />
the International Agency for Research on Cancer and the International<br />
Commission on Non-Ionising Radiation Protection established a global UV<br />
project — INTERSUN. The goal was to promote research into UV radiation<br />
and to draw the world’s attention to the effects of UV radiation on human<br />
health. In 1994, the project formulated the UV monitoring index and<br />
recommended to all meteorological agencies that the index be included in<br />
weather reports. 184<br />
Of the different radiation wavelengths emitted by the sun, UV waves are<br />
invisible to the human eye. UV radiation can be classified according to<br />
wavelengths into UV-A (with wavelengths of 315 to 400 nanometres), UV-<br />
B (with wavelengths of 280 to 315 nanometres) and UV-C (with wavelengths<br />
of 100 to 280 nanometres). Any UV radiation with wavelengths smaller than<br />
280 nanometres will have little effect at ground level, as such radiation would<br />
have been absorbed by the ozone layer before it reaches the earth’s surface.<br />
UV-A and UV-B radiation have longer wavelengths and can penetrate the<br />
atmosphere; prolonged exposure could result in skin cancer and cataracts.<br />
The intensity of ultraviolet radiation varies in different regions, weather<br />
conditions and time periods. The UV intensity will be high at noontime,<br />
when the position of the sun is high, on snow surface and at high-altitudes. 185<br />
w½v8.s_×ÊMéêj&ÙM«ÈPs¾f¿¾HÎ&„¾HÎ/<br />
Rx×þ8 A (×þ 315 400 Ì;)¤ B (×þ 280 315 Ì;)_ C (×þ 100<br />
280 Ì;) *Ì&Œ| 280 Ì;×þM¾HÎ C ag÷A®$W+»¼Õ¢<br />
Ó&aÙ7}~®ˆú„×þýþM¾HÎA_B/Ø*Æ/Õ&Nµ¢Ó/y<br />
PÆÇË_¢Žr1s_AH¤s_/Ĥs_$À&¾HÎM¼ºQsd_&<br />
JX'M 9$,&½4GêA®&¾Hμº®±ú¥H&!¼÷^ê¾HÎ<br />
MÙA¤!`/Ú‹M±A&¾HÎM¼º2±ý±1 185<br />
oÛÕw½í÷ (INTERSUN) EI8M¾HÎ%ç&íqM{î²1Ê<br />
µºG 400 Ì;s_×þMw½¾Hμº&6Ë´ÏÛÜ«´4¨ÝÎÐŽ<br />
a6M#‡çwÄ^_ÙAÆÇa¾HÎM^61¾HÎ%ç8.115º&¾<br />
HÎ%ç*±&aÙAˆe¹ÂM‚±*Æ1FðvfÙ/a{M¾HÎéê%<br />
ç. 6 ºÄ1 186 èé&@VW&¾HÎ%ç÷g 6 & ês(Þ{½4Ga<br />
êN12>$ú%ç÷10º9±»Û&½4/¾|m>$ŽÅ¹Ù71 187<br />
23'()|1999 l 10m 15"R@A-SVW&Åù!2F ê'ß<br />
u3AH¾HÎM ꡺&{| ê«8\
On 15 October 1999, the Hong Kong Observatory followed the<br />
international standard and started, for the first time, to inform the public through<br />
its website the UV Index in Hong Kong, and to urge people to adopt protective<br />
measures. From 1 April 2000 onwards, the Observatory broadcast the daily<br />
UV Index on radio and television, as well as through the UV Index telephone<br />
advisory service. The index was classified into five categories: low, medium,<br />
high, very high and extreme. On 8 August 2002, the Observatory revised the<br />
UV Index classification scheme; the new scheme changed the ‘high’ category<br />
(UV Index 5) under the existing scheme to ‘moderate’ category, and the<br />
‘extreme’ category (UV Index 9 and 10) to ‘very high’ category. A UV Index<br />
of 11 or above was categorised as ‘extreme’. This classification system is still in<br />
use in 2003.<br />
At present, places which monitor and broadcast the UV Index include<br />
the US, Britain, Germany, Australia, New Zealand, Japan, Taiwan and Hong<br />
Kong, but the alert classification system varies (see Table 4.5).<br />
!Ï)¤Ïàiy¾HÎ%ç_ÏṺ¾HÎ%çOP1¾HÎÄÅ çpR<br />
%籌&8.Œ¤j䱤U±á®±õÃ12002l8m8"'()â,¾<br />
HÎ%ç8 î&pCcM8 î}'.+Õ.±ºÁÛM5º,.j &„Á<br />
Û¡º®±M 9 º_ 10 ºM¾HÎ%çÁ .ÁÛ¡ºU±&„d0ò±| 11<br />
ºM¾HÎ%çÕ.ÁÛ¡º®±& 2003 l¬€³´1<br />
¦›&Ë°_䯾HÎ%çMAH;$j 6.9% 1 188<br />
1999l8m2002llŒ'()QM›'űM¾HÎ%ç³²18¯!<br />
5 8 m&„ 2001 l 6 m 17 "űM¾HÎ%ç÷ 13.9 º&‹‹NÙ7/ñ<br />
{Mw½é꼺&'()Ë´¹Ìå7äv…†ƒÔ&gæ ê«h\011<br />
!<br />
"<br />
#<br />
$<br />
%<br />
&<br />
285
2002 mainly occurred between May and August. On 17 June 2001, the UV<br />
Index reached a maximum of 13.9, which far exceeded the human tolerance<br />
level. Through various media, such information was released to the public,<br />
alerting them to take all necessary precautionary measures.<br />
Table 4.6 Hong Kong’s Highest UV Index (1 August 1999–31 August 2003)<br />
Position Maximum UV Date<br />
Index of the Day<br />
(15-minute mean)<br />
1 15 23 Jul 2003<br />
2 14 12 Jul 2003<br />
3 13.9 17 Jun 2001<br />
4 13.7 5 Aug 2001<br />
5 13.4 22 Jun 2002<br />
6 13.3 6 Aug 2000<br />
7 13.3 6 Aug 2001<br />
8 13.2 21 Jun 2002<br />
9 13.1 24 Jun 2000<br />
10 13.1 13 Jul 2000<br />
Source:<br />
Internal records of the Hong Kong Observatory.<br />
The formulation of the exposure categories based on the UV Index makes<br />
it easier for the public to comprehend the meaning of the index. Since the<br />
launch of the index, Hong Kong people have become aware of the intensity<br />
of sunlight during outdoor activities. This shows that the introduction of the<br />
index has succeeded in educating the public and reduced the possible harm<br />
that UV radiation can inflict on humans.<br />
% 4.6 o3ű¾Hγ (1999 l 8 m 1 " –2003 l 8 m 31 ")<br />
zB {k|}~`abc+ k€<br />
(15 7 ‚ƒ„)<br />
1 15 2003 l 7 m 23 "<br />
2 14 2003 l 7 m 12 "<br />
3 13.9 2001 l 6 m 17 "<br />
4 13.7 2001 l 8 m 5 "<br />
5 13.4 2002 l 6 m 22 "<br />
6 13.3 2000 l 8 m 6 "<br />
7 13.3 2001 l 8 m 6 "<br />
8 13.2 2002 l 6 m 21 "<br />
9 13.1 2000 l 6 m 24 "<br />
10 13.1 2000 l 7 m 13 "<br />
îï.¡½<br />
23'()Ž7îï1<br />
Ë´¾HÎ%ç«åæECcMÄÅ ç8 C&̲ÔÆ‹pžß”ç%<br />
çM1è1Õ¾HÎ%çI86& ê›8†xéHàá%Àw½ êM¼ê<br />
¡º&/¿…†%«W÷gf©ª êM¦M&\Œfw½éê/¾±aÙAˆ<br />
e¹ÂM‚±1<br />
rOst<br />
uLHI<br />
Prepared for a Rainy Day<br />
'/ih·›¾T³6m%ë¸.æ^Ùó„9&sc„'e.Xœ<br />
½àMX1%«&Ü'fFÊ
Improvement in Weather Forecasting<br />
The weather reports of the latter half of the nineteenth century had no appreciable<br />
impact on the daily lives of ordinary people. The weather reports during that<br />
period served mainly professional and academic purposes, and were used as reference<br />
by seafaring people. This was reflected from the format and contents of the<br />
newspapers’ weather reports. In the 1840s, there was no weather information of<br />
the day in the weather columns in English language newspapers such as China<br />
Mail and The Friend of China, but only those of the day before or the previous<br />
month. Their weather reports included information on the maximum and<br />
minimum temperatures, the highest and the lowest atmospheric pressure, wind<br />
directions, etc. There was nothing on weather forecasts.<br />
!'()"ae:“›&FGë.æ^ÙóˆÆæ^$íM'ÆJîhÌ'<br />
Æ (Messrs G. Falconer & Co.) Ê'/ðÔMg\À&X"!F99$_Ä94<br />
$&ñ¤±}'ÆM¹Û·ºí¤ÍÛ·ºí_/¸íEµºgM/·_/¸N<br />
O!iÇFäÐ1'/NO²1MN·º_/¸ñçQò& oJ…(ƒML<br />
_ ”1 189 a·ºíò/¸íMK¾PsúcM²ÔÆ‹. &)GîïPÍF<br />
81è1'()e:6&…†'/iyMŽžcQýóAá`Õ&[Riy2<br />
30"M/¸¤/·¤¹º¤»¤»¼_/Ä&Û#HŽ43œŽ M'/i<br />
h¤…†þ|AH;
In the 1850s, weather reporting was merely a summary of the<br />
climatological conditions of the past. For example, the calendar would contain<br />
information such as the monthly maximum and minimum atmospheric<br />
pressure, temperatures and wind directions, based on information obtained in<br />
the past. Through reading the calendar, ordinary people got a rough<br />
understanding of the seasonal changes, but not the daily weather conditions.<br />
It was only in the early twentieth century that one could find short-term<br />
weather forecasts in the newspapers. The weather reports still primarily covered<br />
the previous day’s weather conditions such as atmospheric pressure distribution,<br />
temperature and wind directions, with only a brief section on the forecast of<br />
the day. The elements included in the forecast were mainly wind direction,<br />
rainfall and the general weather situation.<br />
„'*¤fgM'/h°iyMŽž&ÆñgJ›T³³MdÆ&ŠiyM<br />
ªŽ+ os_˜˜ (P,ÊxjMFÆFt&¥H…†'/MîQc<br />
Q]S‡_-»&…*+½ &…/¸8¯ 1„iyQAµMN 0&Uá<br />
.Ù% ”&̲ÔÆ‹pžß”¢xjŽž&/hò'/ðÔe.½àMX1<br />
FÔ1FGX1MÑÔ&_´ûœÐ÷H&pFG8Ae.@'/Îi&a<br />
011Hä½…FcMh\«´1eH&iyMåGQd0]&_iÇáÏ)`<br />
'H&p…Ïà)iy¤ÏṺOP_2F'/iy1'()M'/2ŸpÊ<br />
NÄçl ꧸ƵT$_2"'/îÑMtÿ&QÊ'()g êGaaZ<br />
M²13M1Õ 1998 lØ&4”'()2ŸMùçÆYÛþ123'().’<br />
œ@TU/0-SY:MÅœ5qoÛ;{Ž '/hiM2I (http://www.<br />
worldweather.org) Q`{6ê&Ì FGŒºÏäM@]2/Åù!@A7)F<br />
å[£¤M;{'/hi1<br />
For the 20 years immediately after the Second World War, no changes in<br />
the reporting format took place. From the 1930s to 50s, the substance of weather<br />
reports remained basically the same as in the early years of the nineteenth century,<br />
covering mainly the temperature, sunshine duration, rainfall, humidity, wind<br />
directions and speeds of the day before. The focus of the one-day weather<br />
forecast also saw no appreciable change. The public had not been adequately<br />
warned before the catastrophic typhoons struck in 1906 and 1937. This<br />
illustrated the relative unimportance attached to weather warnings.<br />
% 4.7 23 깺'/ùçìí (1985–2002)<br />
(ì ½)ù)<br />
&' …†‡ˆ|‰Š‹ …†‡ˆ / Œ Š‹<br />
Ž ‡ˆ uL‘ Ž=>5’‡ˆ“”‘<br />
1985 56 –<br />
1988 1,000 –<br />
1989 1,300 –<br />
1990 1,700 –<br />
1991 4,300 –<br />
1992 7,700 –<br />
1994 12,000 –<br />
1995 20,000 –<br />
1996 23,000 –<br />
1997 23,000 –<br />
1998 24,000 520<br />
1999 25,000 1,250<br />
2000 23,000 1,030<br />
2001 23,000 980<br />
2002 20,000 820<br />
Modernisation of the City<br />
290<br />
Hong Kong suffered many natural disasters in the 1960s. The onslaught<br />
of Typhoon Wanda in 1962 and the drought of 1963 made inclement weather<br />
a consuming concern of the whole community. Weather reports made<br />
newspaper headlines every day and became the hottest topic pursued by the<br />
mass media. Consequently, weather reports became multifaceted. Besides<br />
covering the pressure pattern within the region and the general weather<br />
information such as temperatures, relative humidity, wind direction and speed,<br />
there were also regular reports on the daily rainfall statistics and historical<br />
figures for comparison. Nevertheless, weather forecasts were still limited to<br />
24 hours ahead. Longer-term forecasts only appeared towards the end the<br />
twentieth century. The year 1999 saw the introduction of three-day weather<br />
forecasts and the present five-day forecasts were launched from 2002.<br />
Today’s weather forecasts are generally similar in content to those in the<br />
early twentieth century, but with a completely different reporting format. A<br />
special feature of today’s weather report is the combined use of text and visual<br />
illustrations. The related weather data are also more detailed and multifaceted,<br />
with satellite cloud pictures and surface pressure charts. Reporting is often<br />
îï.¡½<br />
23'()Ž7îï1<br />
!<br />
"<br />
#<br />
$<br />
%<br />
&<br />
291
illustrated by pictures and images such us cartoon characters to facilitate easy<br />
understanding by the public. This has made foreknowledge of the changes in<br />
weather an important part of daily life. Certain types of important information,<br />
in addition to the use of symbols, are also categorised into different types of<br />
hazardous weather warnings; they play a role in the prevention of weatherrelated<br />
accidents. In addition, various media are employed in weather reporting,<br />
including newspapers, radio broadcasts, television reporting, telephone enquiry<br />
service and the internet. The Observatory’s website is a portal for the public<br />
to gain access to a wealth of current and past weather information. It is also<br />
one of the Observatory’s key channels to interact with people in Hong Kong<br />
and all over the world. The number of visits to the Observatory’s website has<br />
grown phenomenally since 1998. The world’s first website on global official<br />
city weather forceasts (http://www.worldweather.org), developed by the<br />
Observatory under the auspices of the World Meteorological Organisation,<br />
has also gained tremendous popularity, enabling some least developed countries<br />
to make their official forecasts widely known to the international community<br />
for the first time.<br />
Fig. 4.28 Steady growth of visits to the<br />
Observatory’s website, 1999–2003. Courtesy<br />
Hong Kong Observatory<br />
4.28‘19992003lÀ4”'()2ŸM<br />
ùç…µcÛþ 7123'()—˜<br />
Table 4.7 Statistics on Weather Enquiries (1985–2002)<br />
•–—d˜<br />
Modernisation of the City<br />
(Unit: 1,000)<br />
Year Through the Telephone Through the Telephone<br />
Recorded Dial-a-Weather<br />
Information Enquiry<br />
Service<br />
System<br />
(Via Telephone)<br />
(Via Telephone/Fax)<br />
1985 56 –<br />
1988 1,000 –<br />
1989 1,300 –<br />
1990 1,700 –<br />
1991 4,300 –<br />
1992 7,700 –<br />
1994 12,000 –<br />
1995 20,000 –<br />
1996 23,000 –<br />
1997 23,000 –<br />
1998 24,000 520<br />
1999 25,000 1,250<br />
2000 23,000 1,030<br />
2001 23,000 980<br />
2002 20,000 80<br />
Source:<br />
Internal records of the Hong Kong Observatory.<br />
'/hh¾¸Q êƒ8&e.mÖ½às/ò±MFÔ&Ų1M'5Ê'/h<br />
hMWú´"…g±1´°9:M
Improved Accuracy<br />
The success of weather forecasts in gaining people’s trust and becoming an<br />
indispensable part of modern living depends largely on gradual improvements<br />
made in forecasting accuracy. A combination of advancement in measurement<br />
instruments, progress in computer technology and development in international<br />
information networks have continuously widened and deepened the dimensions<br />
of meteorological data collection, and contributed significantly to improved<br />
forecasting accuracy.<br />
In 1959, the Observatory installed its first weather radar, a Decca 41<br />
radar system, at Tate’s Cairn, with a 3-cm wavelength that limited its vision<br />
field. It could only exhibit a Plan Position Indicator (PPI) image on a<br />
monochrome cathode-ray tube display. A Plessey 43S radar was installed<br />
adjacent to the Decca 41 radar in 1966, with an operating wavelength of 10<br />
cm. The latter radar possessed a bigger antenna and a high power transmitter,<br />
with a 440-km radius detection range. It was also equipped with a better<br />
attenuator that enabled the forecaster to estimate the rain intensity based on<br />
the echo strength and thus facilitating weather observations. However, both<br />
Fig. 4.30 Observatory staff manually aligning<br />
an aerial to receive images from a US weather<br />
satellite, at a home-made tracker station. (1965).<br />
Courtesy Hong Kong SAR Public Records Office<br />
4.30‘'()Ì´ÙŠˆÆ'ÎaÓN@'<br />
/*+M}B (1965l)123FG=nH'~<br />
—˜HHI<br />
Modernisation of the City<br />
294<br />
Fig. 4.29 The Doppler acoustic radar system used<br />
by the Observatory to measure wind speed and wind<br />
directions (1983). Courtesy Hong Kong SAR<br />
Information Services Department<br />
4.29‘'()Ì´]²ò;÷-ì&´°»<br />
Ÿ_» (1983l)123FG=nHnopI<br />
ë—˜<br />
Fig. 4.31 Satellite receiving station at the<br />
Observatory headquarters (1980). Courtesy Hong<br />
Kong SAR Information Services Department<br />
4.31‘'()~7A®Ùˆ*+aÓI<br />
(1980 l)123FG=nHnopIë—˜<br />
!<br />
"<br />
#<br />
$<br />
%<br />
&<br />
295
Fig. 4.33 The first digital weather radar was<br />
installed at Tate’s Cairn in 1983. Courtesy Hong<br />
Kong SAR Information Services Department<br />
4.33‘1983 l'()!Æ:!9“Å7ç<br />
ƒ‡'/;÷123FG=nHnopIë—<br />
˜<br />
Fig. 4.32 A weather forecaster keeping a close<br />
eye on the weather radar (1968). Courtesy Hong<br />
Kong SAR Information Services Department<br />
4.32‘'()hisËf;÷/0îï<br />
(1968 l)123FG=nHnopIë—˜<br />
Modernisation of the City<br />
296<br />
the 1959 and 1966 radars were primitive monochrome instruments that were<br />
unable to store images, and the blurred images could only be viewed inside a<br />
dark room. Thus, they would not be turned on continuously but were only<br />
used in times of need. In 1983, at the site previously occupied by the Decca<br />
41 radar, the Observatory installed a digital radar; this solved the previous<br />
technical problems and provided weather forecasters with useful data. This<br />
radar system was made of three parts: the Tate’s Cairn Radar Station, the<br />
computers and monitors at the Observatory headquarters, and the remote<br />
monitors that linked the Airport Meteorological Office to the headquarters.<br />
With the use of digital video signal processing technology to display the PPI<br />
and the Range Height Indicator (RHI) in colour, round-the-clock weather<br />
observations were made possible; and Constant Altitude Plan Position Indicator<br />
Fig. 4.34 Weather forecasters drawing weather<br />
charts (1965). Courtesy Hong Kong SAR<br />
Information Services Department<br />
4.34‘/0Ë°sJ.'/ (1965 l)1<br />
23FG=nHnopIë—˜<br />
!<br />
"<br />
#<br />
$<br />
%<br />
&<br />
297
Fig. 4.35 Observatory forecasters analysing the<br />
weather situation with the use of real-time<br />
meteorological display (2003). Courtesy Hong<br />
Kong Observatory<br />
4.35‘'()hisË´»$/0îï•[<br />
8í'/ª7 (2003)123'()—˜<br />
Fig. 4.36 Observatory forecasters formulating 5-<br />
day weather forecasts on the basis of objective<br />
guidance from numerial models (2003). Courtesy<br />
Hong Kong Observatory<br />
4.36‘'()his]^çw¿ŽMüË%<br />
«Cc5''/hi (2003l)123'()—<br />
˜<br />
Modernisation of the City<br />
298<br />
(CAPPI) pictures were provided by volume scans of the atmosphere performed<br />
1994l'()6’“]²ò'/;÷-ì&_/MN•[ g\Á¼º<br />
every six minutes. Through the radar pictures taken at different times, the<br />
_ÂHˆáxOH&p/Y«Æ/RGQ® ¤ÕáÎiÑœ¤Å±ÁÂÿ¤ó<br />
Observatory was able to monitor the movement and development of rain<br />
ôµ ¤RGóô8A ¤v×#7 ¤±Ÿºëð:7îï_h°»y<br />
areas and enabled it to forecast the movements of rain-bearing clouds.<br />
í®Ãih1 190 '/;÷ÙÚM,¤Í»M¼º¤ˆáM “¤íqF`s_±º<br />
In addition to the provision of information on rain intensity and rain area<br />
M»Ÿ_»1 191<br />
movements by way of images, the new radar was able to produce vertical<br />
cross-section charts of the atmosphere, automatic warning signals, maximum<br />
'/hi"‰Wú&1970lÖ³%ÏÞÙÚM,
Breakthroughs were achieved in weather forecasting, and the<br />
advancement of computer technology in the early 1970s represented the second<br />
stage of technological breakthrough. New computers overcame the storage<br />
limitation of machines of the earlier generation and enabled the expansion of<br />
the meteorological information database. The data could also be analysed<br />
quickly and accurately with the use of computer programmes. For example,<br />
the numerical weather prediction technique uses high-speed computers to<br />
simulate the physical laws governing changes in the atmosphere and forecast<br />
the evolution of the atmosphere. The variables involved in the mathematical<br />
equations include wind, temperature, air pressure, moisture content, etc.<br />
Modernisation of the City<br />
300<br />
For the present five-day medium-range weather forecast, the Observatory<br />
uses the high-resolution Grid Point Value (GPV) products in GRIB format<br />
from the European Centre for Medium-Range Weather Forecasts, the United<br />
Kingdom Meteorological Office, the Japan Meteorological Agency, and the<br />
US National Centre for Environmental Prediction. In December 1999, the<br />
Observatory adopted the Operational Regional Spectral Model (ORSM) as<br />
the basis for making one- to two-day short-term weather forecasts. Such a<br />
model is run on the platform of a Cray SV1-1A supercomputer, which has<br />
16 central processing units with a peak performance of 19.2 gigaflops. The<br />
20-km (inner domain) ORSM is run eight times a day while the 60-km<br />
(outer domain) ORSM is run four times a day. The forecast information will<br />
be visualised using two-dimensional and three-dimensional weather charts.<br />
To facilitate the dissemination of local weather forecasts, data such as surface<br />
wind, temperature, humidity, cloud cover and cumulative rainfall over Hong<br />
Kong are extracted from the model.<br />
The number of weather out-stations has also been on the increase since<br />
the end of the Second World War. From 1984 onwards, the Observatory<br />
increased the number of automatic weather stations that were linked directly to<br />
the headquarters to make observations of the wind speed, wind directions,<br />
humidity, air pressure and rainfall of Hong Kong region. At present, there are<br />
three stations that are manned 24 hours a day — the Hong Kong Observatory<br />
headquarters, King’s Park Meteorological Station and Chek Lap Kok Airport<br />
Meteorological Office. In 2002, there were a total of 62 automatic weather<br />
stations: 24 of which were installed with the same instruments as those in the<br />
manned stations; nine stations were equipped with anemometers only; 21 stations<br />
were rain gauge stations; eight anemometer stations were located in the airport<br />
areas and dedicated to the Wind Analyser System; as well as two weather buoys<br />
placed in the waters west of Chek Lap Kok airport. The data collected from the<br />
Fig. 4.37 A three-dimensional representation of<br />
the state of the atmosphere, a product of the<br />
Observatory’s regional numerical model. Courtesy<br />
Hong Kong Observatory<br />
Ð4.37‘'()H2çw¿ŽMFL6˜&•<br />
[Æ/M*H² (2003) 123'()—˜<br />
X"+q8ù&60'³H¿ŽX"+q4ù&hiîï±+JYeJH_*HM<br />
'/ &Ì
Fig. 4.39 Temperature readings are taken daily<br />
under the palm thatch hut at the Tsim Sha Tsui<br />
Hong Kong Observatory headquarters (1983).<br />
Courtesy Hong Kong SAR Information Services<br />
Department<br />
4.39‘ |ÐÑù'()~7M[\&FG<br />
.°Ê]v·ºíMA{&2Ê'()X'<br />
/·³ME!A (1983l)123FG=nH<br />
nopIë—˜<br />
Modernisation of the City<br />
!<br />
"<br />
#<br />
$<br />
%<br />
&<br />
302<br />
Fig. 4.38 Shatin Racecourse Automatic Weather<br />
Station (2002). Courtesy Hong Kong Observatory<br />
4.38‘ÑìþƒÕá/0I (2002 l)12<br />
3'()—˜<br />
Fig. 4.40 Distribution of automatic weather<br />
stations and anemometer stations in 2003. Courtesy<br />
Hong Kong Observatory<br />
4.40‘2003 lu3Õá/0I_°»I8<br />
¯ 123'()—˜<br />
303
automatic weather stations are transmitted in real time to the Observatory<br />
headquarters via telephone lines or UHF radio links. These facilities are precious<br />
resources to the Observatory’s efforts in making weather forecasts for this region.<br />
Today, most people rely upon the morning weather forecasts when<br />
making plans for the day. The accessibility of the most vital weather data has<br />
risen dramatically. Weather reports are no longer boring sets of figures; they<br />
provide information closely related to daily living. In both its reporting and in<br />
the manner it responds to public enquiries, the Observatory has endeavoured<br />
to achieve speed, convenience and clarity for the public. Modern technology<br />
has continuously upgraded the accuracy and widened the scope of weather<br />
forecasts, and has extended their range from 24 hours ahead, to the mediumrange<br />
three- and five-day forecasts. The geographical coverage has also extended<br />
beyond Hong Kong to all the major cities of the world. The twenty-firstcentury<br />
world is well connected by efficient transportation and information<br />
technology, and Hong Kong has benefited from the globalisation of<br />
meteorological information.<br />
Hš›dœ<br />
žŸš›<br />
1884l'()!e:6MFl&ÏïX'!iÇFä¯.Õ†kòþ^_M/8<br />
/0ðÔ&P|^3Ž`aÍ»ƒœbÖ[Î& 192 Gg1886l¯°/8/0<br />
Mt«& ¬['()gÖnO (T6.M^Ÿë) ’Šÿ!& 193 1888 l'()<br />
p‹ÌbÖbcH2ŽMÍ»xO1 194 1890lØ&no56°±M1E&c<br />
%äv…†rj@^MÍ»ðÔ& 195 '()cÏïHŽMÖ×g\X*>$ò<br />
E>$Fù&X'ôçùÎiƒœ&qræ+no1…†Í»NMË°kld<br />
0`Õ&;ìFM-ì1 203 {gÊù<br />
±î}~&23! 1917 lÅZÉ0$ä…MÍ»ÎhƒœÑ=,f&_ƒœÛ<br />
H&p#9[ 1 g 7 烃œ•[»¼¼º& 1 œ»ÛʳÂÎ{ƒœ&„ 2 ¤<br />
3 ¤ 4 ¤ 5 œÐ[Í»©ªMs_{& 6 œ»ÛÐ[»¼÷÷»¡º&dÃ|<br />
6.M8œ»Û&„7œ!Ð[»¼÷|»¡º&dÃ|6.M10œ»Û1 €<br />
23'()ô®} j@^x£AHÌ´Ö,~M»yƒœ-ì&/ÛPa.j<br />
@^†~¯a{& 204 ŠÊù=ᦠe¥F>Í»ÎhƒœuAÍ»Îhƒ<br />
œM½1<br />
!<br />
"<br />
#<br />
$<br />
%<br />
&<br />
305
1917 different warning signal systems were adopted for local and non-local<br />
tropical cyclones. 197 The two systems co-existed until their abolition at the<br />
end of the 1950s.<br />
In 1884, the typhoon signal balls were made of canvas, but were soon<br />
replaced by those made of rattan. 198 Between 1884 and 1891, the signal balls<br />
came in the shapes of drum, upturned triangle, circle and triangle; to represent<br />
gusts from east, south, west and north. From 1891 onwards, the wind strength<br />
could be identified by colour: a red signal meant that the typhoon was over 300<br />
miles from Hong Kong, whereas a black signal would indicate that the typhoon<br />
was within 300 miles of Hong Kong. In the same year, the Observatory also<br />
hoisted three red and white lights to make known the typhoon conditions. 199 In<br />
1903, the Hong Kong government followed the practice of Shanghai and had<br />
a typhoon signal flag hoisted on Signal Hill. 200 This practice was abandoned in<br />
1906 due to practical difficulties. 201 In 1904, to better illustrate the wind<br />
direction, the Observatory combined the four signals and used them in pairs.<br />
For example, when the drum (indicating winds from the east) and the upturned<br />
triangle (indicating winds from the south) were hoisted together, it meant<br />
that winds were coming in from a southeasterly direction. This gave rise to<br />
the warning signal system that classifies winds as coming in from the direction<br />
of southeast, northeast, southwest or northwest. In 1911, the Observatory<br />
measured the maximum speed of gusts and storm force winds for the first time<br />
and provided more accurate information on typhoons. 202<br />
Modernisation of the City<br />
306<br />
In May 1913, several countries in the Far East held a meteorological<br />
conference in Tokyo to discuss meteorological matters and proposed to unify<br />
the typhoon warning system. Unfortunately, consensus was not reached and a<br />
unified system could not be formulated. 203 Influenced by that meeting, the<br />
Observatory attempted to reform its existing warning signal system in 1917.<br />
Apart from the signal balls, numbered signals from 1 to 7 were added to<br />
indicate wind strength. The No. 1 signal was a stand-by warning signal. Signal<br />
Nos. 2, 3, 4 and 5 signified gale force winds expected from the four quadrants.<br />
The No. 6 signal indicated gale or storm force winds and was equivalent to<br />
the No. 9 signal introduced later. The No. 7 signal represented hurricane<br />
force winds, and was later amended to signal No. 10. Although the Observatory<br />
had actively persuaded other countries in the South China Sea region to adopt<br />
the reformed system, it was not adopted by the Chinese Maritime Customs. 204<br />
This reform exercise, however, prompted the adoption of a new typhoon<br />
warning system and gave rise to Hong Kong’s tropical cyclone warning signals.<br />
Fig. 4.41 The signal station on Victoria Peak,<br />
1,825 ft above sea level, in the early twentieth<br />
century. Different flag signs were employed to<br />
indicate weather conditions. Courtesy Hong Kong<br />
SAR Public Records Office<br />
4.41‘J›T³³^5 1825 [Mw@!Ñ<br />
œI10$'()s_›œ«'/%V12<br />
3FG=nH'~—˜HHI<br />
!<br />
"<br />
#<br />
$<br />
%<br />
&<br />
307
Since 1917, Hong Kong had actively promoted the reformed warning signal<br />
system and released detailed reports on the movements of typhoons near Hong<br />
Kong. On the other hand, Hong Kong also used the typhoon warning system<br />
used by other regions in the South China Sea to accede to the request of the Hong<br />
Kong General Chamber of Commerce. 205 Thus, from 1917 onwards, two systems<br />
of warning signals were used concurrently: one was for local tropical cyclones and<br />
the other for non-local ones. 206 When a tropical cyclone was outside Hong Kong’s<br />
warning zone, only non-local warning signals were hoisted. 207 Once it entered<br />
Hong Kong’s warning zone, both local and non-local warning signals would be<br />
issued. To avoid confusion, different warning signal shapes and hoisting places<br />
were used. The Harbour Master’s Office, Hong Kong and Kowloon Wharf and<br />
Godown Co.’s Pier and Signal Hill were the main bases for hoisting non-local<br />
warning signals; while local signals were hoisted principally at the Observatory<br />
headquarters in Tsim Sha Tsui. 208 From 1934 onwards, the local signals were<br />
raised at different places according to the time of day. They were hoisted both day<br />
and night at the Observatory headquarters, the Harbour Department, Tamar, Lei<br />
Yue Mun, Gough Hill Police Station and La Salle College on Prince Edward<br />
Road in Kowloon. Places where signals were hoisted only in daytime were Green<br />
Island, Hong Kong and Kowloon Wharf and Godown Co., Lai Chi Kok, the<br />
roof of No. 49 Godown and Tai Po. At night, these signals appeared only on the<br />
clock tower of the Kowloon-Canton Railway Tsim Sha Tsui terminus. 209 Typhoon<br />
warning signals were also hoisted at some out-stations such as Min Chau, Waglan<br />
Island, Stanley, Chai Wan, Aberdeen, Sai Kung, Sha Tau Kok and Tai Po. 210<br />
1917l6&23'()ô®I`Ö>ˆcM»yÎhƒœ&óÓiy2<br />
3çŽMÍ»á1Š¥F{®&5623~º±M1E& 205 u3_$Ì´rj<br />
@^x£AHMÍ»Îhƒœ&|Ê1917lØ&uAgöuAÍ»Îihƒœ!<br />
23P=Ì´1 206 0Í»!u3“Î{klH&u3R±`aöuAƒœú 207<br />
0Í»-ìM[»ƒœÛMªN_`aAo…Es_½öuAÍ»Î<br />
hƒœ¬ÖnO¤¾‘$eDL_Ñœ!.²1ä¯ðÔåA&uAÍ»Îh<br />
ƒœ!ÐÑÒ'()~7.²1 208 1934 l6uAÍ»ÎhƒœM`aA<br />
&"Àg‚À`aƒœMAs_ž"‚Ào`aÍ»ƒœMA.'()~<br />
7¤Ön…¤’þ)¤ƒÚ¸¤ÙÚ!΅ᾑw:M„Ñ•ÝúR!"À`<br />
aMA!;
Since the Observatory began to use wireless telegraphy towards the end<br />
of the 1910s to broadcast typhoon news, the numbered signal system grew in<br />
importance. Through the simple numbered system the public could readily<br />
understand the latest tropical cyclone situation. In 1934, the Observatory<br />
abolished signal Nos. 2, 3 and 4 and added Nos. 8, 9 and 10. The No. 1 signal<br />
remained as the stand-by signal, whereas Nos. 5 to 8 signified gale winds from<br />
the four quadrants. The No. 9 signal represented gale to storm force winds<br />
that were increasing or expected to increase in strength, while signal No. 10<br />
indicated that hurricane force winds were blowing or expected. 214 This warning<br />
signal system largely laid the foundation for the present day tropical cyclone<br />
warning system. The No. 3 strong wind signal was added in 1956 to the<br />
existing signals. To deal with the misconception held by the public that wind<br />
strength increased with the change in signal number from 5 to 8, the Nos. 5<br />
to 8 signals were replaced by signal No. 8 NW (winds blowing from the<br />
northwesterly direction), No. 8 SW (southwesterly direction), No. 8 NE<br />
(northeasterly direction) and No. 8 SE (southeasterly direction). Such a system<br />
has been in use ever since (see Table 4.8 for the evolution of tropical cyclone<br />
warning signals). 215<br />
Before the 1960s, the warning signals issued by the Observatory were<br />
concerned mostly with destructive tropical cyclones. In the early twentieth<br />
century, the precautionary measures promoted by the government largely<br />
centred on assisting fishermen to move their fishing boats to the typhoon<br />
shelters during the passage of the tropical cyclone. The typhoon measures<br />
adopted after the 1960s also dealt with the safety issue of the general public,<br />
apart from the usual threats faced by the fishermen. When dealing with popular<br />
issues such as public transport services, guides on school attendance and work<br />
arrangements, the emphasis is placed on safety. The aim is to reduce accidents<br />
induced by sudden changes in meteorological conditions.<br />
· 1884 1907 lM ¤ 1907 1937 lM ’¤ 1910 lÖ×ÏïÌ´M<br />
ÍÎÏ`'¤ 213 DLZ–MÐh&_iÇMiy&°ÊuA§ê§QÍ»ðÔ<br />
M²1E®&'()E`aMƒœÛîÑ^„a.23—ê`Õ†xÌ´1<br />
Õ1910lÖ×'()Ì´ÍÎÏ`'-ìi»6&çƒÎiƒœcQm.<br />
mX1ú5MNàìMçƒûœ ê žßòMÍ»Má1 1934 l'()}<br />
Í»ÎiƒœM 2 ¤ 3 ¤ 4 œ¸ð&,´ 8 ¤ 9 ¤ 10 œ&xj 1 œÊhZÎ{ƒ<br />
œ„5œ8œ.Í»»%[ƒœ&9œ!ÖÐÍ»#¹&10œÖЛ8¼˜<br />
MÍ»& 214 ÆñFcf„"Í»Îhƒœ-ìMåæ11956lÍ»Îhƒœ<br />
Û9 3 œ¼»ƒœ1 1973 l 1 m 1 ".,c ê. 5 8 œƒœçƒFMn<br />
Û&ÖЯ»¼sânÛ)·L&0}}58œƒœ,.8œ"á¤8œ"r¤<br />
8œéá_8œérMÎhƒœ&)>ÎhƒœFG³´„ (…†Í»Îhƒœ<br />
Msc/]’{Ð 4.8)1 215<br />
1960lÖ›&'()Eg\…†@/ÄMÎiÑœ&ȸ¼ýÆM<br />
Í».uú!J›T³³nogÖM6c01&²1ÊäèÁé|Í»ª3%À<br />
„g0»M3$1 1960 lÖ6MÍ»6c01&_^¤gÅ{»Âš›MÁê<br />
H&Q¼_²ÔÆ‹Mnoøù&FG{ ê†xM01J'ô‰ÐOP¤FD<br />
_FØM%«&°€X'ô'ÏàáMno&¦M!\z/ÄÇ€c‡E«ØM<br />
1H1<br />
Modernisation of the City<br />
!<br />
"<br />
#<br />
$<br />
%<br />
&<br />
310<br />
311
Table 4.8 Development of Hong Kong Storm Signal Code (1884–1973)<br />
1884<br />
1891<br />
1904<br />
1917<br />
1920 1<br />
1934<br />
Symbol Direction Symbol Direction Symbol Direction Signal Symbol Night Wind Signal Symbol Direction Signal Symbol Night<br />
Signal Speed &<br />
of Motion<br />
Direction<br />
E<br />
E<br />
E 1 Stand-by 1 Severe<br />
signal<br />
S<br />
S<br />
S<br />
2 N<br />
2 Severe<br />
Wind<br />
Signal Speed &<br />
Direction<br />
1 Stand-by<br />
signal<br />
1935 2<br />
Signal Symbol Night<br />
Wind<br />
Signal Speed &<br />
Direction<br />
1 Stand-by<br />
signal<br />
2 Strong<br />
wind with<br />
squalls SW<br />
1938<br />
Signal Symbol Night<br />
Signal<br />
1<br />
1938–1962<br />
1956<br />
Signal Symbol Signal Symbol Night<br />
Signal<br />
1<br />
2<br />
Wind<br />
Speed &<br />
Direction<br />
1 Stand-by signal.<br />
Centred within<br />
about 400<br />
nautical miles<br />
1973<br />
Signal Symbol Night<br />
Signal<br />
Wind<br />
Speed &<br />
Direction<br />
1 Stand-by<br />
signal<br />
W<br />
N<br />
W<br />
N<br />
W<br />
N<br />
3 S<br />
4 E<br />
3 Severe<br />
4 Severe<br />
3 Strong<br />
wind with<br />
squalls SE<br />
4 Typhoon<br />
dangerous<br />
3<br />
4<br />
3 Strong wind<br />
with a sustained<br />
speed of<br />
22–33 knots<br />
3 Strong wind<br />
E<br />
S<br />
W<br />
N<br />
SE<br />
NE<br />
SW<br />
NW<br />
5 W<br />
6 Gale<br />
expected<br />
7 Winds of<br />
hurricane<br />
force<br />
expected<br />
6 Intensity<br />
unknown<br />
7 Intensity<br />
unknown<br />
8 Intensity<br />
unknown<br />
9 Intensity<br />
unknown<br />
5 NW<br />
6 SW<br />
7 NE<br />
8 SE<br />
9 Gale<br />
expected<br />
to increase<br />
5 NW<br />
6 SW<br />
7 NE<br />
8 SE<br />
9 Gale<br />
expected<br />
to increase<br />
5<br />
6<br />
7<br />
8<br />
9<br />
5<br />
6<br />
7<br />
8<br />
9<br />
5 NW storm with<br />
a sustained speed<br />
of 34 knots<br />
(63 km/h)<br />
or above<br />
6 SW storm with<br />
sustained wind<br />
speed of<br />
34 knots<br />
(63 km/h)<br />
or above<br />
7 NE storm with<br />
a sustained<br />
wind speed of<br />
34 knots<br />
(63 km/h)<br />
or above<br />
8 SE storm with a<br />
sustained wind<br />
speed of<br />
34 knots<br />
(63 km/h)<br />
or above<br />
9 Increasing gale<br />
or storm<br />
8 NW gale or<br />
NW<br />
storm with a<br />
sustained speed<br />
NW of 34–63 knots<br />
(63–117 km/h)<br />
8 SW gale or<br />
SW<br />
storm with a<br />
sustained wind<br />
SW<br />
speed of<br />
34–63 knots<br />
(63–117 km/h)<br />
8 NE gale or<br />
NE<br />
storm with a<br />
sustained wind<br />
NE<br />
speed of<br />
34–63 knots<br />
(63–117 km/h)<br />
8 SE gale or<br />
SE<br />
storm with<br />
sustained wind<br />
SE<br />
speed of<br />
34–63 knots<br />
(63–117km/h)<br />
9 Increasing gale<br />
or storm<br />
Modernisation of the City<br />
312<br />
Notes:<br />
Red signals indicate a distance exceeding 300 miles, and black signals a distance less than 300 miles.<br />
Non-local signals are presented with pink background, while the local signals are presented with light yellow background.<br />
1<br />
Royal Observatory, Hong Kong Storm Signals, Hong Kong Prison, Stanley, 1938.<br />
2<br />
This local storm signal system came into force on 28 February 1935 but the No. 4 Signal was seldom used in Hong Kong.<br />
10 Wind of<br />
typhoon<br />
force<br />
expected<br />
10 Wind of<br />
typhoon<br />
force<br />
expected<br />
10<br />
0<br />
10 Hurricane<br />
force with<br />
sustained<br />
speed reaching<br />
over 64 knots<br />
(118 km/h)<br />
Sources:<br />
Hong Kong Government, Hong Kong Administrative Reports 1917, Appendix F, F7–8; Wah Kiu Yat Po, 29 May<br />
1966.<br />
Huazi ribao, 1 January 1904.<br />
Royal Observatory Hong Kong, File No. 23, Meteorological Messages and Storm Warnings (1916–1933); Royal<br />
Observatory Hong Kong, Hong Kong Storm Signals, Hong Kong Prison, Stanley, 1938, p. 2.<br />
Royal Observatory, Hong Kong, Hong Kong Observatory Director’s Report 1891, Hong Kong, Government Printer,<br />
p. 1.<br />
Royal Observatory Hong Kong, Hong Kong Storm Signals, Hong Kong Prison, Stanley, 1938, p. 1.<br />
Sing Tao Daily, 2 September 1962; Wah Kiu Yat Po, 29 May 1966.<br />
Wah Kiu Yat Po, 16 March 1973.<br />
10 Hurricane force<br />
with sustained<br />
speed reaching<br />
over 64 knots<br />
(118 km/h) and<br />
gust exceeding<br />
120 knots<br />
(220 km/h)<br />
!<br />
"<br />
#<br />
$<br />
%<br />
&<br />
313
% 4.8‘23Í»ÎhÑœMsc (1884–1973 l)<br />
1884<br />
1891<br />
1904<br />
1917<br />
1920 1<br />
1934<br />
1935 2<br />
1938<br />
1938–1962<br />
1956<br />
1973<br />
Ñœ »<br />
Û<br />
Ñœ »<br />
Û<br />
Ñœ »<br />
Û<br />
dœ Ñœ ‚À »Ÿ<br />
Û Ñœ »<br />
dœ<br />
Ñœ Í»ˆ<br />
Û áxO<br />
dœ Ñœ ‚À »Ÿ<br />
Û Ñœ »<br />
dœ Ñœ ‚À »Ÿ<br />
Û Ñœ »<br />
dœ Ñœ ‚À<br />
Û Ñœ<br />
dœ<br />
ќ<br />
Û<br />
dœ Ñœ ‚À »Ÿ<br />
Û Ñœ »<br />
dœ Ñœ ‚À »Ÿ<br />
Û Ñœ »<br />
é»<br />
é»<br />
é»<br />
1 hÎ<br />
ќ<br />
1 ʜ<br />
1 hÎ<br />
ќ<br />
1 hÎ<br />
ќ<br />
1<br />
1<br />
1 hÎÑœ<br />
Other Warnings for Severe Weather<br />
¡¢£uL¤š›<br />
Modernisation of the City<br />
The government gradually realised that the priority placed on the tropical<br />
cyclone warning system, which was only relevant during the typhoon season,<br />
failed to raise the community’s awareness over severe weather. To help the<br />
public to be better prepared for changing weather, warnings for severe weather<br />
were introduced. This started with the introduction of the thunderstorm and<br />
heavy rain warnings in 1967, followed by the landslip warning for emergency<br />
organizations in 1977, and then the flood warning and the landslip warning<br />
for the public in 1983. The heavy rain warning introduced in 1967 was<br />
exclusively for the use by government departments and was issued when the<br />
hourly rainfall exceeded 50 mm. It sought to enhance the capability of<br />
government departments to take preventive measures against natural disasters<br />
and was not disseminated to the public. The principal reason was that rainfall<br />
amount could vary significantly between regions and issuing such a warning<br />
might cause undue inconvenience to those areas not affected by heavy rain.<br />
Since the introduction of the fire danger warning system in 1972 to<br />
show the degree of dryness of the atmosphere by means of different coloured<br />
warnings, the warning systems have become more refined. The original colourcoded<br />
amber and red landslip warning signals introduced in 1977 to alert<br />
various emergency organizations was simplified in 1983 to a single warning<br />
serving all sectors of the community. The heavy rain warning in 1967 was also<br />
modified in 1992 to a rainstorm warning system with green, amber, red and<br />
black signals to warn the different degrees of severity of rainstorms. These<br />
precautionary measures augmented the degree of preparedness against the<br />
destruction triggered by severe weather conditions. In 1999, the cold weather<br />
warning was introduced to give early warnings to people suffering from<br />
respiratory diseases, the very young and the elderly, while the very hot weather<br />
warning advised the public to be protected from the possibility of heatstroke.<br />
These highly effective early warning measures and weather reports have<br />
gradually become important guidelines for the public in their daily lives (see<br />
Table 4.9 for the evolution of warning symbols for severe weather).<br />
no„…ämR€X|Í»òóMÎi-ì&a¾ og± ê!@'/ÄM<br />
θ´1.©ª ê!'/c‡$M6c{î&'()g8F-ÕM@'/Î<br />
i-ì1 1967 l;y_yÂÎhƒœÊlÍ»Îhƒœ6&ÅZ»1M@'<br />
/h΃œ11977lÛ#fRäv¢6V‚M!R]^Îh&€61983l«<br />
f'Ïä¯MyÎhƒœá!R]^Îhƒœ1yÂÎhƒœÅ³ÊX><br />
$Áµ]| 50 £;$ä8M&ë\no7¸Ž7Ì´&g±no7¸aÕ<br />
€# Mh\t«¾¼&„s'Ïäi&Ų1'5ÊÁµ!s_H2/¾±<br />
…d0ÆM–—&FG'Ïä¯MhÎ01/¾±«ØJ…ÄÂH2Ms|1<br />
Õ1972lË´s_âtS#ÁÛÎhÑœ•[`/MÍS¡º6&'()<br />
„Âs_ât•[Õ€# MÁÛ¡º&Îiƒœ-줤cQp Ó11977<br />
lRg\¢6V‚MŽt_Ût!R]^Îi-ì&! 1983 lW+à‡á'<br />
Ïäiú1967lMyÂÎhQs
Table 4.9<br />
Evolution of Warning Symbols for Severe Weather<br />
Warning Type Year Warning Warning Description<br />
Icon Name<br />
Thunderstorm Apr Thunderstorm Rainstorms and thunderstorms are expected<br />
1967 Warning within six hours.<br />
1997 Thunderstorm Thunderstorms expected within four hours.<br />
Warning<br />
% 4.9 @'/ÎhƒœMsc<br />
¤¥ &' ¤¥ ¤š›z¦ §¨<br />
›©ª ›«¬<br />
;y 1967 l ;yÎh 6 >$Ž±ä½yÂò;y1<br />
4 m<br />
1997 l ;yÎh a. 4 >$Ž±ä½;y1<br />
Rainstorm Apr Rainstorm More than 50 mm (2 in) of rainfall recorded<br />
1967 Warning Signal during the past hour.<br />
1992 Green Rainstorm Significant amount rainfall is forecast within<br />
Signal the next 12 hours.<br />
Yellow More than 50 mm of rainfall is forecast in<br />
Rainstorm Signal the Hong Kong region within six hours.<br />
Red Rainstorm Rainstorm has commenced and within the<br />
Signal last hour or less, more than 50 mm of rainfall<br />
has fallen over a wide area.<br />
Black Rainstorm More than 100 mm of rainfall has fallen<br />
Signal within the past two hours or less.<br />
Mar Yellow Heavy rain has fallen or is expected to fall,<br />
1998 Rainstorm exceeding 30 mm in an hour. The heavy rain<br />
Warning may lead to the red or black warning symbol.<br />
Red Rainstorm Heavy rain has fallen or is expected to fall,<br />
Warning exceeding 50 mm in an hour. The heavy<br />
rain may lead to the black warning symbol.<br />
Black Rainstorm Very heavy rain has fallen or is expected to<br />
Warning fall, exceeding 70 mm in an hour, and is<br />
likely to continue.<br />
Flood 1971 Shing Mun The Shing Mun Reservoir or the Lower<br />
Reservoir Shing Mun Reservoir water level has exceeded<br />
Flood Warning the security line and may lead to overflowing.<br />
1983 Flooding The issuance criterion is based on rainfall<br />
Warning amount.<br />
Mar Special Issued whenever heavy rain affects the area<br />
1998 Announcement and flooding is expected to occur or is<br />
on Flooding in occurring in the low-lying plains of the<br />
the Northern NT northern New Territories.<br />
Landslip Apr Yellow Landslip –<br />
1977 Warning<br />
Red Landslip –<br />
Warning<br />
1983 Landslip Warning –<br />
y 1967 l yÂÎhƒœ Ð[NÄ 1 >$ŽQN 50 £; (2 }) MÂ<br />
4 m µ1<br />
1992 l ¥ty h°a. 12 >$Ž/¾…•¯Mµ1<br />
Îhƒœ<br />
Žty hï!a. 6 >$Ž&23玱…N 50 £<br />
Îhƒœ ;Mµ1<br />
Ûty Ð[yÂWÜÏï&!NÄF>$òp‚M$À<br />
Îhƒœ Ž&23`ÕAHQN 50 £;µ1<br />
pty !NÄM=>$òp‚$ÀŽ&23çŽ<br />
Îhƒœ N 100 £;µ1<br />
1998 l Žty Ð[23`ÕAHWQòhï±…X>$QÂ<br />
3 m Îhƒœ µN 30 £;MÆÂ1ÆÂ}/¾$N<br />
Îhƒœ 50 £;MÆÂ&Â7/¾I‹1<br />
pty Ð[23`ÕAHWQòhï±…X>$µ<br />
Îhƒœ N 70 £;M¯Â&Â7/¾I‹1<br />
y 1971 l Ž¸a Ž¸aòŽ¸Äacµ*ÎUÎ&/¾y<br />
yÎh Pa°±1<br />
1983 l yÎh ä8eÎhMW!ÊèéÁµ]z1<br />
1998 l pUá7 0pUá7Œ²A8{gÆÂ}~Phï±8m<br />
3 m yFGih y1<br />
!R 1977 l Žt!R –<br />
]^ 4 m ]^Îh<br />
Ût!R –<br />
]^Îh<br />
1983 l !R]^Îh –<br />
Modernisation of the City<br />
318<br />
1998 Landslip Warning Apart from the rainfall rate of the day,<br />
reference is made to the rainfall amount and<br />
conditions of the previous 15 days. When<br />
Hong Kong comes under heavy rain and<br />
more rainfall is expected within the next few<br />
hours, the Observatory will consult the<br />
Geotechnical Engineering Office and issue a<br />
landslip warning if they consider that landslips<br />
are likely to occur as a result.<br />
Strong Monsoon 1947 Strong Monsoon Mainly issued in winter when strong<br />
Signal monsoons are blowing. During 1954–55, this<br />
service was suspended as the Chinese<br />
government stopped providing Hong Kong<br />
with meteorological information.<br />
1998 l !R]^Îh _èé0"ÁÂÿH&P]^NÄ 15 "£§MÂ<br />
µ_ÄÂxO10u3{ÆÂ}~Phïa.ç><br />
$¬€…ÆÂ&23'()g—¼t¡ëºî6<br />
ú./¾ä½!R]^&±ä85Æ«P!R]<br />
^MÎh1<br />
¼÷ 1947 l ¼÷òÄ» ²1ʳò8m¼÷òÄ»$`a&1954–55l*<br />
òÄ» ƒœ 5j@Øvg\23/0îï„´v1<br />
1997 l ¼÷òÄ» 023 {¼÷òÄ»}~òhïa. 12 >$Ž<br />
ƒœ 3Žá³¬^2}±©¼÷òÄ»ƒœ&»ŸWÜ<br />
ò}±NX>$ 40 '³1!›8`µMA›8<br />
`µMA{&òÄ»M»Ÿ/¾NX>$ 70 '<br />
³1eLÎhs(´|[/8/0«ØM¼»1<br />
híéáòÄ»¼˜&¦1_ÍS&}ˆepU`<br />
µAHƾu«%{¹Â1<br />
!<br />
"<br />
#<br />
$<br />
%<br />
&<br />
319
Strong Monsoon 1997 Strong Monsoon Issued when strong monsoon winds are<br />
(cont.) Signal blowing or expected within the next 12 hours<br />
with wind speed in excess of or are expected<br />
to exceed 40 km/h. In very exposed places,<br />
monsoon winds may exceed 70 km/h. This<br />
warning is not issued when tropical cyclone<br />
signals are in force.<br />
The strong, cold and dry northeasterly<br />
monsoon may cause damage to crops in<br />
exposed regions in the New Territories.<br />
Fire 1968 Hill Fire The dry weather is prone to the outbreak of<br />
Warning Signal hill fires. This warning signal was only used<br />
during holidays.<br />
Oct Yellow Fire When the atmospheric relative humidity<br />
1972 Danger Warning drops to a certain level the vegetation dries<br />
out and poses a fire risk. This warning is issued<br />
when the fire risk is high.<br />
Red Fire This warning is issued when the fire risk is<br />
Danger Warning extreme.<br />
Frost Nov Frost Warning This warning is issued whenever ground frost<br />
1968 Signal is expected to occur on high ground or inland<br />
in the New Territories.<br />
Cold weather 1999 Cold Weather It is expected that Hong Kong will come<br />
Warning under the influence of cold weather.<br />
Very hot weather 1999 Very Hot It is expected that the weather will be very<br />
Weather Warning hot and sunny.<br />
Sources:<br />
HKSAR Government Home Affairs Department website, .<br />
Hong Kong Observatory, Hong Kong Annual Departmental Report by the Director, Royal Observatory, for the financial<br />
years 1954–55, 1966–67, 1968–69, 1970–71, 1972–73, 1977–78, 1999–2000, Hong Kong, Government<br />
Printer, 1955, 1967, 1969, 1971, 1973, 1978, 2000.<br />
Hong Kong Observatory pamphlets: ‘Rainstorm Warnings’, July 1997; ‘Strong Monsoon Signal’, February<br />
2002; ‘North New Territories Flood Warnings’, May 1998; ‘Landslide Warnings’, May 1998; ‘Fire Warnings’,<br />
‘Cold Weather Warnings and Very Hot Weather Warnings’.<br />
Hong Kong Observatory weather website, .<br />
Ming Pao, 9 February 1972; 18 June 1983.<br />
Sing Tao Daily, 9 December 1969.<br />
Tai Kung Pao, 21 June 1993; 28 July 1994.<br />
Tsing Ma Management website, .<br />
Wen Wei Po, 17 April 1998.<br />
S# 1968 l !SÎhƒœ Ð['/ÍSžßä½!S&eÎhƒœR!·%<br />
ä¯1<br />
1972 l ŽtS# 0Æ/Mda¹ºÄÁ¸hº„[¹ÍS&ɱ<br />
10 m ÁÛÎh ä8S#ÁÛÎh1ŽtS#ÁÛÎhÐ[S#Á<br />
Û´
meet the challenge of nature is a reflection of the pace of social development<br />
in the late nineteenth and early twentieth centuries.<br />
According to the review made in Chapter 2 on natural disasters from the<br />
late nineteenth century to early twenty-first century, the most destructive<br />
episodes were the typhoons of 1874, 1906, 1937 and 1962, the drought in<br />
1963 and the rainstorms in 1972. By sheer coincidence, the natural disasters<br />
that struck before the 1960s took place once every 30 or so years, and typhoons<br />
tended to wreak the most havoc.<br />
$±²³<br />
uËFœ]T³.MÕ€#Â&ämÙl¹ºMxO&›¾T³×J›T³<br />
³Å.ÊX1ìí 1874 l¤ 1906 lá 1937 lM»A¹ºçƒÅ]&[|À<br />
].>áMFÙÚ&idz»‚^_»O1’¯°±Mäå&'#j¹º<br />
çƒQ…„…\zM 71+à.R6¹ºÅÊXM1962l·%»#_1972l<br />
EF !R]^& €ºÙç]÷çÄ&{¹À…ç)&Š‹ý 1906 l_<br />
1937 lM»#.z1noMÆ#n M,c&ʹºÙç\zM²51<br />
Priceless Life<br />
Looking at the natural disasters in the past century or so, one discovers that<br />
the last years of the nineteenth century and the early years of the twentieth<br />
century had the highest human casualty numbers. The casualties of the 1874,<br />
1906 and 1937 disasters were probably higher than the official figures, as most<br />
of the casualties were fisherfolk and the newspaper reports failed to include<br />
the migrant population in the death toll. As society developed, the casualty<br />
figures from natural disasters went on a downward trend. The two most<br />
destructive natural disasters after the war were inflicted by Typhoon Wanda<br />
in 1962 and the landslides on 18 June 1972, with hundreds of deaths and<br />
thousands of people injured. However, these figures pale when compared to<br />
the casualties of the 1906 and 1937 typhoon disasters. Changes in government<br />
disaster relief policies have contributed significantly to reduced casualties.<br />
Õ›¾T³j%J›T³j%MµµFœT³&noëð#‚MÁV6c<br />
01&€X#6MÊ6t«&z«h\Wï&„Ê6M01)/8.Æ/_ÇÝ<br />
=78&Æ/t«[no]œ7¸ä¼Èf&„#6MÇÝ!²1[.Õs_É<br />
ÊMêÀ‡7g\./1<br />
µ7. &1930lÖ›MÆ/t«&no7¸²1Î¥.²¼&x£<br />
M³æ7¥Rrs./M5tú! 1960 lÖëvÆ/¥Ëe:›&Æ#RÊ<br />
0wÎsMi$wP1 216 „Æ/OPM´QQ56Xù#‚M£E„,c1·Ì<br />
From the mid-nineteenth to mid-twentieth centuries, the government<br />
had placed emphasis on rehabilitation work in the wake of natural disasters<br />
instead of taking preventive measures. The rehabilitation measures had two<br />
aspects — rescue and relief. Rescue work was carried out by various<br />
government departments, with the relief work largely assumed by nongovernment<br />
bodies of different backgrounds.<br />
Modernisation of the City<br />
322<br />
In general, the pre-1930s official rescue efforts were mainly the domain<br />
of the police, with the other disciplined services playing supporting roles.<br />
Before the setting up of professional rescue teams in the 1960s, disaster rescue<br />
work was only a temporary work assignment for the police. 216 The nature of<br />
the work changed according to the specific needs of each incident: from<br />
rescuing victims, to recovering victims’ bodies, giving assistance to victims’<br />
families on burial arrangements, and rebuilding homes. 217 The government<br />
had not set up specific departments to handle disasters, so the services rendered<br />
were rather restricted. The government had adopted a passive attitude mainly<br />
Fig. 4.43 Temporary shelters were severely<br />
overcrowded during Typhoon Carmen’s onslaught<br />
in 1974. Courtesy Hong Kong Museum of History<br />
4.43‘1974 lÍ»ñ¸ª3&i$Í
ecause it believed that natural disasters were unpreventable and that human<br />
efforts could never overcome nature. This was well illustrated by the incident<br />
on 30 August 1923 when Legislative Councillor H. E. Pollock proposed at a<br />
Legislative Council meeting for the establishment of rescue facilities at Victoria<br />
Harbour during typhoons to rescue ships in distress. This suggestion was roundly<br />
rejected by the then Acting Colonial Secretary, A. G. M. Fletcher, as being<br />
unfeasible. His citation of the typhoon onslaught in 1906 which the government<br />
was only able to render scant assistance, demonstrated clearly the passive stance<br />
of the government. 218 The Harbour Master’s Department even levied charges<br />
for towing services during typhoons. The towing fees were determined by<br />
wind strength and different charge categories were devised in accordance with<br />
the hoisting of the red wind warning, the black wind warning and the black<br />
Æö‚À¤„ö‚ÀMÒ7&gäèöŸÀ]9Îð6Ÿ¤XY]•& 217 Æ/<br />
t«pqkld0`Õ_CÓ&no0}¦J…56CÓMt«&9:ë!7<br />
¸&/÷„òEg\MOPÊ…FcMhCM1noaÆ/t«Ô¸+áº&<br />
²1Ê5.no¬ú.'#Ês/h\&_ÙÊÍîRÕÆÕ€MúÄŸl|<br />
ÊFœ”ɽ1923 l 8 m 30 "cl} (m:î±) ±îjîs²* (H. E.<br />
Pollock) ”EÍ»%À!H]Ëv39“^3Æ/01&ÌÆö‚Ö×&.0$<br />
MÖßnÆý¼¹ (A. G. M. Fletcher) ¼%s/=&P/«1906lÍ»MxO<br />
.l&ÈÉ»Â%Àno0}‚Ö8/Š&/ì¿no®a'#Ô+áM×<br />
î1 218 noÖn…|Í»%Àg\MØÖOP£ÙÓØ8ý&ÓýFðR »¼<br />
Modernisation of the City<br />
324<br />
Fig. 4.44 Typhoon victims looking helpless and<br />
forlorn after losing their homes (1964). Courtesy<br />
Hong Kong SAR Information Services Department<br />
4.44‘5Í»„Ð,]•M#ê&FÑ,V<br />
Íè (1964l)123FG=nHnopIë—<br />
˜<br />
Fig. 4.45 In the aftermath of Typhoon Wanda<br />
in 1962, the government distributed rice to the<br />
victims. The extent of poverty in the 1960s was<br />
such that spades and paper bags were used for<br />
distribution. Courtesy Hong Kong SAR<br />
Information Services Department<br />
4.45‘1962 l·%»#6&no#ê8<br />
ä;Ú1·0}´‰Û8Ú&#괂܃„<br />
;ÚMxÊ&/¿ 1960 lÖ:ÄÝM½àÞ<br />
é123FG=nHnopIë—˜<br />
!<br />
"<br />
#<br />
$<br />
%<br />
&<br />
325
cross wind warning. The higher the wind strength the higher the towing<br />
charge; the highest rate could cost as much as half the annual ship licence fees.<br />
219<br />
Ships that were in distress within the harbour and sought assistance were<br />
not regarded as emergency cases. This clearly shows that rescue work was<br />
neglected. Fortunately, the government still put considerable resources into<br />
rehabilitation work such as the repair of roads, piers, government structures<br />
and public facilities. The Public Works Department carried out comprehensive<br />
evaluation of the extent of damage after each major disaster. After the<br />
government had considered the financial implications, resources would be<br />
allocated for the reconstruction works. 220<br />
MÆ>8.*ý`aÛt»Û¤pt»Û_pt›ƒ»ÛÓýos_&»¼m<br />
ÆÓým±&ű/÷ÖÖ×mlMß ý& 219 3ÚMÖ×öŸ£äèàaÕ.<br />
ÁVÆ/&/¿ÌÆt«ï{–à1á„no¬±}î¡v!#‚MÊ6t«&<br />
JMí¤DL¤noY %Ã'ô91MXâ1Xù`ÆM#‚6MXYt<br />
«&[tP}Éu3MU¡º«o®Mëì&6ÜNno^¤OnNO&«â<br />
ÁMˆB1 220<br />
!J›T³j%›&ÇÝ#êMt«&²1[Å©-S¤êÀ‡7_ÅÙ<br />
‚Zy&ý{°±XàMêÀ-S;
a sum of HK$1,540,000 was allocated to build another typhoon shelter at the<br />
bay in front of Mong Kok Tsui (Yau Ma Tei), with an area of around 166<br />
acres. 225 The legislation to approve the construction was passed in 1909, 226 and<br />
the project was completed in August 1915. Known as the Yau Ma Tei Typhoon<br />
Shelter, it overran the budget by HK$649,000. 227 In 1953, the government<br />
needed to carry out reclamation works at the site occupied by the Causeway<br />
Bay Typhoon Shelter and the shelter was relocated to the northern part of the<br />
original site. 228<br />
On 2 September 1937, Hong Kong waters were again under the onslaught<br />
of a severe typhoon, with Cheung Chau the hardest hit area. This revealed<br />
the inadequacy of having just two typhoon shelters to protect fishermen. On<br />
the brink of the Sino-Japanese War, the government did not have either the<br />
time or resources to improve typhoon precautionary measures. Although the<br />
government had once considered the establishment of a typhoon shelter harbour<br />
at Cheung Sha Wan, Stonecutters Island or even the bay area of Kennedy<br />
Town, it was not until 1962 that Hong Kong had the third typhoon shelter<br />
— the Aberdeen Typhoon Shelter. The two earlier-built typhoon shelters<br />
were, however, the main places of refuge for fishing boats during the passage<br />
of typhoons before the 1960s. They were under the joint administration of<br />
the Marine Police and the Marine Department. 229 Large-scale construction of<br />
typhoon shelters only began in earnest in the early 1960s.<br />
!J›T³›m%&noEI=M¹Ì\#01&šY0»aÅÿ\#<br />
¾¼1X0»Â©ª&ÁÖ3Zâ0»aè0&ìN#‚123M˜Fœ0»a<br />
íî$0»a&|1883lYe&³Y$\×ïþ1,400[& 221 /žÌÖ×<br />
Uz& 222 Š¾|ð&noFGÍîÛY¥F0»3&U1ÀY'…Mí<br />
î$0»a2©gé‚XX11904l¤1906l&®acl}îsMQº&no<br />
¬a¾É"º±_îsaÀYíî$0»aMYî«v61 223 1906l9m18"<br />
MÍ»&©UMÁÖ]÷3,650]ñ&ò½Àa|1.5š& 224 Z¦Àk&ÀY0<br />
»aMøù&Qg`ÕC,11908l3m&noa{"º±|1904l7m16"<br />
MYî&#¢íî$0»a3$9[&ÀY6Míî$0»a®ô÷75&ó 1¥<br />
F{®&)í÷á´îô154š3S&|V5Ò (õ,A) aÏM3$&šY¥F<br />
œ®ô:… 166 &óM0»3& 225 1909 l Ž:îÐNšY& 226 t¡| 1915<br />
l8möt&õ,A0»aEá´MÜýý'Zí÷]f64.9š3S1 227 1953<br />
l&no£!'…Míî$0»a
In August 1960, the government set up a committee to investigate the<br />
typhoon shelters and the berthing situation, under the chairmanship of the<br />
Director of the Marine Department. Statistics provided by the Marine<br />
Department found that, in the year 1959–60, there were a total of 31,263<br />
registered fishermen households. But the 1960 census statistics showed only<br />
24,137 such households, while the 1961 figures were 21,292. It was thought<br />
that the census statistics excluded fisherman who had gone out to sea. The<br />
investigating committee pointed out that for a floating population of 31,263<br />
households, a shelter area of 611 acres would be required to berth the fishing<br />
boats during the passage of a typhoon. This figure did not include the fishing<br />
boats sailing in from China during the typhoon. Based on observations carried<br />
out during the passage of Typhoon Mary, the migrant boat population was<br />
about 18,868 households. It would have required another 397 acres of shelter<br />
space to accommodate these boats.<br />
With the above figures, the committee worked out that the required<br />
typhoon shelter space for Hong Kong should be based on the average of<br />
Hong Kong’s fishermen and migrant households. It estimated that in 1960<br />
Hong Kong needed approximately 504 acres of typhoon shelter space. The<br />
distribution should be: 109 acres for the western district, 350 acres for Victoria<br />
Harbour and the outlying islands, and 45 acres for the eastern district. The<br />
actual situation was: the western district had 42 acres, Victoria Harbour and<br />
the outlying islands had 180 acres, the eastern district had 45 acres; with a total<br />
space of only 267 acres — a shortfall of 237 acres. The shelter space was far<br />
too inadequate and it was estimated that 53% of the fishing boats were unable<br />
to find shelter during adverse weather.<br />
1937 l 9 m 2 "&23^®6Fù{Í»÷ø&xjþfMU¡ºÅ<br />
.ÊX&^_0$tcM=œ0»aPa¾ ¼Áê£E1[|j"Rn•ä!<br />
T&noJ…$À_î¡,Ê\»01& €no*^¤!þÑ$¤ùÖf&U<br />
ú^AŽM3$šY0»3&ŠFG1g 1962 l23ƒ|23 šY˜*œ<br />
0»a1íî$_õ,A=Æ0»a! 1960 lÖ›&Ê23ÁÖ²1M0»<br />
3&FG[Î_^Ÿëô_bð1 229 0»aMšY&1g1960lÖ³%ƒÆ<br />
¾¿Ïå1<br />
1960 l 8 m&no-e0»a_Ö×ØØNOˆ¹ðs±&[^Ÿëëþ<br />
8û²ü1Öˆ¹ðs±èé^Ÿëîïìí½195960lo3°jMÁê…<br />
31,263 é1Šèéno 1960 lMÙÚìí&ÊlÁêR… 24,137 é& 1961 l<br />
!…21,292é&ìíÖìíçƒPa;
educed to only 5,895. Urbanisation was a major factor behind the drastic<br />
fall in the floating population. 230<br />
Improved Living Conditions<br />
The capability to defend against natural disasters has grown in tandem with<br />
society’s economic progress, but the rapid population rise, especially the working<br />
population, has made the implementation of preventive measures increasingly<br />
difficult. The following statistics on people residing in cottage areas and<br />
temporary housing areas reveal clearly the seriousness of the situation. According<br />
to surveys made by the Census and Statistics Department and the Housing<br />
Department, the population in temporary housing areas has until recently<br />
been on an escalating trend since the 1950s. In 1954, approximately 46,000<br />
Hong Kong residents lived in cottage areas. That number rose to 88,000 in<br />
1961, with another 800,000 residing in temporary housing areas. By 1971,<br />
the cottage area population came to 56,000, with another 320,000 living in<br />
temporary housing areas, and 287,000 residing in squatters. This suggested a<br />
slightly downward trend; but it was not until the 1980s that significant<br />
reductions were observed. In 1996, the temporary housing population came<br />
down to 42,000, while the squatters housed another 236,000. 231 Those residing<br />
in substandard housing were the main victims of natural disasters. From the<br />
1950s to 1970s, the bulk of damage inflicted by natural disasters was due to<br />
collapsed houses. Improvements in living conditions had to be deferred until<br />
1980s when the government began its large-scale public housing estate<br />
construction programmes.<br />
&ó&ý6…M504&ózf237&ó&/¿0»a®ôþ>&ìí:…53%M<br />
ÁÖ!@'/ÄÍëžÿ15e&no£F{®BCÖ×ØØ0»aMxO&<br />
R!-u3ÁÖ_Ö×þ%ØØ|0»3Ž&„^Ÿëæ8ÙŠBC£”•Xl<br />
11š3S1noí÷|u3]HšYp]0»a&"!1970lÖ³&ÁéMç<br />
¦HIsc&!0»aMç¦/•#6´&„ÀY0»aý´:.XñÁÖ<br />
3,150 SòXœÁê 525 S1¥F{®&no.Õ†v$ÁÖF¬MÁéI=<br />
Zn“í÷&Xé£ý: 330 465 S1o3FÙÚçƒÕ 1960 lÖ.s<br />
âÄÁ& 1971 lo3FÙÚ· 1961 lM 136,802 Ù\ 79,894 Ù&\Y÷<br />
41.6 %ú2001lo3FÙÚR…5,895Ù& 230 Ž MäåÊFÙÚ\zM<br />
'5“F1<br />
Disaster Relief Measures<br />
Modernisation of the City<br />
332<br />
The 1950s could be seen as a watershed: government disaster relief work was<br />
shifting from passive to active mode, and from performing merely post-disaster<br />
rehabilitation work to undertaking precautionary measures. In line with Hong<br />
Kong's rapid economic development and population increase, the government<br />
had far more resources at its disposal. In response to social demands, it established<br />
specific departments responsible for disaster relief and rehabilitation work in<br />
order to mitigate the destructiveness of natural disasters. Consequently, the<br />
Social Welfare Department was established in 1958, to be responsible for<br />
rendering help to disaster victims. The General Chinese Charities Fund and<br />
the Chinese Temples Fund administered by the Social Welfare Department<br />
were the main donors towards disaster relief. In addition, civic associations<br />
Fig. 4.50 The Aberdeen Typhoon Shelter in<br />
1988 was very different from the one in the 1920s.<br />
Courtesy Hong Kong SAR Information Services<br />
Department<br />
4.50‘1988 lM23 0»aM®%g<br />
1920lÖM»…'t“G123FG=nHn<br />
opIë—˜<br />
!<br />
"<br />
#<br />
$<br />
%<br />
&<br />
333
that came under the supervision of the government, such as the Kai Fong<br />
welfare advancement associations and the New Territories rural committees,<br />
also made active contributions towards the relief efforts. 232 The involvement<br />
by other non-government bodies such as chambers of commerce, village<br />
associations and clanship associations in relief work was relatively reduced.<br />
The Social Welfare Department assumed the co-ordinating role in the<br />
distribution of food and clothing, and the arrangement of temporary shelters<br />
for the victims.<br />
x´µ·¸<br />
\¥'€#ÂM¾¼’¯°±ÜÝ· ,Êsâg±&Š!»1FQ’¯ÙÚM<br />
V¹Û#„cQm.mé‚&xj&áÙÚMsâÛ#Ì\#t«”ÂH'&<br />
Ä…†¹ˆH_i$(ˆÙÚMìíçé/ ”xOMÊœ¡º1èé23no<br />
ìíë_(ˆ…Mìí&§¨!i$(ˆM§êÕ 1950 lÖØ…sâF"M<br />
7& 1954 lo3:… 4.6 š§¨!¹ˆM§ê& 1961 lÛ 8.8 š&„§¨!<br />
i$(ˆÀ… 60 šÙ1 1971 l§¨!¹ˆHÀ… 5.6 š&i$(ˆÀ… 32 š<br />
Ù&)ˆ!… 28.7 šú €…–ˆÄÁ 7&Š1g 1980 lÖƒ…ý”•,<br />
Ê1 1996 lo3§¨!i$(ˆÀ… 4.2 š&§¨!)ˆÀ… 23.6 š1 231 ¨<br />
(· ý–M§êÊ'#M²1{ÂÀ&1950lÖ1970lÖ&'#EˆeM<br />
ȸcj!(ˆlX&„xO1g 1980 lÖnoƾ¿šY'ôˆ*ƒ…E,<br />
Ê1<br />
Modernisation of the City<br />
334<br />
Towards the end of the 1960s, the government set up emergency control<br />
centres to provide round-the-clock emergency rescue services. The<br />
participating government departments included the Hong Kong Observatory,<br />
Public Works Department, Hong Kong Police Force, Fire Services<br />
Department, Marine Department, Civil Aviation Department, Social Welfare<br />
Department, Medical and Health Department, Resettlement Department, New<br />
Territories Administration, Radio Hong Kong, Department of Agriculture<br />
and Fisheries and the Information Services Department. 233 In the 1970s, several<br />
units were set up to handle the rehousing of people living in boats, rooftop<br />
huts and unsafe wooden buildings. They were to warn the residents through<br />
broadcasts of the possible danger and render rehabilitation assistance after disasters<br />
struck. 234 Temporary shelters were put in place on Hong Kong Island, and in<br />
Kowloon and the New Territories. Take Typhoon Elsie as an example. This<br />
typhoon affected Hong Kong between 12 and 15 October 1975. At the time<br />
there were 50 temporary shelters on the Island, 61 in Kowloon and three in<br />
the New Territories. The shelters were mainly set up in community and<br />
social centres, and on primary and secondary school premises. 235 During the<br />
passage of Typhoon Hope between 1 and 3 August 1979, the government<br />
opened 191 temporary shelters, arranged temporary housing and distributed<br />
food and other necessities to over 3,000 people. 236 In 1983, the number of<br />
temporary shelters rose to 250. 237 By the early 1990s, the government had<br />
markedly improved its relief services during cold weather spells. As well as<br />
opening more temporary shelters to those in need, it also sent social workers<br />
to visit old people living on their own. 238 In early 2000, to prevent the spread<br />
of influenza among the elderly and the very young, the government provided<br />
free influenza vaccinations for the old and the young.<br />
After the destructive landslides of 1972, the government established the<br />
Geotechnical Engineering Office in 1977 to improve and maintain slope safety,<br />
and scrutinise closely newly built slopes, with an annual budget of about $600<br />
million. 239 For the year 2001, although the government still received around<br />
¹º»¼<br />
noMÆ#t«·+ág²á&·ÇÝg\#& 1950 lÖ/ Ê8—1’<br />
¯23MÜÝäå_ÙÚVÛ&no!ÜÝî¡ýãÃMxOÄ&56°±M£<br />
E&9:FGë!Æ#t«M7¸Ä\ŒÕ€#ÂEˆeMȸ&5e&1958l<br />
°±+Ë…e:&ë!ÇÝ#ê&[°±+Ë…Gab,MåÊåô;ØÆ& 235 1979 l 8 m 1 3<br />
"&Í»8 ª3%À&noÏ9MÍ
300 to 400 reported incidents involving man-made slopes, retaining walls and<br />
natural slopes, most of them were damage caused by slope surface erosion.<br />
The incidence of landslips resulting in human casualties and blocked roads has<br />
been greatly reduced.<br />
By the latter part of the 1970s, threats posed by natural disasters had<br />
discernibly weakened. The relevant government departments actively led the<br />
relief work and promoted new preventive measures such as the provision of<br />
additional typhoon and temporary shelters. Instead of relying on voluntary<br />
organisations, the government, on its own initiative, distributed money, food<br />
and clothing to disaster victims, as well as rendering other forms of assistance.<br />
Its efforts extended beyond short-term remedial work; it also actively educated<br />
the public on the importance of adopting disaster prevention measures. All<br />
this work has confirmed the proactive stance of the government. The improving<br />
ability to defend against natural disasters and increasingly high values placed<br />
on human lives also symbolise society’s progress.<br />
ͧÔ&Ïï>l:_lªÀxêh\>©@1<br />
! 1972 lM!R]^6& 1977 l23noÛ9—¼t¡ë,Ê_Hâ<br />
AMnoVW&ÊðâipYAM&noXlá´:EBSÜý1 239 2001<br />
l& €noXl@o¬Óg300400ÅÙˆAM¤C—Dá'€!MŸŠM<br />
ih&ŠÆ]RÊ!MЮ{šEMUih&5!R]^yPÙl¹ºòFG<br />
MíMxOkÿÆÆ\z1<br />
H
Modernisation of the City<br />
338<br />
In the 1960s, the whole of Hong Kong underwent a period of rapid<br />
expansion. Large-scale infrastructure projects included the extension of Kai<br />
Tak airport; the reclamation works throughout Hong Kong Island, Kowloon<br />
Peninsula and the New Territories; the construction of large reservoirs; the<br />
development of satellite towns and the expansion of transportation networks.<br />
The government urgently required the Observatory to provide meteorological<br />
data on typhoons, tides and rainfall, to be used as reference materials in feasibility<br />
studies. Meteorological data thus became safety guidelines for urbanisation.<br />
The Observatory summarised and analysed all the serious typhoons and<br />
rainstorms of the past and provided data evaluation of disaster incidence. The<br />
removal of the severe weather concern from engineering projects was the key<br />
to Hong Kong’s massive infrastructural expansion since the 1960s.<br />
The involvement of meteorological observations in infrastructural<br />
development has drawn the Observatory closer to the lives of ordinary people.<br />
In the 1980s, the Observatory took on an additional task of monitoring the<br />
environment and provided the public with new information to ensure a healthy<br />
life. Reports on radiation monitoring and the ultraviolet index are indispensable<br />
reading for twenty-first-century city people. They are also perfect examples<br />
of the expansion of services rendered by the Observatory.<br />
In recent years, the Observatory has made a major breakthrough with its<br />
image — due largely to improving forecasting accuracy and a reporting style<br />
that is increasingly appealing to the public. The Observatory’s ground<br />
meteorological data for Hong Kong are being enhanced with the assistance of<br />
other government departments — such as the Water Supplies Department<br />
and the Civil Engineering Department — as well as other private organisations<br />
and educational institutions. Meteorological stations are now located all over<br />
Hong Kong and have enriched the meteorological database of Hong Kong.<br />
The application of modern technologies such as digital radars, satellites and<br />
new computer technologies has made enormous contributions to improving<br />
the accuracy of weather forecasts. In addition, new dissemination channels<br />
such as electronic media and video broadcasts have transformed the traditional<br />
and boring weather reporting format to one that is exciting and relevant. The<br />
public can now receive simple weather news promptly and show much greater<br />
interest in meteorological information. For people living in the twenty-first<br />
century, the following are indispensable information for the preservation of<br />
their personal safety and health: local weather reports and forecasts, severe<br />
weather warnings, and weather reports and forecasts of the major world cities.<br />
Such information is vital to the daily lives of ordinary people.<br />
p°±Y9Ì/0Ë°g²ÔÆ‹m»½àMFóm.m|1H
Conclusion<br />
CONCLUSION<br />
Hong Kong has made a remarkable transformation from being a mere fishing<br />
village in the mid-nineteenth century into a thriving entrepôt, then a leading<br />
processing industry base, and by the end of the twentieth century, a premier<br />
international financial centre. External economic and political factors such as<br />
the emergence of the Asia Pacific region as a trade power, political changes in<br />
China and the rest of the world have contributed to its development. However,<br />
the pace of development in the past one and a half centuries has not taken<br />
place in tandem with external changes. Its rhythm is distinctive, as the impetus<br />
behind the city’s development has been shaped by the uniqueness of Hong<br />
Kong society. This research into the 120-year history of the Hong Kong<br />
Observatory not only traces its establishment and its subsequent development,<br />
it also gives a fresh look into the arduous struggles that the people of Hong<br />
Kong have put up against nature’s challenges. The study represents a new<br />
reference source on the unique characteristics that forge the evolution of Hong<br />
Kong society.<br />
Due to a dearth of land and other natural resources, before the midnineteenth<br />
century, Hong Kong only had military value to China as a frontier<br />
stronghold but was historically insignificant. In the early 1840s, when Britain<br />
established its colonial rule, its intentions were to use Hong Kong as a temporary<br />
trading port and an important military outpost in Asia Pacific. No blueprint<br />
was drawn up for its long-term development; such state of affairs persisted<br />
until the early twentieth century, when significant changes took place.<br />
Fickle climatic conditions had been the major stumbling block to Hong<br />
~›%no[p&\]/0'|}q=.`„àrsg·tu11883c<br />
Kong’s development in the late nineteenth century. In late spring, just before<br />
the arrival of summer, the warm and humid weather conditions are perfect for<br />
Ž'„…†'v}wx.zl 1880 c½„%âHrs'Ö_'`ayziƒ<br />
mosquito breeding and the proliferation of bacteria and viruses that can quickly<br />
X{+|˜.\]'/0}i>~’ßGHX€ €Ãó F‚¸23Sƒ<br />
spread infectious diseases. The summer is hot and rainy, with frequent flooding,<br />
'!"#$„&.„…† †'…džxIiƒ‡–>Rˆ‰Š‹Œ ‚<br />
while typhoons pose a constant threat to humans and livestock during the<br />
ÊÜŽ ‘ Ü’“”Ñ•–—˜Iš›Y>'àᜅ<br />
summer and autumn months. Such climatological conditions not only impinged<br />
.žŸ> Ò¡¢£¤¥s¦'G§.IPQ>R'àᨩª«.¬Œ®<br />
on the health and safety of the residents, but also seriously hindered the city’s<br />
‚—¯I:É;°±'²}.‘³ÐŒ()´1PQ>R4Ê23’µ'><br />
development. To build the infrastructure of the colonial city, the government<br />
H·()'·tš^¸¹\]º»„%'t^.8¼mnÞ½'-þÃ.¿<br />
had to commit vast amounts of resources to counteract such climatic drawbacks.<br />
À[~›%nÁš'ÂÃÄ<br />
In an environment of inadequate manpower and tight resources, the early<br />
!<br />
colonial officials already encountered great difficulties in adjusting to the harsh<br />
()ÂÃ>J>ÅÆÇ|'„…Ös|È.É›[¯ß)Ê@A1|.p<br />
"<br />
340<br />
tropical climate. The periodic onslaughts of typhoons and rainstorms constantly<br />
&'àÊ…Ë~›[Ì’… 'žŸ4IÕÖ4.Þ̓΄…¤Ï'ÐIÑl<br />
threatened the construction of the city’s infrastructure. While the government<br />
ÒÃó'ÓÔ.LÕ.ÃÖ'×ØùÙfÚÇÖIrs„à'|È.l„…†<br />
341<br />
!"<br />
!"#$%&'()*+,-)./0123%45.6789::;<br />
@ABC%D.EF'GHIJKLMNOPQ>R23'ST%@I#UJ<br />
V'WXY.Z[\]/0'X^_`abcd\]'/0efghijklE<br />
Fmn+o.[pq()rs'tu.vwxyzZ[L1\]/0'{X^|<br />
}d~()€ [‚iƒ()„…†120c'‡ˆ‰x.Š0‹Œ()„…†<br />
Žl/0' E.‘’“”•–abc)—˜š~›'œ .žŸ ¡'<br />
G‡.[Œ¢()€£W'¤¥'“¦§<br />
¨©ª«¬>I„›®.F!"#$%&¯°.()>R±[%@²³'<br />
´µ}.*·F%@‡ˆ¸¹£º’}»¼ I8 1840 c½.¾@¿À()<br />
ÁŽÂÃ>Ä&.Å|}¯()1ÆÇÈÉÊËIPQ>R|}´µÌÍ.η<br />
ÏÐÑÒ'/0ÓÔ z,ÕÖ'µ×.+ØÙŒÚ!#$Ä&.ÛÜÝiÞš<br />
'ßW<br />
~›àá'âãÐ.[!"#$äå&()/0'|}æçè ()'à<br />
á.éêëìíîïð.ñ3òóôõIö÷.9øùúû'üý_êþÿ!"<br />
b#.$%&'_ê(ëA.‘i)*+,.—-.k/012 z3¤4â`<br />
Ø5678Ã'9:.‘;’J>PQ}RSP!TàáUVW’’.X&Y'Z*<br />
#.‘â[\]Á\'^D J>}/0()123)'^_[`abÐ'.`<br />
Fcªdefg.9¸®h«'mnä.\]'/0ijkXIlm
Conclusion<br />
was unswerving in its commitment to develop Hong Kong into an entrepôt,<br />
it lacked comprehensive planning and resources; consequently, the development<br />
of the city was sluggish and passive.<br />
Although natural disasters were the main obstacle to the growth of the<br />
enclave in the early years, weather forecasting was not given a prominent role<br />
on the establishment of the Observatory in 1883. This had much to do with<br />
the commonly and strongly-held belief in the 1880s that natural disasters were<br />
unpredictable and hence unavoidable. On the other hand, the city’s<br />
development was leaned heavily in favour of economic enhancements at the<br />
expense of social considerations. In the thriving maritime trade era of the late<br />
nineteenth century, the time service provided by the Observatory and its<br />
weather reporting service on neighbouring cities such as Macau, Guangzhou,<br />
Haikou, Kaiping, Shantou, Fuzhou, Kaifeng, Tokyo, Nagasaki, Manila and<br />
Brunei had enabled the ocean-going vessels to accurately determine their<br />
longitudinal positions and be kept well informed of the weather in the Asia<br />
Pacific region. Such services had satisfied the needs of the mariners and the<br />
commercial organisations and helped Hong Kong attain its position as a leading<br />
entrepôt in Asia Pacific. Despite such achievements, the capability to defend<br />
against natural calamities had not been boosted significantly. People who were<br />
subjected to substandard living conditions, such as fishermen and the poor,<br />
continued to bear the brunt of attacks by the elements.<br />
ÛÜÇ|ÝÞ'žßà›âá FÚ!#$¸å&.„…†âãÇ|„…°±'<br />
/0äå.æçÜè“'àÊés|È.êKÜ bëK †x.ˆ‰ 1921 c<br />
'>ìésIíîàÊésY.ïÐŒ()„…†F@AàÊðñ%'’}><br />
.z3ò“'†xZÒÒóºaÇ()€'×A²} ô.„…†õöU<br />
Ü0'®îàʆx.æç÷øùú9'îû;x.üý()*4Ê23)4<br />
þ1PQ>R'®î%D „…†F®îµ;¸ÿ¹£'ô!»¼.()'G<br />
H/0IÁŽ@A"Êi#š'$ý<br />
„…†':´*%XGH/04X¯€Ãó†x1|.Ê&Ì€'<br />
e.`¥'[`a(Ñ' )Ú‚#Uš ô.()¨©‡–%@.*9¸JK<br />
>¤+.,ÅŒš-'%@.Ãd)Ð8 š-'/01X^[\]4þ19<br />
::;%D'B}23.gáÇ4[\]/0'56 \]º»„%'t^.·<br />
tN7 ô()GH'T8X9Û.“.ÃF9:¸š-SÁ'ÆÇ;
Conclusion<br />
the development of the aviation industry has contributed immensely to Hong<br />
Kong’s economic development and its international reputation.<br />
The gradual change in the mission of the Observatory from promoting<br />
mainly economic development to meeting the needs of the public symbolises<br />
the progress of society, but this had taken a long time to achieve. After the<br />
war, due to its close proximity to China and unique political status, Hong<br />
Kong had attracted large inflows of immigrants from China. An abundant<br />
supply of cheap labour was a prerequisite for the transformation into a processing<br />
industry hub. However, such incoming labour source also put a severe strain<br />
on the enclave’s development. The defence against natural catastrophes had<br />
not been reinforced in line with the economy’s take-off. The temporary houses<br />
built by new immigrants on hill slopes were vulnerable to the elements and<br />
thus added to the destructiveness of typhoons and rainstorms. The government<br />
realised that, to make Hong Kong successful, economic development had to<br />
proceed hand in hand with improvements in people’s living conditions. The<br />
building of numerous resettlement estates since the 1950s and the typhoon<br />
shelter construction programme that commenced in the late nineteenth century<br />
and underwent much expansion in the 1960s, were emergency measures<br />
adopted in the 1950s and 1960s to safeguard human lives and facilitated the<br />
smooth assimilation of the newly-arrived labour into the workforce. These<br />
measures reflected that post-war development of the city was directed at<br />
overcoming the challenges posed by nature and bettering the livelihoods of its<br />
citizens. The Observatory’s meteorological data proved to be indispensable to<br />
the city’s development, reflected by the subsequent construction of ever taller<br />
buildings atop firm foundations that became a distinctive cultural feature of<br />
Hong Kong.<br />
š°›iœab Q:'()„…†.ž„ä]®Ÿâ[J> K/0'<br />
¡‹.`Ò67^g⢩w£J>’}¡‹ Ed¤.ÛÜàÊZ'ÝÞ<br />
Ñlb½Ñ'‰x|¥.O„…†'†xpF 1920 c½U¦j@AàÊðñ~<br />
H_ÒÿÅÆ'„…Ös|È.rÌÝÞ‰x'§Ìlb¨.‘OÇ|„…¤Ï<br />
t©>%Ç…Ñ'½ª.pa+˜.0Ùr>€~á ()tu1+,œÜ<br />
E'€.Ç|…шñl,P.[Gºabc'«¬l~¤.àʤÏÆ<br />
()…Ñ'º .[[%Ç…ÑC®¯È'°±<br />
Since the mid-1960s, in addition to the provision of professional services,<br />
the Observatory also took on the responsibility of popularising modern<br />
meteorological knowledge. In response to the demands of the local community,<br />
a series of severe weather early warnings and announcements were introduced.<br />
They included warning signals for thunderstorms and rainstorms (1967), frost<br />
and hill fires (1968), flooding (1971), landslips (1977), cold weather and very<br />
hot weather (1999). The Observatory also improved its reporting style to<br />
make it lively and simple, as well as putting a great deal of effort in popularising<br />
the weather forecast information and its practical use. As a result, the public<br />
!<br />
has become more proactive in taking precautions against natural disasters and<br />
"<br />
has come to expect the Observatory to issue guidelines on inclement weather<br />
344 345<br />
conditions. Advances in science and technology have continually improved
weather forecasting accuracy, largely due to popular demand, and also the<br />
public’s increasing knowledge of weather information. Reliance on<br />
meteorological information has made weather forecasts a vital part of daily<br />
lives of the public.<br />
In twenty-first-century Hong Kong, typhoons only create disruptions to<br />
daily routines, and no longer pose severe threats to lives and property. The<br />
public is now on its guard and will take all necessary precautions as dictated by<br />
the weather conditions. Therefore, there is a need for accurate weather<br />
information and its timely broadcast. The proactive stance of society towards<br />
extreme weather and the heightened public awareness towards prevention<br />
exemplify the cultural and economical progress made in society. In recent<br />
years, weather information has expanded its service scope further to cover<br />
also personal health issues and the living environment. Prime examples include<br />
environmental radiation monitoring, cold and very hot weather warnings,<br />
and the provision of an ultraviolet radiation index.<br />
With a staff of just over 300, the Observatory is not a department that<br />
ranks high on the government list of priorities in terms of size and resources.<br />
However, its far-reaching and pervasive influence has put it on a par with any<br />
important government department. The emphases on meteorological data<br />
gathered scientifically and modern research guidelines already won the<br />
Observatory recognition from its international counterparts in the 1920s. The<br />
innovative astronomical observation methods that the Observatory<br />
implemented have managed, through dedication and perseverance, to resolve<br />
the conflicts between Eastern and Western cultures and made Western<br />
astronomy acceptable to the local community. To become the open information<br />
society it is today, Hong Kong has accommodated and absorbed Western<br />
cultural values via a trial-and-error process that has taken more than a hundred<br />
years to develop and refine. The assimilation of Western meteorological<br />
knowledge into Hong Kong’s culture is a picture of harmonious fusion of the<br />
East and the West.<br />
Conclusion<br />
!<br />
"<br />
346 347
Notes<br />
NOTES #$<br />
1. B²³.\´µ.·“³Œ >¸¹.º»24c¼r.½+.¾àá¿ [Jin Lie<br />
and Zhang Siyan, ed., ‘On Weather’, in Xinxiu Guangzhou fuzhi (New Edition<br />
of Guangzhou Gazette), Volume 1, Qing Qianlong (1759) edition.]<br />
2. ¾QÀÁ¿4Å~ÂÃÄ.·Œ“ȸ¹.½Å!".¾Æ>}Ç¿.È 21–22<br />
[Taiping yulan quoted from Chen Changzhai, ed., ‘Topography, Ming 7’, in<br />
Guangdong tongzhi (Guangdong Gazette), Volume 89, pp. 21–22.]<br />
3. ÉÊËP³.ÌÍÎY.ÏÐ 25 cÑ.·“.¸¹.¸½.¾àá¿.È 60–<br />
63 [Shu Maoguan (Qing), Wang Chongxi, ed., ‘On Weather’, in Xinan<br />
xianzhi (Xinan District Gazette), Volume I, Qing Jiaqing (1819) edition,<br />
pp. 60–63.]<br />
4. \ÚÒ³.·“ÓÔ¸¹.½Õ.¾àá¿ [Zhang Erguo, ed., ‘On Weather’,<br />
in Dongguan xianzhi (Dongguan District Gazette), Volume 4, 1927.]<br />
5. Öš×Ø.·Œ““Ù¹.().%ÚÛV. 1975 c.È 9 [Qu Dajun,<br />
Guangdong xinyu (New Interpretations on Guangdong), Hong Kong, Zhonghua<br />
shuju, 1975, p. 9.]<br />
6. ¾ÜÝÞÛß¿4Å~ÂÃÄ.·Œ“ȸ¹.½Å!".¾Æ>}Ç¿.È 21<br />
[Nanbeitang shuchao (Written Records of Nanbeitang) quoted by Chen<br />
Changzhai, ed., ‘Topography, Ming 7’, in Guangdong tongzhi (Guangdong<br />
Gazette), Volume 89, p. 21.]<br />
7. ÉÊËP³.ÌÍÎY.ÏÐ25cÑ.·“.Ô¸¹.½Ú.¾àá¿.È61–<br />
62 [Shu Maoguan (Qing), Wang Chongxi, ed., ‘On Seasons’, in Xinan<br />
xianzhi (Xinan District Gazette), Volume 2, Qing Jiaqing (1819) edition,<br />
pp. 61-62.]<br />
8. â…ã.·âäåÛ¹.½ 46 .¾æÞçè¿.†Ý.é…êÛë. 1971 c.È<br />
106 [Mei Wending, ‘Questions on Studies on the Calendar’, in Meishi congshu<br />
(Collection of Meishi), Volume 46, Taibei, Yiwen yinshuguan, 1971, p. 106.]<br />
9. Œ >|¸ìíQ€.·Œ >RÀ¸àáˆZ®ìl‰x¹.Œ“.—Ã.<br />
1993 c [Guangzhou difangzhi bianzuan weiyuanhui, ed., Guangzhou diqu<br />
jiuzhi qihou shiliao huibian yu yanjiu (Compilation and Analyses of Meteorological<br />
Data From Guangzhou Gazette), Guangdong, Renmin, 1993.]<br />
10. CO133/1, Meteorological Table, 15 July 1844–13 April 1845, pp. 89–94.<br />
11. The Hong Kong Government Gazette, 17 October 1874, p. 579.<br />
12. CO129/14, Treasury Chambers, 6 November 1845; CO129/20, Police Department<br />
to Colonial Secretary, 21 July 1874.<br />
13. The Friend of China and Hong Kong Gazette, 28 November 1845, p. 1008.<br />
14. The Friend of China, 5 November 1853.<br />
Morrison to Comelate, Chief Treasurer Clerk, Recommends Him for Other Employment<br />
in a More Healthy Climate, 28 February 1850, pp. 180–181; CO129/37, Health<br />
of the Troops, 21 July 1851, pp. 163–176; CO129/161, Removal to a Healthier<br />
Climate, 22 April 1872, pp. 149–152; CO129/161, Dr. Murray’s Unfitness for<br />
Further Service in a Tropical Climate, 19 April 1872, pp. 260–267; CO129/304,<br />
Mr. Ladds, Veterinary Surgeon Is Not Physically Fit for Climate, 16 March 1901,<br />
pp. 414–415; CO129/309, Requests on Grounds of Ill Health in Tropical Climate,<br />
16 March 1901, pp. 255–257.<br />
17. Cooper, F. A., ‘Report on the Water Supply of the City of Victoria and Hill<br />
District’, Hong Kong Sessional Papers, 1896, pp. 264–268.<br />
18. Doberck, W., Observations and Researches Made at the Hong Kong Observatory,<br />
Hong Kong, Noronha & Co., 1885, pp. 124–125.<br />
19. The Colonial Surgeon’s Report, CO133/18, p. 117; CO133/20, p. 115; CO<br />
133/21, p. 129; CO133/23, p. 131; CO133/24, p. 135; CO133/25, p. 135;<br />
CO133/26, p. 146; CO133/27, p. 137; The Hong Kong Government Gazette,<br />
7 March, 1863, p. 78; 17 March 1866, p. 134; 23 March 1872, p. 138; 17<br />
April 1875, p. 178; Annual Report of Colonial Surgeon, Hong Kong Blue<br />
Book 1876, Table XIV; Hong Kong Blue Book 1878, Table XVIII; ‘Reports<br />
of Colonial Surgeon and Other Sanitary Papers’, Hong Kong Administrative<br />
Reports, 1879.<br />
20. The temperature records retrieved from the government reports represent<br />
the daily highest and lowest temperatures, but not the temperatures recorded<br />
at 9:00 AM and at 3:00 PM as suggested by the information. The temperature<br />
records at 9:00 AM seem too low while those at 3:00 PM seem too high. It is<br />
believed that during the late nineteenth century the thermometer had a selfregistering<br />
system that could register the daily highest and lowest temperatures<br />
automatically. The Observatory staff were responsible for the daily registrations<br />
at 9:00 AM and at 3:00 PM.<br />
21. Information provided by Hong Kong Observatory. Published reports include:<br />
Royal Observatory, Meteorological Results Part I — Surface Observations (yearly),<br />
Hong Kong, 1884–1939, 1947–1986; Royal Observatory, Surface Observations<br />
in Hong Kong (yearly), Hong Kong, 1987–1992; Hong Kong Observatory,<br />
Summary of Meteorological Observations in Hong Kong, Hong Kong, 1993–2002.<br />
22. Hong Kong Observatory data; Peacock, J. E., ed., Hong Kong Meteorological<br />
Records and Climatological Notes 60 Years, Hong Kong Royal Observatory, 1951;<br />
Royal Observatory, Meteorological Results Annual Report, Hong Kong, 1951–<br />
1990; Royal Observatory, Surface Observations in Hong Kong, Hong Kong, 1991–<br />
1992; Royal Observatory, Summary of Meteorological Observations in Hong Kong,<br />
15. The Hong Kong Government Gazette, 17 November 1883, pp. 880–883.<br />
Hong Kong, 1993–1997; Hong Kong Observatory, Summary of Meteorological<br />
348 349<br />
16. CO129/35, Comelate J. G. Leave of Absence, 8 May 1850, p. 150; CO129/35,<br />
Observations in Hong Kong, Hong Kong, 1998–2002.<br />
#<br />
$
Notes<br />
23. îïð()„…†.·)*¹.(). 1992 c.È 24 [See Royal Observatory,<br />
Typhoons, Hong Kong, 1992, p. 24.]<br />
24. îïð()„…†.·)*¹.(). 1992 c.È 8 [See Royal Observatory,<br />
Typhoons, Hong Kong, 1992, p. 8.]<br />
38. Hong Kong Observatory, Hong Kong Typhoons (pamphlet), Table XVII,<br />
Hong Kong, p. 18.<br />
39. ·ÚCø…¹. 1964 c 5 à 29 ø_1964 c 10 à 18 ø_1966 c 5 à 29 ø [Wah<br />
Kiu Yat Po, 29 May 1964; 18 October 1964; 29 May 1966.]<br />
25. ñÛ1òóÒ©5#$%&Ø°.Fôõ4538463cÖ.òäök÷8Œ .·Ü<br />
40. ·ÚDø…¹. 1906 c 9 à 26 ø[Huazi ribao, 26 September 1906]_·ÚDø<br />
ø¸¹[ùúÜ>R'ÿîÿû [Nanyue zhi (Gazette of South China) was<br />
…¹. 1906 c 10 à 2 ø[Huazi ribao, 2 October 1906]_·ÚCø…¹. 1961<br />
written by Shen Huaiyuan in the mid-fifth century, while he was demoted to<br />
c 5 à 21 ø[Wah Kiu Yat Po, 21 May 1961]_China Mail, 18 August, 1923.<br />
Guangzhou between 453 and 463 AD, and recorded his experiences in South<br />
41. ·ÚDø…¹. 1906 c 9 à 29 ø [Huazi ribao, 29 September 1906.]<br />
China.]<br />
42. Li Woon Yee, ‘The Typhoon of 18 September 1906’, Royal Observatory,<br />
26. 4Å~üýÃ.·%ÚàÊÞˆ¹.†þ.ÉxêÛë.1970c.È79 [Quoted<br />
Occasional Paper No. 36, Hong Kong, July 1976, p. 5.<br />
from Liu Zhaomin, Zhonghua qixiangxueshi (A History of Chinese Meteorology),<br />
43. So, C. L., ‘Mass Movements Associated With the Rainstorm of June 1996 in<br />
Taiwan, The Commercial Press, 1970, p. 79.]<br />
Hong Kong’, in Transactions of the Institute of British Geographers, 1971, pp. 53,<br />
27. ÿõ!.·"ð#$¹.¸‚.%&}'. 1995 c’ê [Lou Yuanli, Tianjia<br />
55–56; Lumb, P., ‘Slope Failures in Hong Kong’, Quarterly Journal of Engineering<br />
wuxing (Five Elements of Agriculture), Reprint. Shanghai, Guzhi chubanshe,<br />
Geology, 1975, No. 8, pp. 31–65.<br />
1995.]<br />
44. ·EFø…¹. 1957 c 9 à 24 ø_1957 c 9 à 26 ø [Sing Tao Daily, 24<br />
28. ().·*Û+¹.º» 49 c' [Dai Tong, Liushu gu (Ancient Stories From<br />
September 1957; 26 September 1957.]<br />
Six Books), Qianlong (1784), 1784.]<br />
45. ·ÚCø…¹. 1964 c 5 à 29 ø [Wah Kiu Yat Po, 29 May 1964.]<br />
29. 4Å~%@ÝÞ,~›ÝÞˆ‰xÿ.>Þˆðì.·%@%½>-Þˆ¹.Ý”.<br />
46. ·ÚCø…¹. 1977 c 9 à 25 ø [Wah Kiu Yat Po, 25 September 1977.]<br />
ÝÞ}'. 1984 c.È 111 [Quoted from The Institute for the History of<br />
47. ·ÚCø…¹. 1973 c 8 à 22 ø [Wah Kiu Yat Po, 22 August 1973.]<br />
Natural Science, Chinese Academy of Sciences, Zhongguo gudai dili xueshi (Ancient<br />
48. ·ÚCø…¹. 1970 c 5 à 14 ø [Wah Kiu Yat Po, 14 May 1970.]<br />
Chinese Historical Geography), Beijing, Kexue chubanshe, 1984, p. 111.]<br />
49. ·ÚDø…¹. 1908 c 8 à 17 ø_1925 c 4 à 14 ø [Huazi ribao, 17 August<br />
30. ·‘ >¸¹.Ý”.Ûš…Ô. 1990 c..}/æ (24 c) 1596 c¼r6ê<br />
1908; 14 April 1925.]<br />
[Fuzhou fuzhi (Local Gazette of Fuzhou), Ming Wanli (1596) edition, Beijing,<br />
50. ·EFø…¹.1962c9à2ø_1983c9à10ø [Sing Tao Daily, 2 September<br />
Shumu wenxian, 1990.]<br />
1962; 10 September 1983.]<br />
31. ê0w.·Š‹$1¹.†Ý.Œ…ÛV. 1968 c’ê.È 9–10 [Yin<br />
51. ·ÚDø…¹.1919c8à1ø_1921c2à26ø [Huazi ribao, 1 August 1919;<br />
Guangren, Aomeng jilue (A Collection of Records of Macao), Taibei, Guangwen<br />
26 February 1921.]<br />
shuju, 1968, pp. 9–10.]<br />
52. ·šô…¹. 1966 c 7 à 18 ø [Ta Kung Pao, 18 July 1966.]<br />
32. 234V+.·)*¹.().Œ»5. 1986 c.È 6–7 [Li Jie and Xu<br />
53. ·ÚCø…¹. 1959 c 8 à 12 ø [Wah Kiu Yat Po, 12 August 1959.]<br />
Shengyi, Typhoons, Hong Kong, Guangjiao jing, 1986, pp. 6–7.]<br />
54. ·ÚCø…¹. 1966 c 7 à 15 ø [Wah Kiu Yat Po, 15 July 1966.]<br />
33. ()„…†.·+"""c!Tà6¹.(). 2000 c.È 14–20 [Hong Kong<br />
55. ·ÚCø…¹. 1964 c 8 à 10 ø [Wah Kiu Yat Po, 10 August 1964.]<br />
Observatory, Tropical Cyclones in 1999, Hong Kong, 2000, pp. 14–20.]<br />
56. ·+"ÇÚc#%ÜGíQ€%&…ËÛ¹.().J>êxV.1972c8à_·+<br />
34. 7…89:9.;Ì.@AB.·àÊl—ó¹.†þ.%Ú…Ñ}'<br />
"ÇÚc#%ÜGíQ€Áô…ËÛ¹.().J>êxV. 1972 c 11 à_·Ú<br />
µ;.1959c.È103 [Ke Ruike and Fulan, Qihou yu rensheng (Relationship<br />
Cø…¹. 1972 c 6 à 20 ø_·}…¹. 1972 c 6 à 24 ø [Hong Kong<br />
Between Weather and Human Lives), trans. Xue Jixun, Taiwan, Zhonghua<br />
Commission of Inquiry on Rainstorm Disasters, Interim Report on 1972<br />
wenhua chuban shiyeshe, 1959, p. 103]; Gordon E. Dunn, Atlantic Hurricanes,<br />
Rainstorms, Hong Kong, Government Printer, August, 1972; Hong Kong<br />
Baton Rouge, Louisiana State University Press, 1964, p. 35.<br />
Commission of Inquiry on Rainstorm Disasters, Final Report on 1972 Rainstorms,<br />
35.<br />
36.<br />
D. M. Gray, ‘Tropical Cyclones’, The Junk, June 1989, pp. 27–31.<br />
Royal Observatory, Meteorological Results, Hong Kong, 1946–1986; Hong Kong<br />
Hong Kong, Government Printer, November, 1972; Wah Kiu Yat Po, 20 July<br />
1972; Ming Pao, 24 June 1972.]<br />
#<br />
$<br />
350<br />
Observatory, Tropical Cyclones in 1999, 2000, pp. 72–73.<br />
57. ¬^: H.·9opq¹.().2000c [Geotechnical Engineering Office,<br />
37. ·ÚCø…¹. 1989 c 4 à 23 ø [Wah Kiu Yat Po, 23 April 1989.]<br />
Landslide, Hong Kong, 2000.]<br />
351
88. \¾Ì¯a.·ÀÐbcVd¹.½349.4Å~·ÕUkÛ¹.¡VÛV982–<br />
#<br />
$<br />
352<br />
Kau-Lung Peninsula’, The Hong Kong Government Gazette, 4 March 1882,<br />
933 W.¸‚.%&}'. 1987 c' [Zhang Ying, Wang Shizhen, Yuding<br />
p. 227.<br />
yuanjian leihan (Imperial Collection of Correspondence and Reference<br />
353<br />
Notes<br />
58. ·EFø…¹. 1966 c 6 à 14 ø [Sing Tao Daily, 14 June 1966.]<br />
59. ·EFø…¹. 1966 c 6 à 14 ø [Sing Tao Daily, 14 June 1966.]<br />
60. ·EFø…¹. 1959 c 6 à 17 ø [Sing Tao Daily, 17 June 1959.]<br />
61. Â9I.·()'J:.k¹.().¬^: ¦. 2002 c [Chan, Kin-sek,<br />
The Safety of Hong Kong Slopes, Hong Kong, Geotechnical Engineering Office,<br />
2002.]<br />
62. ¬^: H.·9opq¹.().2000c [Geotechnical Engineering Office,<br />
Landslide, Hong Kong, 2000.]<br />
63. So, C. L., ‘Mass Movements Associated With the Rainstorm of June 1996 in<br />
Hong Kong’, in Transactions of the Institute of British Geographers, 1971, pp. 53,<br />
55–56; Lumb, P., ‘Slope Failures in Hong Kong’, Quarterly Journal of Engineering<br />
Geology, 1975, No. 8, pp. 31–65.<br />
64. So, C. L., ‘Problems of Slope in Hong Kong’, in Geografiska Annaler, Series A,<br />
1976, No. 3, pp. 149–154.<br />
65. ·EFø…¹. 1956 c 1 à 10 ø [Sing Tao Daily, 10 January 1956.]<br />
66. ·EFø…¹. 1999 c 12 à 24 ø [Sing Tao Daily, 24 December 1999.]<br />
67. ·EFø…¹. 1999 c 9 à 13 ø8 14 ø [Sing Tao Daily, 13–14 September<br />
1999.]<br />
68. ·EFø…¹. 1999 c 9 à 13 ø8 14 ø; 1999 c 8 à 21 ø8 22 ø [Sing Tao<br />
Daily, 13–14 September 1999; 21–22 August 1999.]<br />
69. ·EFø…¹.1967c1à16ø_1967c1à17ø [Sing Tao Daily, 16–17 January<br />
1967.]<br />
70. ·EFø…¹. 1967 c 1 à 16 ø_1971c 1 à 4 ø8 5 ø. 9 8 10 ø.I12 ø_<br />
1973 c 12 à 31 ø_1976 c 1 à 12 ø_1992 c 11 à 11 ø [Sing Tao Daily,<br />
16 January 1967; 4–5, 9–10, 12 January 1971; 31 December 1973; 12 January<br />
1976; 11 November 1992.]<br />
71. ·EFø…¹. 1973 c 12 à 26 ø_1973 c 12 à 27 ø [Sing Tao Daily, 26–<br />
27 December 1973.]<br />
72. ·ÚCø…¹. 1992 c 11 à 11 ø [Wah Kiu Yat Po, 11 November 1992.]<br />
73. ·EFø…¹. 1976 c 1 à 12 ø [Sing Tao Daily, 12 January 1976.]<br />
74. ·EFø…¹.1961c1à17ø822ø [Sing Tao Daily, 17–22 January 1961.]<br />
75. £K›.·ÍLMacNN()_$+a#!c¹.().ÉxêÛë.2001c.<br />
È 183–189 [Ho, Pui Yin, Water for a Barren Rock: 150 Years of Water Supply<br />
in Hong Kong, Hong Kong, The Commercial Press, 2001, pp. 183–189.]<br />
76. Surveyor General J. M. Price to the Acting Colonial Secretary, ‘Time Ball in<br />
Victoria Harbour’, The Hong Kong Government Gazette, 17 November 1877,<br />
pp. 510–512.<br />
77. Palmer, H. Spencer, ‘On a Determination of Latitude at Mount Elgin, in the<br />
78. Surveyor General J. M. Price to the Acting Colonial Secretary, ‘Time Ball in<br />
Victoria Harbour’, The Hong Kong Government Gazette, 17 November 1877,<br />
pp. 510–512.<br />
79. Admiral Alfred P. Ryder to the Acting Colonial Secretary, ‘The Establishment<br />
of a Time Ball at Hong Kong in an Observatory’, The Hong Kong Government<br />
Gazette, 17 November 1877, pp. 512–513.<br />
80. Dyson, Anthony, From Time Ball to Atomic Clock, Hong Kong, Government<br />
Printer, 1983, p. 19; Malone, D. J., ‘History and General Organisation of the<br />
Royal Observatory, Hong Kong’, Hong Kong Observatory, Occasional Papers,<br />
No. 34; Starbuck, L., A Brief General History of the Royal Observatory, Hong<br />
Kong Observatory, 1951, p. 1; Starbuck, L., ‘A Condensed History of the<br />
Royal Observatory, Hong Kong’, The Marine Observer, April, 1953; Oó¾.<br />
¾()„…†ˆM¿.·àʤϹ. 1977 c.) 3 &.P) 95 & [Lam Y. C.,<br />
‘Xianggang tianwentai shihua’ (History of the Hong Kong Observatory), Qixiang<br />
zhishi (Knowledge of Meteorology), 1977, No. 3, Total No. 95].<br />
81. ‘On the Proposal to Establish a Physical Observatory at Hong Kong’, The Hong<br />
Kong Government Gazette, 3 September 1881, p. 801.<br />
82. Doberck, W., ‘Report for 1884 from the Government Astronomer’, Observations<br />
and Researches Made at the Hong Kong Observatory, Hong Kong, Noronha &<br />
Co., 1884, p. 123.<br />
83. ‘On the Proposal to Establish a Physical Observatory at Hong Kong’, The Hong<br />
Kong Government Gazette, 3 September 1881, p. 810.<br />
84. ‘Return of All Public Works, Civil Roads, Canals, Bridges, Building, &c., Not<br />
of a Military Nature, Which Have Been Undertaken During the Year 1883’,<br />
Hong Kong Blue Book 1883, Hong Kong, Noronha & Co., 1884, F8.<br />
85. QR”.·*ðS GT¹.½47.4Å~·ÕUkÛ¹.G¡SV80W.¸‚.<br />
%&}'. 1987 c' [Feng Fujiang, Liujia shiming wushu (Notes and<br />
Commentaries on Poems and Matters of Six Schools), Volume 47, quoted<br />
from Siku quanshu (A Complete Collection of Four Treasures), jingbu shilei,<br />
Book 80, Shanghai, Guji chubanshe, 1987.]<br />
86. XôY.·d!ZT¹.½ 17 .†Ý. #UÛV. 1963 c' [Jia Gongyan,<br />
Zhouli zhushu (Notes and Commentaries on Rites and Ceremonies of Zhou<br />
Dynasty), Volume 17, Taibei, Shijie shuju, 1963.]<br />
87. [\Õ.·%G¢]^¹.½ 12 .4Å~·ÕUkÛ¹.G¡#G_`V 194 W.<br />
¸‚.%&}'. 1987 c' [Yu Xiaoke, Gujing jiegouchen (Interpretation<br />
of Ancient Classics), Volume 12, quoted from Siku quanshu, jingbu wujing<br />
zongyilei, Book 194, Shanghai, Guji chubanshe, 1987.]
97. %@„…Þˆx-‰xyð.·%@„…Þˆ¹.Ý”.ÝÞ}'.1981c.È<br />
#<br />
$<br />
354<br />
243 [Zhongguo tianwenxue shi zhengli yanjiu xiaozu, Zhongguo tianwenxue<br />
114. Doberck, W., Observations and Researches Made at the Hong Kong Observatory in<br />
shi (History of Chinese Astronomy), Beijing, Kexue chubanshe, 1981, p. 243.]<br />
the Year 1888, Hong Kong, Noronha & Co., 1889, p. 3.<br />
355<br />
Notes<br />
Materials), Volume 349, quoted from Siku quanshu, zibu leishulei, Books 932–<br />
933, Shanghai, Guji chubanshe, 1987.]<br />
89. ef".·#!Èg¹.½ 218 .4Å~·ÕUkÛ¹.G¡!V 135–142 W.¸<br />
‚.%&}'.1987c' [Qin Huitian, Wuli tongkao (General Introduction<br />
of Five Rites and Ceremonies), Volume 218, quoted from Siku quanshu, jingbu<br />
lilei, Books 135–142, Shanghai, Guji chubanshe, 1987.]<br />
90. 7h³.·“iÛ¹.½ 47 .4Å~·ÕUkÛ¹.ˆ¡[ˆV 272-286 W.¸<br />
‚.%&}'. 1987 c' [Ouyang Xiu, Xin tangshu (New History of the<br />
Tang Dynasty), Volume 47, quoted from Siku quanshu, shibu zhengshilei, Books<br />
272–286, Shanghai, Guji chubanshe, 1987.]<br />
91. j~k.·$b‚¹.½ 29 .4Å~·ÕUkÛ¹.¡VÛV 930–932 W.<br />
¸‚.%&}'.1987c' [Pan Zimu, Jizuan yuanhai (A Comprehensive<br />
Chronology), Volume 29, quoted from Siku quanshu, zibu leishulei, Books<br />
930–932, Shanghai, Guji chubanshe, 1987.]<br />
92. l9l.·Bˆ¹.½56.4Å~·ÕUkÛ¹.ˆ¡[ˆV290–291W.¸‚.<br />
%&}'. 1987 c' [Tuo Ke Tuo, Jin shi (History of Jin), Volume 56,<br />
quoted from Siku quanshu, shibu zhengshilei, Books 290–291, Shanghai, Guji<br />
chubanshe, 1987.]<br />
93. mSn .·}ˆ$µr„¹.½ 73 .4Å~·ÕUkÛ¹.$µr„V 364 W.<br />
¸‚.%&}'. 1987 c' [Gu Yingtai, Mingshi jishi benmo<br />
(Comprehensive Chronology of the Ming Dynasty), Volume 73, quoted from<br />
Siku quanshu, jishi benmolei, Book 364, Shanghai, Guji chubanshe, 1987.]<br />
94. ·ïTȸ¹.½ 67 .4Å~·ÕUkÛ¹.ˆ¡JÛV 644–645 W.¸‚.%&<br />
}'. 1987 c'_·oКɀp¹.½ 86 .4Å~·ÕUkÛ¹.ˆ¡JÛ<br />
V619W.¸‚.%&}'.1987c' [Huangchao tongzhi (General Gazette<br />
of Qing Dynasty), Volume 67, quoted from Siku quanshu, shibu zhengshulei,<br />
Books 644–645, Shanghai, Guji chubanshe, 1987; Qinding daqing huidian (Books<br />
and Records of the Qing Dynasty Made by Imperial Order), Volume 86, quoted<br />
from Siku quanshu, shibu zhengshulei, Book 619, Shanghai, Guji chubanshe,<br />
1987.]<br />
95. ·%@cc¹.¸‚.ÉxêÛë. 1924 c.È 40 . 208 [Zhongguo nianjian<br />
(China Year Book), Shanghai, The Commercial Press, 1924, pp. 40, 208]; The<br />
China Year Book 1914-1938, Shanghai, North China Daily News & Herald_<br />
qrst„…#ucvwÈ [‘Appendix: 5,000 Years of Astronomy’ website],<br />
.<br />
96. %@ÝÞ,¸‚„…†wÈ [Shanghai Astronomical Observatory, Chinese<br />
Academy of Sciences website], .<br />
98. Doberck, W., Observations and Researches Made at the Hong Kong Observatory in<br />
the Year 1885, Hong Kong, Noronha & Co., 1886, p. 1.<br />
99. Doberck, W., Observations and Researches Made at the Hong Kong Observatory in<br />
the Year 1884, Hong Kong, Noronha & Co., 1885, p. 124.<br />
100. Doberck,W., ‘Report for 1883 From the Government Astronomer’, The Hong<br />
Kong Government Gazette, Hong Kong, Noronha & Co., 17 November, 1883,<br />
p. 878.<br />
101. Doberck, W., Observations and Researches Made at the Hong Kong Observatory in<br />
the Year 1886, Hong Kong, Noronha & Co., 1887, p. 1<br />
102. Doberck, W., Observations and Researches Made at the Hong Kong Observatory in<br />
the Year 1887, Hong Kong, Noronha & Co., 1888, p. 1.<br />
103. Doberck, W., Observations and Researches Made at the Hong Kong Observatory in<br />
the Year 1890, Hong Kong, Noronha & Co., 1891, p. 2.<br />
104. Doberck, W., Observations and Researches Made at the Hong Kong Observatory in<br />
the Year 1893, Hong Kong, Noronha & Co., 1894, p. 1.<br />
105. Figg, F. G., ‘Report of the Director of the Observatory, for the Year 1902’,<br />
Hong Kong Sessional Papers, Hong Kong, Noronha & Co., 1903, No. 6, p. 29.<br />
106. Claxton, T. F., ‘Report of the Director of the Royal Observatory, Hong Kong,<br />
for the Year 1914’, Hong Kong Administrative Reports for the Year 1914, Appendix<br />
E., Hong Kong, Noronha & Co, 1915, E5.<br />
107. Doberck, W., Observations and Researches Made at the Hong Kong Observatory in<br />
the Year 1888, Hong Kong, Noronha & Co., 1889, pp. 1–2.<br />
108. Figg, F. G., ‘Report of the Director of the Observatory’, Hong Kong<br />
Administrative Reports for the Year 1909, Appendix E, Hong Kong, Noronha &<br />
Co., 1910, E1.<br />
109. Doberck, W., Observations and Researches Made at the Hong Kong Observatory in<br />
the Year 1891, Hong Kong, Noronha & Co., 1892, p. 1.<br />
110. Doberck, W., Observations and Researches Made at the Hong Kong Observatory in<br />
the Year 1892, Hong Kong, Noronha & Co., 1893, p. 2.<br />
111. Figg, F. G., ‘Report of the Director of the Observatory’, Hong Kong<br />
Administrative Reports for the Year 1910, Appendix E, Hong Kong, Noronha &<br />
Co., 1911, E2.<br />
112. Claxton, T. F., ‘Report of the Director of the Royal Observatory, Hong Kong,<br />
for the Year 1915’, Hong Kong Administrative Reports 1915, Appendix F, Hong<br />
Kong, Noronha & Co., 1916, F6.<br />
113. Claxton, T. F., ‘Report of the Director of the Royal Observatory, Hong Kong,<br />
for the Year 1915’, Hong Kong Administrative Reports for the Year 1915, Hong<br />
Kong, Noronha & Co., 1916, F5.
Notes<br />
115. Claxton, T. F., ‘Report of the Director of the Royal Observatory, Hong Kong,<br />
for the Year 1913’, Hong Kong Administrative Reports 1913, Appendix E, Hong<br />
Kong, Noronha & Co., 1914, E7.<br />
116. Claxton, T. F., ‘Report of the Director of the Royal Observatory, Hong Kong,<br />
for the Year 1920’ Hong Kong Administrative Reports for the Year 1920, Appendix<br />
F, Hong Kong, Noronha & Co., 1921, F11.<br />
117. Claxton, T. F., ‘Report of the Director of the Royal Observatory, Hong Kong,<br />
for the Year 1912’, Hong Kong Administrative Reports for the Year 1912, Appendix<br />
E, Hong Kong, Noronha & Co., 1913, E10.<br />
118. Claxton, T. F., ‘Report of the Director of the Royal Observatory, Hong Kong,<br />
for the Year 1914’, Hong Kong Administrative Reports for the Year 1914, Appendix<br />
E, Hong Kong, Noronha & Co., 1915, E14.<br />
119. Claxton, T. F., ‘Report of the Director of the Royal Observatory, Hong Kong,<br />
for the Year 1919’, Hong Kong Administrative Reports for the Year 1919, Appendix<br />
F, Hong Kong, Noronha & Co., 1920, F15.<br />
120. Claxton, T. F., ‘Report of the Director of the Royal Observatory, Hong Kong,<br />
for the Year 1918’, Hong Kong Administrative Reports for the Year 1918, Appendix<br />
F., Hong Kong, Noronha & Co., 1919, F18.<br />
121. Jeffries, C.W., ‘Report of the Director of the Royal Observatory, Hong Kong,<br />
for the Year 1933’, Hong Kong Administration Reports for the Year 1933, Appendix<br />
F, Hong Kong, Noronha & Co., 1934, F8.<br />
122. Claxton, T. F., ‘Report of the Director of the Royal Observatory, Hong Kong,<br />
for the Year 1927’, Hong Kong Administrative Reports 1927, Appendix F, Hong<br />
Kong, Noronha & Co.,1928, F15.<br />
123. Claxton, T. F., ‘Report of the Director of the Royal Observatory, Hong Kong,<br />
for the Year 1921’, Hong Kong Administrative Reports for the Year 1921, Appendix<br />
F, Hong Kong, Noronha & Co., 1922, F12; Claxton, T. F., ‘Report of the<br />
Director of the Royal Observatory, Hong Kong, for the Year 1923’, Hong<br />
Kong Administrative Reports for the Year 1923, Appendix F, Hong Kong, Noronha<br />
& Co., 1924, F11.<br />
124. Jeffries, C. W., ‘Report of the Director of the Royal Observatory, Hong Kong,<br />
for the Year 1933’, Hong Kong Administration Reports for the Year 1933, Appendix<br />
F, Hong Kong, Noronha & Co., 1934, F8.<br />
125. z{—.·%@„…Þˆ¹.†Ý .„|}'.1996c.È220 [Bo Shuren,<br />
Zhongguo tianwenxue shi (History of Chinese Astronomy), Taibei, Tianjin<br />
chubanshe, 1996, p. 220.]<br />
126. O}ÎB.·d!~Z~B¹.Ý”.“ÚÛÝ”/$ÿ. 1985 c.È 352<br />
[Lin Yin, trans., Zhouli jinzhu jinyi (Rites and Ceremonies of the Zhou Dynasty<br />
127. O}ÎB.·d!~Z~B¹.Ý”.“ÚÛÝ”/$ÿ. 1985 c.È 313<br />
[Lin Yin, trans., Zhouli jinzhu jinyi, Beijing, Xinhua shudian Beijing faxingsuo,<br />
1985, p. 313.]<br />
128. €ë%.·€äð ¹.½*¾Û‚¿.4Å~·ƒ³ÕUkÛ¹„ðV 1121 W.<br />
¸‚.¸‚%&}'. 1995 c.È 665 [Yan Zhitui, ‘Shuzheng’<br />
(Verification of Books), Yanshi jiaxun (The Yan’s Family Creed), Volume 6,<br />
quoted from Xuxiu siku quanshu, zajialei, Book 1121, Shanghai, Guji chubanshe,<br />
1995, p. 665.]<br />
129. …†/.·ÂÛ‡‡$ù¹(+W).Ý”.%ÚÛV}'.1972c.È61 [Yao<br />
Silian, Chenshu jizhuan (History of Chen Dynasty — Biography), Volume 1,<br />
Beijing, Zhonghua shuju chubanshe, 1972, p. 61.]<br />
130. ˆ‰Š.·%@€ˆZåß¹.‹
Notes<br />
137. Claxton, T. F., ‘Report of the Director of the Royal Observatory, Hong Kong,<br />
for the Year 1922’, Hong Kong Administrative Reports for the Year 1922, Appendix<br />
F, Hong Kong, Noronha & Co., 1923, F14, F16.<br />
138. Jeffries, C. W., ‘Report of the Director of the Royal Observatory, Hong Kong,<br />
for the Year 1936’, Hong Kong Administration Reports for the Year 1936, Appendix<br />
F, Hong Kong, Noronha & Co.1937, F6.<br />
139. Jeffries, C. W., ‘Report of the Director of the Royal Observatory, Hong Kong,<br />
for the Year 1938’, Hong Kong Administration Report for the Year 1938, Appendix<br />
F, Hong Kong, Government Printer, 1939, F6.<br />
140. Jeffries, C. W., ‘Report of the Director of the Royal Observatory, Hong Kong,<br />
for the Year 1939’, Hong Kong Administration Report for the Year 1939, Appendix<br />
F, Hong Kong, Government Printer, 1940, F1, F6–7.<br />
141. Hong Kong Observatory, ‘Seismology, Correspondence With Various Institutes<br />
on Earthquake’, HKRS 842–1–13, File 22.<br />
142. Claxton, T. F., ‘Report of the Director of the Royal Observatory, Hong Kong,<br />
for the Year 1918’, Hong Kong Administrative Reports for the Year 1918, Appendix<br />
F, Hong Kong, Noronha & Co., 1919, F15–F16.<br />
143. Claxton, T. F., ‘Report of the Director of the Royal Observatory, Hong Kong,<br />
for the Year 1920’, Hong Kong Administrative Reports for the Year 1920, Appendix<br />
F, Hong Kong, Noronha & Co., 1921, F15–F16.<br />
144. Hong Kong Observatory, ‘Seismology, Correspondence With Various Institutes<br />
on Earthquake’, HKRS 842–1–13, File No. 22.<br />
145. Hong Kong Observatory, ‘Materials on Weather Observations During World<br />
War II’, HKRS 845.<br />
146. ‘Correspondence With Zi Ka Wei Observatory 1946-50’, HKRS 841–1/56,<br />
File No. RO 8/49.<br />
147. ‘Director of Royal Observatory to Father Ghergi, 11 December 1947’, Zi Ka<br />
Wei Correspondence, HKRS 842–1/56, File No. RO 8/49.<br />
148. Civil Aviation Department, Annual Report, Hong Kong, Government Printer,<br />
1961; 2002.<br />
149. ‘Director of Royal Observatory to Colonial Secretary 3/5/1947’, Memo to<br />
Government Departmental Duties, HKRS 842–1/52, File No. RO 104/48.<br />
150. Hong Kong Blue Book, Hong Kong, Noronha Co., 1883–1940; Royal<br />
Observatory, Report of the Director Royal Observatory Hong Kong, Hong Kong,<br />
Government Printer, 1883–1985; Hong Kong Census and Statistics<br />
Department, Hong Kong Statistics, 1947–67, Hong Kong, Government Printer,<br />
1969; Hong Kong Treasury, Annual Report by the Accountant-General for the<br />
Year Ended 31st March, Hong Kong, Noronha & Co., 1950; Hong Kong<br />
151. Royal Observatory, Hong Kong Annual Departmental Report by the Director, Royal<br />
Observatory, Hong Kong, Government Printer, 1948–1980.<br />
152. Faber, S. E. and Bell, G. J., ‘Typhoons in Hong Kong and Building Design’, in<br />
Proceedings of Engineering Society of Hong Kong, Vol. 17, 1963–1964.<br />
153. China Mail, 12 March 1897.<br />
154. Ip, C. S. F. and Wai, H. G., An Application of Harmonic Method to Tidal Analysis<br />
and Prediction in Hong Kong, Hong Kong, Royal Observatory, 1990.<br />
155. So, C. L., ‘Mass Movements Associated With the Rainstorm of June 1996 in<br />
Hong Kong’, Transactions of the Institute of British Geographers, 1971, pp. 53, 55–<br />
56; Lumb, P., ‘Slope Failures in Hong Kong’, Quarterly Journal of Engineering<br />
Geology, 1975, No. 8, pp. 31–65.<br />
156. ¬^: H.·9opq¹.(). 2000 [Geotechnical Office, Landslide,<br />
Hong Kong, 2000.]<br />
157. Chatham, W., ‘Report of the Acting Director of Public Works for 1893’,<br />
Hong Kong Sessional Papers, 1893, Hong Kong, Noronha & Co., 1984.<br />
158. ()„…†.q()#-'-§I$…àÊv(”\) [Hong Kong Observatory,<br />
‘Rainfall Measurement and Hydrometeorology’ (pamphlet).]<br />
159. Lai, Edwin S. T., Li, P. W. and Lam, C. Y., ‘Typical MCS Characteristics on<br />
Satellite IR Images for 1997 & 1998 Rainstorm Cases in Hong Kong’, in<br />
Proceedings of International Conference on MCCS and Heavy Rain in East Asia,<br />
Seoul, 24–26 April 2000; Cheung, P. and Lai, Edwin S. T., ‘Short-range Rainfall<br />
Forecast in Hong Kong’, ATC3 Workshops on Heavy Rain Induced Landslip,<br />
Hong Kong Observatory, 13 December 2001, Reprint 451.<br />
160. Royal Observatory, Hong Kong Annual Departmental Report by the Director, Royal<br />
Observatory for the Financial Year 1954–55, Hong Kong, Government Printer,<br />
1955, p. 22.<br />
161. Watts, I. E. M., Hong Kong Annual Departmental Report by the Director, Royal<br />
Observatory for the Financial Year 1955–56, Hong Kong, Government Printer,<br />
1956, p. 20.<br />
162. •–€—˜.·()“°'œ lš›¹.().”)Þ|ìœ%D.1990<br />
c [Huang Lianghui and Xue Fengxuan, Xianggang xinjichang de tiaozhan yu<br />
zhengyi (Challenges and Disputes on the New International Airport), Hong<br />
Kong, Jinggang xueshu jiaoliu zhongxin, 1990.]<br />
163. ·)ÊI°/0 1t()'/0^¹.().J>êxV. 1991 c.È 20–<br />
27 [Hong Kong Port and Airport Development Strategy: A Foundation for Growth,<br />
Hong Kong, Government Printer, 1991, pp. 20–27.]<br />
164. Bell, G. J., Hong Kong Annual Progress Report by the Director of the Royal Observatory<br />
for the Financial Year 1979–80, Hong Kong, Government Printer, 1980, p. 8.<br />
Treasury, Departmental Report by the Accountant General, Hong Kong,<br />
165. Lam, C. Y., ‘Meteorological Conditions at Chek Lap Kok’ (First and Second<br />
358 359<br />
Government Printer, 1951–2002.<br />
Reports), Occasional Paper, Royal Observatory, 1981; Lam, C. Y.,<br />
#<br />
$
173. ()„…†©¡Z[Hong Kong Observatory Internal Records]_•–€<br />
188. ·}…¹.2002c8à8ø_()„…†.·()àÊÖs}2001¹.·Åq2001<br />
—˜.·()ª½4°«Í‰x¹.().Á‰xðñ°‰xÿ. 1991 .<br />
c”¯¸/ø_ø±ÇÖv [Ming Pao, 8 August 2002; Hong Kong<br />
#<br />
È17 [Huang Lianghui and Xue Fengxuan, Xianggang tidaixing jichang xuandian<br />
Observatory, Summary of Meteorological Observation in Hong Kong, Table 8, 2001.]<br />
$<br />
yanjiu (Alternative Sites for Hong Kong’s Replacement Airport: A Pre-feasibility<br />
189. China Mail, 7 October 1869; 4 October 1879.<br />
360 361<br />
Study), Hong Kong, Jijian yanjiu xuzhi jichang yanjiusuo, 1991, p. 17]<br />
190. ()„…†wÈ.q()àÊj¹Ösv[Hong Kong Observatory website,<br />
Notes<br />
‘Preliminary Report on the Wind Tunnel Experiment to Study Turbulence<br />
and Wind Shear in the Vicinity of Chek Lap Kok’, Occasional Paper, Royal<br />
Observatory, 1981; Lam, C. Y., ‘An Investigation of Turbulence and Wind<br />
Shear in the Vicinity of Chek Lap Kok Using a Light Aircraft, Dec. 1979–<br />
Nov. 1981’, Occasional Paper, Royal Observatory, 1981; Lam, C. Y., and<br />
Yeung, K. H., ‘Chek Lap Kok Meteorological and Oceanographic<br />
Investigations 1979–1982’, Occasional Paper, Royal Observatory, 1982;<br />
Wong, S. C., ‘Preliminary Report on the Chek Lap Kok Basin Storm Surge<br />
Numerical Modeling Investigation’ (First and Second Reports), Occasional<br />
Paper, Royal Observatory, 1981 and 1982.<br />
166. üDž.¾()@A°*¬W,Ÿ‰x¿. %@Ãö®îPVî%ìÈ¡-<br />
V.·®îàʆxÞ|윀¹.2000c9à5–9ø.È4 [Lau, C. Y., ‘Case<br />
Study of Windshear and Turbulence at Hong Kong International Airport’, in<br />
Zhongguo minyong hangkong zongju kongzhong jiaotong guanliju, ed.,<br />
Hangkong qixiang fuwu xueshu jiaoliu hui (Academic Exchange Conference on<br />
Aviation Services), 5–9 Sept 2000, p. 4.]<br />
167. ()„…†.·F()}b'*¬WI¢œNN_8$Q£g'Z¹. 2002 .<br />
È 4 [Hong Kong Observatory, Windshear and Turbulence in Hong Kong:<br />
Information for Pilot, 2002, p. 4.]<br />
168. ()„…†.·F()}b'*¬WI¢œNN_8$Q£g'Z¹. 2002 .<br />
È 13 [Hong Kong Observatory, Windshear and Turbulence in Hong Kong:<br />
Information for Pilot, 2002, p. 13.]<br />
169. üDž.¾()@A°*¬W,Ÿ‰x¿. %@Ãö®îPVî%ìÈ¡-<br />
V.·®îàʆxÞ|윀¹.2000c9à5–9ø.È1 [Lau, C. Y., ‘Case<br />
Study of Windshear and Turbulence at Hong Kong International Airport’, in<br />
Zhongguo minyong hangkong zongju kongzhong jiaotong guanliju ed.,<br />
Hangkong qixiang fuwu xueshu jiaoliu hui (Academic Exchange Conference on<br />
Aviation Services), 5–9 Sept 2000, p. 1.]<br />
170. ·EFø…¹. 1999 c 8 à 23 ø [Sing Tao Daily, 23 August 1999.]<br />
171. ¾GHVVÑ2¤¥Û˜¦§ŽÈ€!Õ¨t*¬W¿. 2001 c 2 à 21 ø<br />
[‘Written Reply by Secretary for Economic Services Li Suk Yee to the 14<br />
Questions on Windshear Raised by the Legislative Council’, 21 February 2001.]<br />
172. ()„…†.·F()}b'*¬WI¢œNN_8$Q£g'Z¹. 2002 .<br />
È 5 [Hong Kong Observatory, Windshear and Turbulence in Hong Kong:<br />
Information for Pilot, 2002, p. 5.]<br />
174. Hong Kong Observatory 1997–98, Hong Kong, Government Printer, 1998,<br />
p. 2.<br />
175. Hong Kong Observatory website, .<br />
176. Civil Aviation Department, Annual Report of the Director of Civil Aviation, Hong<br />
Kong, 1948/49–49/50; Civil Aviation Department, Annual Departmental Report<br />
by the Director of Civil Aviation for the Financial year, Hong Kong, Government<br />
Printer, 1952/53–75/76; Civil Aviation Department, An Annual Review by the<br />
Director of Civil Aviation for the Financial Year, Hong Kong, Government Printer,<br />
1976/77–80/81; Civil Aviation Department, Annual Review of Civil Aviation in<br />
Hong Kong by the Director of Civil Aviation for the Financial Year, Hong Kong,<br />
1981/82–1994/95; Civil Aviation Department, Review of Civil Aviation in Hong<br />
Kong by the Director of Civil Aviation, Hong Kong, 1997/98–2001/02.<br />
177. 2002 c 6 à 5 ø¬è„…††ÑOó¾Kó$s [Interview with Director of<br />
Hong Kong Observatory, Mr C. Y. Lam, 5 June 2002.]<br />
178. Watts, I. E. M., Hong Kong Annual Departmental Report by the Director, Royal<br />
Observatory for the Financial Year 1960–61, Hong Kong, Government Printer,<br />
1961, p. 19.<br />
179. ·ÚCø…¹. 1984 c 7 à 31 ø [Wah Kiu Yat Po, 31 July 1984.]<br />
180. ()„…†.¾()mn’“és{|…Ë)21u¿.().2001 [Hong Kong<br />
Observatory, ‘Environmental Radiation Monitoring in Hong Kong Report<br />
No. 21’, Hong Kong, 2001.]<br />
181. Hong Kong Observatory website, ; \….¾®<br />
•E–’“¿.·…®…¹. 1999 c 11 à 5 ø[Zhang Wenlan, Tan ziwaixian<br />
fushe (On UV Radiation), Wen Wei Po, 5 November 1999].<br />
182. ·¯Òø…¹. 1999 c 10 à 16 ø [Apple Daily, 16 October 1999.]<br />
183. †þ$J,m×HwÈ[Environmental Protection Administration of Taiwan<br />
website]. <br />
184. World Health Organisation, Intersun Global UV Project website, _Ç°*±w.qO£¢²•E–z<br />
³´v. ·:9„µ¹. 1999 c 5 à.[Chimei website, ‘How to Read UV<br />
Levels’ from Health Magazine, May 1999].<br />
185. Hong Kong Observatory website, .<br />
186. ·u…¹. 2000 c 3 à 24 ø [Sing Pao Daily News, 24 March 2000.]<br />
187. ·}…¹. 1999 c 10 à 16 ø [Ming Pao, 16 October 1999.]
Notes<br />
‘Weather Radar Observation’].<br />
191. º»¼.qš½9ÁK „àj¹v [Ginn, Wing-lui, (Tai Mo Shan’s Most<br />
Advanced Weather Radar)].<br />
192. Doberck, W., Observations and Researches Made at the Hong Kong Observatory, in<br />
the Year 1884, Hong Kong, Noronha & Co., 1885, p. 127.<br />
193. Doberck, W., Observations and Researches Made at the Hong Kong Observatory, in<br />
the Year 1886, Hong Kong, Noronha & Co., 1887, p. i.<br />
194. Doberck, W., Observations Made at The Hong Kong Observatory, in the Year 1888,<br />
Hong Kong, Noronha & Co., 1889, p. 1.<br />
195. Royal Observatory, Hong Kong, Director’s Report, 1890, Hong Kong,<br />
pp. 1–4.<br />
196. ·ÚDø…¹. 1904 c 1 à 1 ø [Huazi ribao, 1 January 1904.]<br />
197. Royal Observatory, Hong Kong, Hong Kong Storm Signals, Hong Kong, 1938,<br />
p. 2.<br />
198. Doberck, W., Observations and Researches Made at the Hong Kong Observatory, in<br />
the Year 1884, Hong Kong, Noronha & Co., 1885, p. 120.<br />
199. ·ÚDø…¹. 1897 c 9 à 20 ø [Huazi ribao, 20 September 1897.]<br />
200. ·ÚDø…¹. 1903 c 6 à 22 ø [Huazi ribao, 22 June 1903.]<br />
201. Royal Observatory, Hong Kong, Hong Kong Storm Signals, Hong Kong, 1938,<br />
p. 2.<br />
202. Hong Kong Observatory, Hong Kong Typhoons (pamphlet), Table XVII, Hong<br />
Kong, p. 18.<br />
203. Director of Royal Observatory, Hong Kong, ‘Memorandum on the<br />
Circumstances Which Led to the Introduction of the Hong Kong Storm<br />
Warning Codes of 1917’, File No. 23, Meteorological Messages & Storm Warnings<br />
(1916–1933), Hong Kong, Royal Observatory, 7 November 1917.<br />
204. Royal Observatory, Hong Kong, ‘Letter From the Chief Secretary of Hong<br />
Kong to the Inspectorate General of Customs of Peking’, Royal Observatory<br />
Correspondence, No. 4261, General, Hong Kong, 14 January 1918.<br />
205. ‘Report of the Director of the Royal Observatory, Hong Kong, for the Year<br />
1917’, Hong Kong Administrative Reports, 1917, Appendix F, Hong Kong,<br />
Noronha & Co., 1918, F7.<br />
206. Government Notification No. 283, Hong Kong, The Hong Kong Government<br />
Gazette, 15 June 1917.<br />
207. Letter from Director of Royal Observatory, Hong Kong to Father Gauthier<br />
on 31 March 1919, File No. 23, Meteorological Messages & Storm Warnings (1916–<br />
Kong; ‘Report of the Director of the Royal Observatory, Hong Kong, for the<br />
Year 1921’, Hong Kong Administrative Reports, 1921, Appendix F, Hong Kong,<br />
Noronha & Co., 1922, F8.<br />
209. Royal Observatory, Hong Kong, ‘Hong Kong Local Storm Signal Code’, File<br />
No. 23, Meteorological Messages & Storm Warnings (1916–1933), Hong Kong,<br />
Royal Observatory.<br />
210. ·ÚDø…¹. 1907 c 6 à 4 ø_1907 c 7 à 31 ø [Huazi ribao, 4 June 1907;<br />
31 July 1907.]<br />
211. Royal Observatory, Hong Kong, Hong Kong Storm Signals, Hong Kong, 1938,<br />
p. 1.<br />
212. Hong Kong Observatory website, .<br />
213. ·:Éø…¹. 1927 c 2 à 28 ø [Gongshang ribao, 28 February 1927.]<br />
214. ·:Éø…¹. 1934 c 12 à 12 ø [Gongshang ribao, 12 December 1934.]<br />
215. ·ÚCø…¹. 1973 c 3 à 16 ø [Wah Kiu Yat Po, 16 March 1973.]<br />
216. ·ÚDø…¹. 1923 c 8 à 24 ø [Huazi ribao, 24 August 1923.]<br />
217. ·EFø…¹. 1976 c 1 à 12 ø [Sing Tao Daily, 12 January 1976.]<br />
218. Hong Kong Hansard 1923, ‘Hong Kong Legislative Council’, 30 August 1923,<br />
pp. 78-83_·ÚDø…¹. 1923 c 8 à 23 ø[Huazi ribao, 23 August 1923]<br />
219. The Hong Kong Government Gazette, 22 June 1923, Hong Kong, Noronha &<br />
Co., 1924, p. 207_·ÚDø…¹.1921c5à9ø[Huazi ribao, 9 May 1921]<br />
220. ·ÚDø…¹. 1927 c 8 à 22 ø8 23 ø [Huazi ribao, 22–23 August 1927.]<br />
221. ·ÚCø…¹.1968c8à25ø_1960c6à19ø [Wah Kiu Yat Po, 25 August<br />
1968; 19 June 1960.]<br />
222. ·ÚDø…¹. 1906 c 11 à 2 ø [Huazi ribao, 2 November 1906.]<br />
223. ·ÚDø…¹. 1906 c 11 à 2 ø [Huazi ribao, 2 November 1906.]<br />
224. ïð()„…†.·)*¹.(). 1992 c [Royal Observatory, Typhoon,<br />
Hong Kong, 1992.]<br />
225. ‘Correspondence Regarding the Typhoon Shelter at Mongkoktsui and the<br />
Proposed Temporary Increase in Light Dues’, Hong Kong Sessional Papers,<br />
No. 24, 1908, Hong Kong, Noronha & Co., 1909, pp. 506–507.<br />
226. The Hong Kong Government Gazette, 15 July 1910, Hong Kong Government,<br />
1911, p. 280.<br />
227. Hong Kong Sessional Papers, ‘Typhoon Refuge’, No. 17, 1915, Hong Kong,<br />
Noronha & Co., 1916, p. 53.<br />
228. ·ÚCø…¹. 1960 c 6 à 19 ø [Wah Kiu Yat Po, 19 June 1960.]<br />
229. ·EFø…¹. 1949 c 8 à 8 ø [Sing Tao Daily, 8 August 1949.]<br />
230. Hong Kong Blue Book, Hong Kong, Noronha Co., 1848–1857; Hong Kong<br />
Sessional Paper No. 30/91, No. 26/97, No. 16/1901, No. 17/1911,<br />
1933), Hong Kong, Royal Observatory.<br />
No. 15/1921 and No. 5/1931, Hong Kong, Government Printer;<br />
362 363<br />
208. Royal Observatory, Hong Kong, Hong Kong Typhoon Signals (pamphlet) Hong<br />
S. Young, Report on the 1961 Census, Hong Kong, Government Printer,<br />
#<br />
$
1961–62; Report on the 1966 By-Census, Hong Kong, Government Printer,<br />
1968; D. R. Rick, Hong Kong By-Census, 1976: Main Report, Hong Kong,<br />
Government Printer, 1978–79; Hong Kong 1981 Census: Main Report, Hong<br />
Kong, Government Printer, 1982_J>Ùf¦.·1996 c&—ÊÙfF}…<br />
˹.().1996 [Census and Statistics Department,1996 Population by Census,<br />
Summary Result, Hong Kong, 1996]_J>Ùf¦.·—ÊÐG 2001 F}…<br />
˹.(). 2001 [Census and Statistics Department, 2001 Population Census<br />
Summary Result, Hong Kong, 2001]<br />
231. Hong Kong Statistics, 1947–1967, Hong Kong, 1969; Young, S., Report on the<br />
1961 Census, Hong Kong, Government Printer, 1961-62; Hong Kong 1981<br />
Census Main Report Volume 1, Hong Kong, Government Printer, 1982; Annual<br />
Departmental Report by the Commissioner for Resettlement, Hong Kong, Government<br />
Printer 1968/69-72/73; Hong Kong Housing Authority Annual Report, Hong<br />
Kong, The Housing Authority, 1973/74-96/97; Hong Kong 1986 by Census<br />
Main Report Volume 1, Hong Kong, Government Printer, 1988; Census and<br />
Statistics Department, Hong Kong 1991 Population Census Main Report, Hong<br />
Kong, 1992_J>Ùf¦.·—ÊÐG 2001 |}…ËN)+W¹.(). 2001<br />
[Census and Statistics Department, Hong Kong 2001 Population Census Main<br />
Report, Hong Kong, Vol. 1., 2001]<br />
232. ·:Éø…¹. 1936 c 8 à 17 ø [Gongshang ribao, 17 August 1936.]<br />
233. ·EFø…¹. 1968 c 8 à 22 ø [Sing Tao Daily, 22 August 1968.]<br />
234. ·:Éø…¹. 1971 c 8 à 20 ø [Gongshang ribao, 20 August 1971.]<br />
235. ·EFø…¹. 1975 c 10 à 15 ø_·}…¹. 1975 c 10 à 15 ø [Sing Tao<br />
Daily, 15 October 1975_Ming Pao, 15 October 1975.]<br />
236. ·EFø…¹. 1979 c 8 à 3 ø [Sing Tao Daily, 3 August 1979.]<br />
237. ·EFø…¹. 1983 c 9 à 9 ø [Sing Tao Daily, 9 September 1983.]<br />
238. ·EFø…¹. 1996c 2à 24ø_1999c 12à 18ø_1999c 12à 19ø [Sing<br />
Tao Daily, 24 February 1996; 18 December 1999; 19 December 1999.]<br />
239. Â9I.·()'J:.k¹.().¬^: ¦. 2002 [Chan, Kin-sek, The<br />
Safety of Hong Kong Slopes, Hong Kong, Geotechnical Office, 2002.]<br />
Notes<br />
364