Benchmark Test for a Computer Simulated Person - Aalborg ...
Benchmark Test for a Computer Simulated Person - Aalborg ...
Benchmark Test for a Computer Simulated Person - Aalborg ...

You also want an ePaper? Increase the reach of your titles
YUMPU automatically turns print PDFs into web optimized ePapers that Google loves.
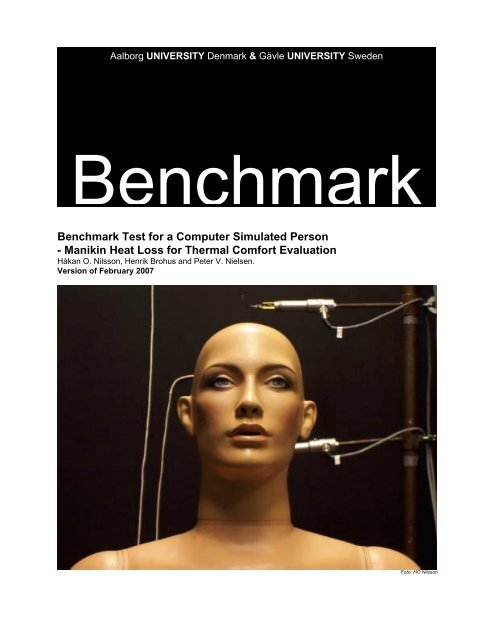
<strong>Aalborg</strong> UNIVERSITY Denmark & Gävle UNIVERSITY Sweden<br />
<strong>Benchmark</strong><br />
<strong>Benchmark</strong> <strong>Test</strong> <strong>for</strong> a <strong>Computer</strong> <strong>Simulated</strong> <strong>Person</strong><br />
- Manikin Heat Loss <strong>for</strong> Thermal Com<strong>for</strong>t Evaluation<br />
Håkan O. Nilsson, Henrik Brohus and Peter V. Nielsen.<br />
Version of February 2007<br />
Foto: HO Nilsson
Version of February 2007<br />
<strong>Benchmark</strong> <strong>Test</strong>s <strong>for</strong> a <strong>Computer</strong> <strong>Simulated</strong> <strong>Person</strong><br />
- Manikin Heat Loss <strong>for</strong> Thermal Com<strong>for</strong>t Evaluation<br />
Introduction<br />
Håkan O. Nilsson, Henrik Brohus and Peter V. Nielsen.<br />
Version of February 2007<br />
Researchers around the world have developed many different configurations in order to represent<br />
a computer simulated person (CSP) or a virtual CFD manikin. These manikins are different with<br />
respect to size, <strong>for</strong>m, heat generation, turbulence models and computer codes used, etc. The<br />
variations reflects the various possibilities and limitations in software as well as different subjects<br />
of interest as manikin effects on the airflow, thermal com<strong>for</strong>t as well as pollutant production and<br />
exposure. The levels of detail are also of great interest as well as recommendations on how and<br />
when to simplify the CSP. This evolution can be shown with the following examples:<br />
<strong>Simulated</strong> Occupant Computational Thermal Manikin Berkeley Com<strong>for</strong>t Model<br />
Gan (1994) Murakami et. al. (1997) Huizenga et. al. (2001)<br />
Nielsen et. al. (2003) introduced two benchmark tests focusing on the airflow around virtual<br />
thermal manikins or CSPs. The new benchmark test described here will focus on the different<br />
heat losses from the manikin with the aim to predict how humans will react to different climatic<br />
situations and is developed in cooperation between <strong>Aalborg</strong> University and the University of<br />
Gävle, Sweden. The earlier mixing ventilation benchmark test has been developed by <strong>Aalborg</strong><br />
University within the framework of the International Centre <strong>for</strong> Indoor Environment and Energy,<br />
and the displacement ventilation case has been developed at the University of Tokyo and Keio<br />
University.<br />
This paper introduces a benchmark test <strong>for</strong> a CFD manikin or a CSP. This test is evaluated in full<br />
scale to get measurements <strong>for</strong> comparison with CFD predictions. The idea behind a CFD manikin<br />
benchmark test, which define the boundary conditions around a real as well as CFD manikin,<br />
have the following reasons: If different versions of virtual CFD manikins can be tested with the<br />
same boundary conditions, it is possible to make comparisons, and perhaps make some new<br />
decisions on geometrical level of details of the design, turbulence model used, type of grid etc.<br />
This will hopefully lead to a more focused development of a simplified, comparable, easy to use<br />
Page 2 of 7
Version of February 2007<br />
virtual CFD manikin with respect to both geometrical and physiological properties also taking<br />
into account usability and limitations. This research will give us some general requirements <strong>for</strong><br />
the design and development of future computer manikins and CFD manikin systems.<br />
The manikin heat loss benchmark test aims at connecting results from human experiments and<br />
thermal manikin measurements to develop a methodology based on a virtual manikin positioned<br />
in a CFD simulated environment. The results can be presented not only as whole body influence,<br />
but also with local in<strong>for</strong>mation on how the thermal climate varies over the human body (Nilsson<br />
2004). The development of virtual models is an efficient complement to traditional evaluation of<br />
the thermal environment.<br />
Manikin Heat Loss Case<br />
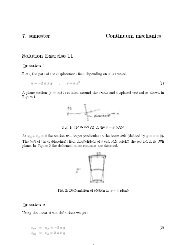
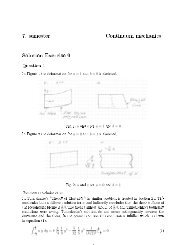
The experimental setup is a box shaped geometry with a window on the side and dimensions<br />
X×Y×Z = 2.44×2.46×1.2 m (Figure 1). The incoming air is supplied in the full cross sectional<br />
area in front of the manikin. This unidirectional flow field is evacuated thru two circular exhaust<br />
openings behind the thermal manikin (Figure 2). The manikin is seated at a distance of 0.7 m<br />
from the inlet in the centre of the wind tunnel. Air velocities were measured with hot-sphere<br />
anemometers (Dantec Dynamics 32 channel indoor flow system with 54T21 transducers) in 5<br />
levels in front of and behind the manikin. Another measuring stick was used to measure the<br />
temperatures at 4 levels (0.1, 0.6, 1.1 and 1.5) to the right close to the manikin. The air was<br />
supplied at 0.27 m/s from a surrounding laboratory hall with a mean temperature of 20.4°C.<br />
y<br />
x<br />
z<br />
Figure 1. The geometry and coordinate system of the wind tunnel test environment at <strong>Aalborg</strong><br />
University. The inlet to the left and the two exhaust holes to the right.<br />
The measurements were made with a female manikin Com<strong>for</strong>tina (pt-teknik.dk) Madsen (1999).<br />
The manikin run in constant surface temperature mode at 34ºC, without clothing in order to get<br />
fast and accurate heat loss levels. The manikin was seated facing a unidirectional flow field<br />
similar to the flow field used in the previously benchmarked mixing ventilation case (Topp C et.<br />
al. 2003), see Figure 2. The flow field situation was made as identical to the earlier “Mixing<br />
Ventilation <strong>Benchmark</strong>” Nielsen et. al. (2003) with the intention that flow field data will be<br />
interchangeable and comparable between the two tests.<br />
Page 3 of 7
Version of February 2007<br />
Figure 2. The manikin was positioned centred inside the tunnel with the arms hanging down and<br />
no clothing or hair. To the left a view thru the window and towards the front inlet and to the right<br />
the manikin and one of the two exhausts <strong>for</strong> recirculation of the air.<br />
Table 1. Coordinates and positions of the sensors during the measurements.<br />
Thermal manikin: Com<strong>for</strong>tina, No clothing, Software 3.0.30.<br />
Body Segments<br />
Top of head<br />
1 L. Foot<br />
2 R. Foot<br />
3 L. Low leg<br />
Head Back<br />
4 R. Low leg<br />
5 L. Thigh<br />
R. Upper arm<br />
Chest<br />
L. Upper arm<br />
6 R. Thigh<br />
7 Pelvis<br />
8 Head<br />
R. Forearm<br />
Pelvis<br />
9 Top of head<br />
L. Forearm<br />
10 L. Hand<br />
R. Thigh L. Thigh<br />
L. Hand<br />
R. Low leg<br />
L. Low leg<br />
15 R. Upper arm<br />
16 Chest<br />
R. Foot<br />
L. Low leg<br />
17 Back<br />
18 All<br />
11<br />
13<br />
R. Hand<br />
R. Forearm<br />
R. Hand<br />
12<br />
14<br />
L. Forearm<br />
L. Upper arm<br />
Temperatures:<br />
Position<br />
Fluke Helios Plus 2287A with 40<br />
Thermocouple Channels.<br />
Coordinates<br />
x y z<br />
1 Vertical 1 -1.08 0.2 0.6<br />
2 Vertical 2 -1.08 0.4 0.6<br />
3 Vertical 3 -1.08 0.6 0.6<br />
4 Vertical 4 -1.08 0.8 0.6<br />
5 Vertical 5 -1.08 1 0.6<br />
6 Vertical 6 -1.08 1.2 0.6<br />
7 Vertical 7 -1.08 1.4 0.6<br />
8 Vertical 8 -1.08 1.6 0.6<br />
9 Vertical 9 -1.08 1.8 0.6<br />
10 Vertical 10 -1.08 2 0.6<br />
Page 4 of 7
Version of February 2007<br />
11 Vertical 11 -1.08 2.2 0.6<br />
12 Vertical 12 -1.08 2.4 0.6<br />
13 Vertical 13 2.19 0.2 0.25<br />
14 Vertical 14 2.19 0.4 0.25<br />
15 Vertical 15 2.19 0.6 0.25<br />
16 Vertical 16 2.19 0.8 0.25<br />
17 Vertical 17 2.19 1 0.25<br />
18 Vertical 18 2.19 1.2 0.25<br />
19 Vertical 19 2.19 1.4 0.25<br />
20 Vertical 20 2.19 1.6 0.25<br />
21 Vertical 21 2.19 1.8 0.25<br />
22 Vertical 22 2.19 2 0.25<br />
23 Vertical 23 2.19 2.2 0.25<br />
24 Vertical 24 2.19 2.4 0.25<br />
25 Air 0.1 1.22 0.1 1.1<br />
26 Air 0.6 1.22 0.6 1.1<br />
27 Air 1.1 1.22 1.1 1.1<br />
28 Air 1.5 1.22 1.5 1.1<br />
29 Ceiling 0 2.46 0.6<br />
30 Floor 1.85 0 0.6<br />
31 Floor 0.59 0 0.6<br />
32 Floor 0 0 0.6<br />
33 Mid ceiling 1.22 2.46 0.6<br />
34 Window wall 0.59 1.23 1.2<br />
35 Window wall 1.85 1.23 1.2<br />
36 Door wall 1.85 1.23 0<br />
37 Door wall 0.59 1.23 0<br />
38 Upper outlet 2.44 1.84 0.6<br />
39 Lower outlet 2.44 0.63 0.6<br />
40 Back wall 2.44 1.23 0.6<br />
Dantec Dynamics Indoor Flow System with 5<br />
Air velocities:<br />
54T21 Omnidirectional Transducers.<br />
1 Air vel. 1 0.19 1.300 0<br />
2 Air vel. 2 0.19 1.100 0<br />
3 Air vel. 3 0.19 0.875 0<br />
4 Air vel. 4 0.19 0.550 0<br />
5 Air vel. 5 0.19 0.275 0<br />
6 Air vel. 6 2.19 1.300 0<br />
7 Air vel. 7 2.19 1.100 0<br />
8 Air vel. 8 2.19 0.875 0<br />
9 Air vel. 9 2.19 0.550 0<br />
10 Air vel. 10 2.19 0.275 0<br />
Heat loss measurements have been made <strong>for</strong> the manikin heat loss case and they can be<br />
downloaded in Excel <strong>for</strong>mat from cfd-benchmarks.com in the file<br />
manikin_heat_loss_benchmark_2007.xls. The spreadsheet contains 6 worksheets one <strong>for</strong> each<br />
condition tested as well as a sheet with the mean values of the 6 very similar tests and an<br />
in<strong>for</strong>mation sheet in the beginning. The mean value sheet (MEAN@va0.27ta20) is intended as<br />
the “Manikin Heat Loss <strong>Benchmark</strong>”. Heat losses from the 16 manikin zones and whole body<br />
heat loss as well as air velocities and air temperatures are reported.<br />
Page 5 of 7
Version of February 2007<br />
Numerical Methods and Boundary Conditions<br />
The overall conditions are the same as <strong>for</strong> the mixing ventilation case; with the exception that in<br />
this benchmark is the focus primarily on heat losses not air flows.<br />
CFD code<br />
There are no limitations on the code. The complete origin of the code should be reported in order<br />
to allow comparisons.<br />
<strong>Computer</strong> <strong>Simulated</strong> <strong>Person</strong> (CSP) or CFD manikin<br />
Posture: seated<br />
Geometry: free and if possible reported as journal or macro file<br />
Clothing: no clothing or hair<br />
Heat flux: constant surface temperature at 34ºC resulting in adaptive heat loss<br />
Breathing: no<br />
Grid<br />
There are no restrictions on the grid. The specification of the grid should be stated.<br />
Quality of the CFD prediction<br />
Comments should be made on the quality of the predictions in the same way as the mixing and<br />
displacement ventilation cases.<br />
Results<br />
The heat transfer rate of each manikin segment should be listed in the presentation or in the<br />
report:<br />
• Area and position of each manikin zone (m²)<br />
• Heat loss rate <strong>for</strong> each manikin zone (W/m²)<br />
• Convective heat transfer coefficient <strong>for</strong> each manikin zone (W/m² ºC)<br />
• Radiative heat transfer coefficient <strong>for</strong> each manikin zone (W/m² ºC)<br />
• Temperatures of surrounding surfaces (ºC)<br />
• Characteristics of the air stream, speed (m/s), temperature (ºC) and turbulence intensity (nd.)<br />
according to the coordinates in table1.<br />
Measurements <strong>for</strong> Comparisons in the Manikin Heat Loss Case<br />
In order to furthermore visualise the benchmark situation three movies of the setup was made<br />
(smoke_side_HONilsson.mov, smoke_head_HONilsson.mov and<br />
smoke_outlet_HONilsson.mov) visualising the flow around the manikin with smoke. The moving<br />
pictures try to show the fact that the air stream around the manikin was very stable and<br />
symmetrical.<br />
Page 6 of 7
Version of February 2007<br />
Literature and references<br />
1IMM (1997). Proceedings of a European seminar on Thermal Manikin <strong>Test</strong>ing, (eds. Nilsson H, Holmér<br />
I) Arbetslivsinstitutet, Department of Ergonomics. (download): Arbetslivsrapport 1997:9 (ISSN<br />
1401-2928).<br />
3IMM (1999). Proceedings of the third International Meeting on Thermal Manikin <strong>Test</strong>ing, (eds. Nilsson<br />
H, Holmér I) (download): Arbete & Hälsa 2000:4 (ISBN-7045-554-6. ISSN 0346-7821).<br />
4IMM (2001). Proceedings of the fourth International Meeting on Thermal Manikins. 27 – 28th<br />
September 2001. Hosted by EMPA in St. Gallen, Switzerland (download)<br />
5I3M (2003). Proceedings of the 5th International Meeting on Thermal Manikin and Modelling,<br />
Strasbourg, 29 – 30th September, 2003 (download)<br />
6I3M (2006). Proceedings of the 6th International Thermal Manikin and Modeling Meeting at The Hong<br />
Kong Polytechnic University, Hong Kong SAR. 16 – 18th October 2006. Conference Proceedings<br />
Book (ISBN: 962-367-534-8). (download)<br />
7I3M (2008). The seventh meeting (7I3M) 7th International Thermal Manikin and Modeling is scheduled<br />
to take place sometime during the year of 2008. The venue is still to be decided by a committee<br />
based on previous organisers (Ingvar Holmér, Håkan Nilsson, Mark Richards, Victor Candas and<br />
Jintu Fan). You are welcome to mail your application with a short description of the event to the<br />
Board of Organisers.<br />
Gan G (1994) Numerical Method <strong>for</strong> a full Assessment of Indoor Thermal Com<strong>for</strong>t. International journal<br />
of indoor air quality and climate, Munksgaard, vol 4, no 3, pp 154-168.<br />
Huizenga C, Hui Z & Arens E (2001) A model of human physiology and com<strong>for</strong>t <strong>for</strong> assesing complex<br />
thermal environments. Building and Environment, elsevier.com, no 36, 691-699.<br />
Murakami S, Kato S & Zeng J (1997) Flow and Temperature Fields Around Human Body with Various<br />
Room Air Distribution: CFD Study on Computational Thermal Manikin - Part I. ASHRAE<br />
Transactions, ashrae.org, vol 103 part 1, pp 3-15.<br />
Nilsson HO, 2004. "Com<strong>for</strong>t climate evaluation with thermal manikin methods and computer simulation<br />
models". Royal Institute of Technology, University of Gävle and The Swedish National Institute <strong>for</strong><br />
Working Life. (free download) Arbete och Hälsa 2004:2. ISBN 91–7045–703–4, ISBN 91–7283–<br />
693–8, ISSN 0346–7821.<br />
Peter V. Nielsen, Shuzo Murakami, Shinsuke Kato, Claus Topp and Jeong-Hoon Yang, 2003. <strong>Benchmark</strong><br />
<strong>Test</strong>s <strong>for</strong> a <strong>Computer</strong> <strong>Simulated</strong> <strong>Person</strong>. Version of 7 November 2003. <strong>Aalborg</strong> Universitet,<br />
Denmark.<br />
T. L. Madsen, 1999. Development of a Breathing Thermal Manikin, Proceedings of the Third<br />
International Meeting on Thermal Manikin <strong>Test</strong>ing, 3IMM, National Institute <strong>for</strong> Working Life,<br />
Stockholm.<br />
Topp, C., Hesselholt, P., Trier, M. R. and Nielsen, P. V. (2003). Influence of Geometry of Thermal<br />
Manikins on Concentration Distribution and <strong>Person</strong>al Exposure. Proceedings of Healthy Buildings<br />
2003, Singapore.<br />
ISO 14505, Ergonomics of the thermal environment -- Evaluation of thermal environments in vehicles.<br />
Part 1: ISO 14505-2:2007 Principles and methods <strong>for</strong> assessment of thermal stress.<br />
Part 2: ISO 14505-2:2006 Determination of Equivalent Temperature.<br />
Part 3: ISO 14505-3:2006 Evaluation of thermal com<strong>for</strong>t using human subjects.<br />
Part 4: ISO/NWI 14505-4 Principles and methods <strong>for</strong> computer simulation of vehicle climate.<br />
Page 7 of 7