Yardeni Research - Dr. Ed Yardeni's Economics Network
Yardeni Research - Dr. Ed Yardeni's Economics Network
Yardeni Research - Dr. Ed Yardeni's Economics Network

You also want an ePaper? Increase the reach of your titles
YUMPU automatically turns print PDFs into web optimized ePapers that Google loves.
2420<br />
2020<br />
1620<br />
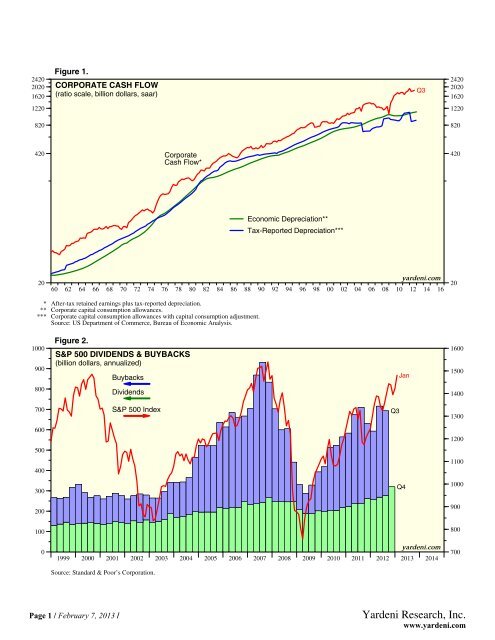
Figure 1.<br />
CORPORATE CASH FLOW<br />
(ratio scale, billion dollars, saar)<br />
Q3<br />
2420<br />
2020<br />
1620<br />
1220<br />
1220<br />
820<br />
820<br />
420<br />
Corporate<br />
Cash Flow*<br />
420<br />
Economic Depreciation**<br />
Tax-Reported Depreciation***<br />
20<br />
yardeni.com<br />
60 62 64 66 68 70 72 74 76 78 80 82 84 86 88 90 92 94 96 98 00 02 04 06 08 10 12 14 16<br />
20<br />
* After-tax retained earnings plus tax-reported depreciation.<br />
** Corporate capital consumption allowances.<br />
*** Corporate capital consumption allowances with capital consumption adjustment.<br />
Source: US Department of Commerce, Bureau of Economic Analysis.<br />
1000<br />
900<br />
Figure 2.<br />
S&P 500 DIVIDENDS & BUYBACKS<br />
(billion dollars, annualized)<br />
Buybacks<br />
Jan<br />
1600<br />
1500<br />
800<br />
Dividends<br />
1400<br />
700<br />
S&P 500 Index<br />
Q3<br />
1300<br />
600<br />
1200<br />
500<br />
400<br />
1100<br />
300<br />
Q4<br />
1000<br />
200<br />
900<br />
100<br />
800<br />
0<br />
1999 2000 2001 2002 2003 2004 2005 2006 2007 2008 2009 2010 2011 2012 2013 2014<br />
Source: Standard & Poor’s Corporation.<br />
yardeni.com<br />
700<br />
Page 1 / February 7, 2013 /<br />
<strong>Yardeni</strong> <strong>Research</strong>, Inc.<br />
www.yardeni.com