
You also want an ePaper? Increase the reach of your titles
YUMPU automatically turns print PDFs into web optimized ePapers that Google loves.
Section <strong>3.1</strong> <strong>Quadratic</strong> <strong>Functions</strong> 1<br />
<strong>3.1</strong> <strong>Quadratic</strong> <strong>Functions</strong><br />
<strong>Functions</strong><br />
Let’s quickly review again the definition of a function.<br />
Definition 1<br />
A relation is a function if and only if each object in its domain is paired with one<br />
and only one object in its range.<br />
Consider the relation R.<br />
R = { (0, 1), (0, 2), (3, 4) }<br />
The domain is {0, 3} and the range is {1, 2, 4}. Note that the number 0 in the domain<br />
of R is paired with two numbers from the range, namely, 1 and 2. Therefore, R is not<br />
a function.<br />
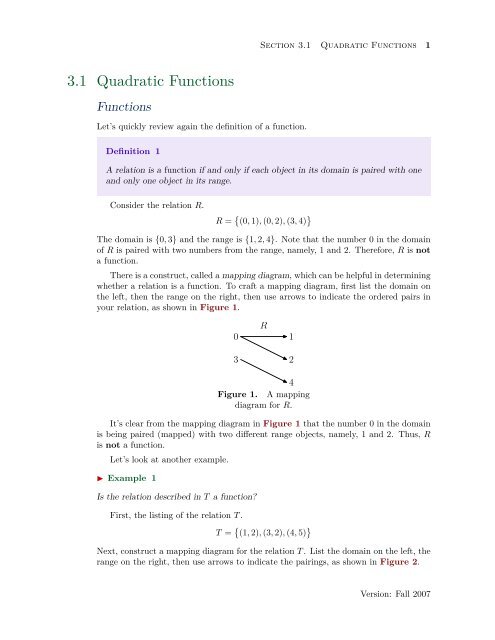
There is a construct, called a mapping diagram, which can be helpful in determining<br />
whether a relation is a function. To craft a mapping diagram, first list the domain on<br />
the left, then the range on the right, then use arrows to indicate the ordered pairs in<br />
your relation, as shown in Figure 1.<br />
0<br />
3<br />
R<br />
1<br />
2<br />
4<br />
Figure 1. A mapping<br />
diagram for R.<br />
It’s clear from the mapping diagram in Figure 1 that the number 0 in the domain<br />
is being paired (mapped) with two different range objects, namely, 1 and 2. Thus, R<br />
is not a function.<br />
Let’s look at another example.<br />
◮ Example 1<br />
Is the relation described in T a function<br />
First, the listing of the relation T .<br />
T = { (1, 2), (3, 2), (4, 5) }<br />
Next, construct a mapping diagram for the relation T . List the domain on the left, the<br />
range on the right, then use arrows to indicate the pairings, as shown in Figure 2.<br />
Version: Fall 2007
2 Chapter 3<br />
1<br />
3<br />
T<br />
2<br />
5<br />
4<br />
Figure 2. A mapping<br />
diagram for T .<br />
From the mapping diagram in Figure 2, we can see that each domain object on the<br />
left is paired (mapped) with exactly one range object on the right. Hence, the relation<br />
T is a function.<br />
Let’s summarize our review about functions.<br />
Summary 1<br />
A function consists of three parts:<br />
1. a set of objects which mathematicians call the domain,<br />
2. a second set of objects which mathematicians call the range,<br />
3. and a rule that describes how to assign a unique range object to each object<br />
in the domain.<br />
We now turn our attention to a particular type of function, the quadratic function<br />
The <strong>Quadratic</strong> Function<br />
There are several forms that a quadratic function can take on. The first we’ll review is<br />
called Standard Form.<br />
Note that the coefficients a, b, and c are real values.<br />
f(x) = ax 2 + bx + c. (<strong>3.1</strong>)<br />
Let’s now review how to draw the graph of the quadratic function. The form that<br />
is most useful for this task is known as Vertex Form and is given by the equation<br />
f(x) = a(x − h) 2 + k. (3.2)<br />
Recall that the graph of the quadratic function is shaped like a "U" and is called a<br />
parabola. The form of the quadratic function in equation (3.2) is called vertex form,<br />
because the form easily reveals the vertex or “turning point” of the parabola. Each of<br />
the constants in the vertex form of the quadratic function plays a role. The constant a<br />
controls the scaling (stretching or compressing of the parabola), the constant h controls<br />
a horizontal shift and placement of the axis of symmetry, and the constant k controls<br />
the vertical shift.<br />
Version: Fall 2007
Section <strong>3.1</strong> <strong>Quadratic</strong> <strong>Functions</strong> 3<br />
First let’s review what the scaling factor of the quadratic does to the graph.<br />
Property 1<br />
• If a is a constant larger than 1, that is, if a > 1, then the graph of g(x) = ax 2 ,<br />
when compared with the graph of f(x) = x 2 , is stretched.<br />
• If a is a constant smaller than 1 (but larger than zero), that is, if 0 < a < 1,<br />
then the graph of g(x) = ax 2 , when compared with the graph of f(x) = x 2 , is<br />
compressed.<br />
Also, we need to keep in mind what happens when −1 < a < 0. In this case we get<br />
a vertical reflection. That is the parabola is reflected across the x − axis.<br />
Property 2<br />
• If −1 < a < 0, then the graph of g(x) = ax 2 , when compared with the graph<br />
of f(x) = x 2 , is compressed, then reflected across the x-axis.<br />
• If a < −1, then the graph of g(x) = ax 2 , when compared with the graph of<br />
f(x) = x 2 , is stretched, then reflected across the x-axis.<br />
Now that we have reviewed what the scaling factor a does to the graph of a<br />
quadratic function, let’s remind ourselves what the value of h does to the graph. Recall<br />
that the value of h translates our parabola h units to the left or the right of the origin.<br />
Property 3<br />
• If h > 0, then the graph of g(x) = (x − h) 2 is shifted h units to the right of the<br />
graph of f(x) = x 2 .<br />
• If h < 0, then the graph of g(x) = (x − h) 2 is shifted c units to the left of the<br />
graph of f(x) = x 2 .<br />
Now let’s look at the last value in f(x) = a(x − h) 2 + k, namely k. Recall that the<br />
value of k controls the amount of vertical translation.<br />
Version: Fall 2007
4 Chapter 3<br />
Property 4<br />
• If k > 0, the graph of g(x) = x 2 + k is shifted k units upward from the graph<br />
of f(x) = x 2 .<br />
• If k < 0, the graph of g(x) = x 2 +k is shifted k units downward from the graph<br />
of f(x) = x 2 .<br />
Vertex of a Parabola<br />
Now that we have a quick review of what role each of the values in the vertex form<br />
(f(x) = a(x − h) 2 + k) of a quadratic function plays. Notice that the vertex of the<br />
parabola will have coordinates given by (h, k). Consider the following example.<br />
◮ Example 2<br />
Find the vertex of the graph of y = −(x + 2) 2 + 3.<br />
To do this we need to write the equation in vertex form.<br />
y = a(x − h) 2 + k<br />
y = −(x + 2) 2 + 3<br />
y = −1(x − (−2)) 2 + 3<br />
By inspection we now see that a = −1, h = −2, and k = 3. This gives us that the<br />
coordinates of the vertex are at (−2, 3) and that parabola has been reflected to open<br />
downward.<br />
One last piece of the puzzle to review before we return to our example. Recall the<br />
definition of the axis of symmetry<br />
The graph of y = x 2 is symmetric with respect to the y-axis. One half of the<br />
parabola is a mirror image of the other with respect to the y-axis. We say the y-axis is<br />
acting as the axis of symmetry. If we translate our parabola, then the axis of symmetry<br />
will also be translated. Let’s finish the example we started.<br />
◮ Example 3<br />
Sketch the graph of y = −(x + 2) 2 + 3.<br />
Analyze the equation y = −(x + 2) 2 + 3. The minus sign tells us that the parabola<br />
“opens downward.” The presence of x+2 indicates a shift of 2 units to the left. Finally,<br />
adding the 3 will shift the graph 3 units upward. Thus, we have a parabola that “opens<br />
downward” with vertex at (−2, 3). This is shown in Figure 3.<br />
Version: Fall 2007
Section <strong>3.1</strong> <strong>Quadratic</strong> <strong>Functions</strong> 5<br />
(−2, 3)<br />
y<br />
5<br />
x<br />
5<br />
x = −2<br />
Figure 3. The axis of symmetry<br />
passes through the vertex.<br />
The axis of symmetry passes through the vertex (−2, 3) in Figure 3 and has equation<br />
x = −2. Note that the right half of the parabola is a mirror image of its left half<br />
across this axis of symmetry. If we need more accuracy then we can use the axis of<br />
symmetry and a few well chosen points to do so.<br />
• Start by plotting the vertex and axis of symmetry as shown in Figure 4(a).<br />
• Next, compute two points on either side of the axis of symmetry. We choose x = −1<br />
and x = 0 and compute the corresponding y-values using the equation y = −(x +<br />
2) 2 + 3.<br />
x y = −(x + 2) 2 + 3<br />
−1 2<br />
0 −1<br />
Plot the points from the table, as shown in Figure 4(b).<br />
• Finally, plot the mirror images of these points across the axis of symmetry, as shown<br />
in Figure 4(c).<br />
(−2, 3)<br />
y<br />
5<br />
(−2, 3)<br />
y<br />
5<br />
(−2, 3)<br />
y<br />
5<br />
x<br />
5<br />
x<br />
5<br />
x<br />
5<br />
x = −2<br />
x = −2<br />
x = −2<br />
(a) (b) (c)<br />
Figure 4. Using the axis of symmetry to establish accuracy.<br />
Version: Fall 2007
6 Chapter 3<br />
The image in Figure 4(c) clearly contains enough information to complete the graph<br />
of the parabola having equation y = −(x + 2) 2 + 3 in Figure 5.<br />
(−2, 3)<br />
y<br />
5<br />
x<br />
5<br />
x = −2<br />
Figure 5. An accurate plot of y =<br />
−(x + 2) 2 + 3.<br />
Let’s summarize what we’ve reviewed so far.<br />
Summary 2<br />
The form of the quadratic function<br />
f(x) = a(x − h) 2 + k<br />
is called vertex form. The graph of this quadratic function is a parabola.<br />
1. The graph of the parabola opens upward if a > 0, downward if a < 0.<br />
2. If the magnitude of a is larger than 1, then the graph of the parabola is stretched<br />
by a factor of a. If the magnitude of a is smaller than 1, then the graph of the<br />
parabola is compressed by a factor of 1/a.<br />
3. The parabola is translated h units to the right if h > 0, and h units to the left<br />
if h < 0.<br />
4. The parabola is translated k units upward if k > 0, and k units downward if<br />
k < 0.<br />
5. The coordinates of the vertex are (h, k).<br />
6. The axis of symmetry is a vertical line through the vertex whose equation is<br />
x = h.<br />
Domain and Range of a <strong>Quadratic</strong> Function<br />
Let’s review how to find the domain and range a quadratic function. Consider the<br />
quadratic function given by f(x) = 2(x − 2) 2 − 3. Recall that the domain is the set of<br />
“permissible x-values.” This means that the domain is all real numbers, which we can<br />
write as follows: Domain = R or Domain = (−∞, ∞).<br />
Version: Fall 2007
Section <strong>3.1</strong> <strong>Quadratic</strong> <strong>Functions</strong> 7<br />
You can also project each point on the graph of f(x) = 2(x−2) 2 −3 onto the x-axis,<br />
as shown in Figure 6(a). If you do this, then the entire axis will “lie in shadow,” so<br />
once again, the domain is all real numbers.<br />
y<br />
5<br />
y<br />
5<br />
x<br />
5<br />
x<br />
5<br />
−3<br />
(a)<br />
(b)<br />
Figure 6. Projecting to find (a)<br />
the domain and (b) the range.<br />
To determine the range of the function f(x) = 2(x − 2) 2 − 3, project each point<br />
on the graph of f onto the y-axis, as shown in Figure 6(b). On the y-axis, all points<br />
greater than or equal to −3 “lie in shadow,” so the range is described with Range =<br />
{y : y ≥ −3} = [−3, ∞).<br />
The following summarizes how one finds the domain and range of a quadratic function<br />
that is in vertex form.<br />
Summary 3<br />
The domain of the quadratic function<br />
f(x) = a(x − h) 2 + k,<br />
regardless of the values of the parameters a, h, and k, is the set of all real numbers,<br />
easily described with R or (−∞, ∞). On the other hand, the range depends upon<br />
the values of a and k.<br />
• If a > 0, then the parabola opens upward and has vertex at (h, k). Consequently,<br />
the range will be<br />
[k, ∞) = {y : y ≥ k}.<br />
• If a < 0, then the parabola opens downward and has vertex at (h, k). Consequently,<br />
the range will be<br />
(−∞, k] = {y : y ≤ k}.<br />
Version: Fall 2007
8 Chapter 3<br />
How to Find the Vertex<br />
It should now be clear that the vertex of the parabola plays a crucial role when working<br />
with quadratic functions. We also know that we can complete the square to find the<br />
coordinates of the vertex. However, recall there is a much faster way of finding the<br />
vertex.<br />
Vertex Formula. Given the parabola represented by the quadratic function<br />
y = ax 2 + bx + c,<br />
the x-coordinate of the vertex is given by the formula<br />
x vertex = − b<br />
2a .<br />
The y-coordinate of the vertex is given by<br />
(<br />
y vertex = f − b )<br />
.<br />
2a<br />
Let’s look at an example.<br />
◮ Example 4<br />
Consider the parabola having equation<br />
f(x) = −2x 2 + 3x − 8.<br />
Find the coordinates of the vertex and give the domain and range.<br />
First, use the vertex formula to find the x-coordinate of the vertex.<br />
x vertex = − b<br />
2a = − 3<br />
2(−2) = 3 4 .<br />
Next, substitute x = 3/4 to find the corresponding y-coordinate.<br />
( ( ) 3 3 2 ( 3<br />
f = −2 + 3 − 8<br />
4)<br />
4 4)<br />
( 9<br />
= −2 +<br />
16)<br />
9 4 − 8<br />
= − 9 8 + 18<br />
8 − 64<br />
8<br />
= − 55<br />
8<br />
Thus, the coordinates of the vertex are (3/4, −55/8).<br />
To find the domain we recall that for all parabolas, the domain is given by (−∞, ∞).<br />
To find the range, we first need to note that this is a downward opening parabola<br />
(a < 0). Then we use the y value of our vertex to determine that the range is given by<br />
(−∞, −55/8].<br />
Version: Fall 2007