Conducting a Community Needs Assessment Handouts
Conducting a Community Needs Assessment Handouts
Conducting a Community Needs Assessment Handouts

You also want an ePaper? Increase the reach of your titles
YUMPU automatically turns print PDFs into web optimized ePapers that Google loves.
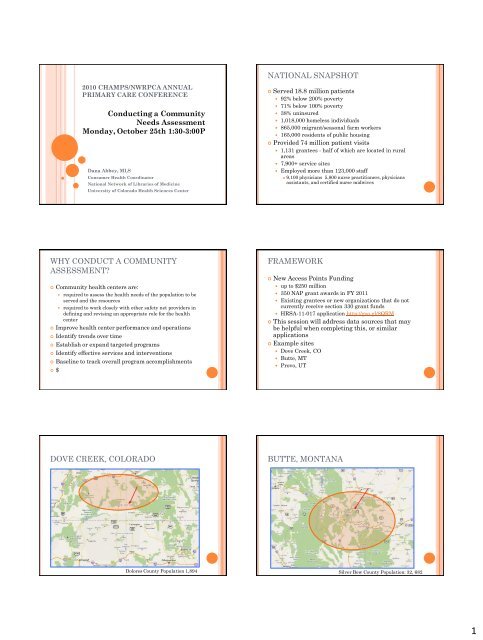
2010 CHAMPS/NWRPCA ANNUAL<br />
PRIMARY CARE CONFERENCE<br />
<strong>Conducting</strong> a <strong>Community</strong><br />
<strong>Needs</strong> <strong>Assessment</strong><br />
Monday, October 25th 1:30-3:00P<br />
Dana Abbey, MLS<br />
Consumer Health Coordinator<br />
National Network of Libraries of Medicine<br />
University of Colorado Health Sciences Center<br />
NATIONAL SNAPSHOT<br />
Served 18.8 million patients<br />
• 92% below 200% poverty<br />
• 71% below 100% poverty<br />
• 38% uninsured<br />
• 1,018,000 homeless individuals<br />
• 865,000 migrant/seasonal farm workers<br />
• 165,000 residents of public housing<br />
Provided 74 million patient visits<br />
• 1,131 grantees - half of which are located in rural<br />
areas<br />
• 7,900+ service sites<br />
• Employed more than 123,000 staff<br />
9,100 physicians 5,800 nurse practitioners, physicians<br />
assistants, and certified nurse midwives<br />
WHY CONDUCT A COMMUNITY<br />
ASSESSMENT<br />
<strong>Community</strong> health centers are:<br />
• required to assess the health needs of the population to be<br />
served and the resources<br />
• required to work closely with other safety net providers in<br />
defining and revising an appropriate role for the health<br />
center<br />
Improve health center performance and operations<br />
Identify trends over time<br />
Establish or expand targeted programs<br />
Identify effective services and interventions<br />
Baseline to track overall program accomplishments<br />
$<br />
FRAMEWORK<br />
New Access Points Funding<br />
• up to $250 million<br />
• 350 NAP grant awards in FY 2011<br />
• Existing grantees or new organizations that do not<br />
currently receive section 330 grant funds<br />
• HRSA-11-017 application http://goo.gl/8QRM<br />
This session will address data sources that may<br />
be helpful when completing this, or similar<br />
applications<br />
Example sites<br />
• Dove Creek, CO<br />
• Butte, MT<br />
• Provo, UT<br />
DOVE CREEK, COLORADO<br />
BUTTE, MONTANA<br />
Dolores County Population 1,894<br />
Silver Bow County Population: 32, 682<br />
1
PROVO, UTAH<br />
FOCUSING ON THE TAIL, NOT THE<br />
DOG<br />
Provo-Orem metropolitan area 555,551<br />
Photo: Jeremiah Owyang<br />
EXTRAPOLATING DATA<br />
It may be difficult to find data specific to the<br />
proposed service area or target population.<br />
Key demographic information about the service<br />
area or target population may permit an<br />
extrapolation of data from a more aggregate<br />
level, such as the State or county.<br />
Use the experience of one population (the<br />
“standard” population) to project the data for the<br />
target population.<br />
CORE BARRIERS: POPULATION TO<br />
ONE FTE PRIMARY PHYSICIAN<br />
<strong>Community</strong> Fact Sheets –<br />
http://datawarehouse.hrsa.gov/HGDWReports/Commu<br />
nity_Fact_Sheet.aspx<br />
• County-level profile<br />
Health Resources County Comparison Tool:<br />
http://arf.hrsa.gov/arfwebtool/Counties_search.asp<br />
• Peer counties, multiple county comparison<br />
Health Center Data: http://www.hrsa.gov/datastatistics/health-center-data/index.html<br />
• National and state data covering 2006-2009<br />
Shortage Areas: HPSA by State & County:<br />
http://hpsafind.hrsa.gov/<br />
• State and county data, updated 10/2010<br />
EXAMPLE: POPULATION TO ONE<br />
FTE PRIMARY PHYSICIAN<br />
EXAMPLE: POPULATION TO ONE<br />
FTE PRIMARY PHYSICIAN<br />
Determine Service Area<br />
Zip Code Analysis<br />
Geographical Barriers<br />
Weather<br />
2
EXAMPLE: POPULATION TO ONE<br />
FTE PRIMARY PHYSICIAN<br />
CORE BARRIERS: % OF POPULATION<br />
AT OR BELOW 200% OF POVERTY<br />
<strong>Community</strong> Fact Sheets –<br />
http://datawarehouse.hrsa.gov/HGDWReports/Com<br />
munity_Fact_Sheet.aspx<br />
• County-level profile<br />
State & County QuickFacts:<br />
http://quickfacts.census.gov/qfd/index.html<br />
• For cities and towns with more than 25,000<br />
CORE BARRIERS: PERCENT OF<br />
POPULATION UNINSURED<br />
By state<br />
• Current Population Survey (State and age):<br />
http://www.census.gov/hhes/www/cpstables/032010/health/h05<br />
_000.htm<br />
• Kaiser Foundation State Health Facts:<br />
http://www.statehealthfacts.org/profile.jsp (Health coverage<br />
and the uninsured)<br />
By county<br />
• <strong>Community</strong> Health Status Indicators (CHSI)<br />
http://www.communityhealth.hhs.gov/HomePage.aspx<br />
• <strong>Community</strong> Fact Sheets –<br />
http://datawarehouse.hrsa.gov/HGDWReports/<strong>Community</strong>_Fa<br />
ct_Sheet.aspx<br />
CORE BARRIERS: DISTANCE OR<br />
TRAVEL TIME<br />
<strong>Community</strong> Fact Sheets –<br />
http://datawarehouse.hrsa.gov/HGDWReports/<strong>Community</strong>_Fact_Shee<br />
t.aspx<br />
• County-level data on Medicare patients, PCP<br />
What Congestion Means to Your Town, 2007 Urban Area Totals<br />
http://mobility.tamu.edu/ums/congestion_data/tables/national/table_2.<br />
pdf<br />
Agricultural Workers Distance to Work and Transportation Table<br />
5.15<br />
http://www.doleta.gov/agworker/report9/chapter5.cfm#basis_for_pay<br />
Transportation and Worst Case <strong>Needs</strong> (pg. 18)<br />
http://www.huduser.org/Publications/pdf/worstcase_Hsg<strong>Needs</strong>07.pdf<br />
What other data might be<br />
used in this narrative<br />
CORE HEALTH INDICATORS:<br />
DIABETES<br />
Resources<br />
• Short term complication Hospital Admission Rate<br />
http://www.cdc.gov/diabetes/statistics/complications_national.htm<br />
• Long term Complications Hospital Admission Rate<br />
http://www.cdc.gov/diabetes/statistics/complications_national.htm<br />
• Uncontrolled Diabetes Hospital Admission Rate<br />
Healthy People 2010<br />
http://www.healthypeople.gov/data/2010prog/focus01/ (program review)<br />
• Rate of Lower-extremity Amputation Among Patients with<br />
Diabetes<br />
http://www.cdc.gov/diabetes/statistics/lealevel/fig9.htm (United States<br />
2005)<br />
MT http://www.dphhs.mt.gov/PHSD/MTHDDS/index.shtml<br />
• Age adjusted Diabetes Prevalence<br />
http://apps.nccd.cdc.gov/DDT_STRS2/NationalDiabetesPrevalenceEstim<br />
ates.aspx (county level estimates 2004-2007)<br />
http://www.cdc.gov/diabetes/statistics/prev/national/figageadult.htm<br />
(national 1980-2008)<br />
CORE HEALTH INDICATORS:<br />
DIABETES<br />
Additional Resources<br />
Chronic Disease Indicator<br />
http://apps.nccd.cdc.gov/cdi/Default.aspx<br />
• Adult prevalence (national, state, select counties)<br />
• Mortality rate<br />
• Age-adjusted prevalence<br />
http://apps.nccd.cdc.gov/DDT_STRS2/NationalDiabetesPrevalence<br />
Estimates.aspx (national, state, county)<br />
Diabetes Indicators and Data Sources Internet Tool (DIDIT)<br />
http://apps.nccd.cdc.gov/DDTSTRS/DIDIT.aspx<br />
• Must submit form for access to program<br />
Kaiser Family Foundation State Health Facts:<br />
http://www.statehealthfacts.org/profile.jsp (health status)<br />
National Health Statistics Reports, Number 5, July 30, 2008<br />
(Table 2) http://www.cdc.gov/nchs/data/nhsr/nhsr005.pdf<br />
• Diabetes mellitus (national - number of discharges from shortstay<br />
hospitals by first-listed diagnosis and age: United States,<br />
2006 )<br />
3
EXAMPLE: RATE OF LOWER-<br />
EXTREMITY AMPUTATION<br />
EXAMPLE: RATE OF LOWER-<br />
EXTREMITY AMPUTATION<br />
CORE HEALTH INDICATORS:<br />
CARDIOVASCULAR DISEASE<br />
Hypertension Hospital Admission Rate<br />
• http://www.cdc.gov/nchs/data/nhsr/nhsr005.pdf (discharge survey<br />
2006)<br />
• State Hospital “Report Cards”<br />
Example: Colorado http://goo.gl/1opY<br />
Congestive Heart Failure Hospital Admission Rate<br />
• http://www.americanheart.org/downloadable/heart/1265665152970DS-<br />
3241%20HeartStrokeUpdate_2010.pdf<br />
• http://www.cdc.gov/nchs/data/nhds/nhds071stlisteddiagnoses.pdf<br />
• http://www.cdc.gov/nchs/data/nhsr/nhsr005.pdf (discharge survey<br />
2006)<br />
Angina without Procedure Hospital Admission Rate<br />
• http://www.americanheart.org/downloadable/heart/1265665152970DS-<br />
3241%20HeartStrokeUpdate_2010.pdf<br />
Mortality from Diseases of the Heart<br />
• http://www.americanheart.org/downloadable/heart/1265665152970DS-<br />
3241%20HeartStrokeUpdate_2010.pdf<br />
Proportion of Adults Reporting Diagnosis of High Blood<br />
Pressure<br />
CORE HEALTH INDICATORS:<br />
CANCER<br />
Cancer Screening – % of women 18 and older with No<br />
Pap test in the last 3 years<br />
• http://www.meps.ahrq.gov/mepsweb/data_files/publications<br />
/st173/stat173.pdf (national data)<br />
• http://statecancerprofiles.cancer.gov/risk/index.php (state<br />
data for those who had a Pap in the last 3 years)<br />
Cancer Screening - % of women 40 and older with No<br />
Mammogram in the past 3 years<br />
• http://statecancerprofiles.cancer.gov/risk/index.php (state<br />
data of those who had mammogram in the past 2 years)<br />
Cancer Screening - % of adults 50 and older with No<br />
Fecal Occult Blood Test Within the past 2 years<br />
• http://statecancerprofiles.cancer.gov/risk/index.php (home<br />
blood stool test used in the past 2 years)<br />
CORE HEALTH INDICATORS:<br />
PRENATAL/PERINATAL HEALTH<br />
Low Birth Weight Rate (5 year average)<br />
• http://www.statehealthfacts.org/children.jsp<br />
Infant Mortality Rate (5 year average)<br />
• http://www.statehealthfacts.org/children.jsp<br />
• http://datawarehouse.hrsa.gov/HGDWReports/<strong>Community</strong>_Fact_Shee<br />
t.aspx (County-level birth and infant deaths)<br />
Births to Teenage Mothers (ages 15-19; % of all births)<br />
• http://www.statehealthfacts.org/children.jsp<br />
• http://www.cdc.gov/nchs/data/nvsr/nvsr58/nvsr58_24.pdf (Stat<br />
Late entry into prenatal care<br />
• http://www.statehealthfacts.org/children.jsp<br />
• http://apps.nccd.cdc.gov/cPONDER/ (from dropdown box, select<br />
“prenatal care initiation”)<br />
Cigarette use during pregnancy<br />
• http://apps.nccd.cdc.gov/cPONDER/ (from dropdown box, select<br />
“tobacco use”)<br />
CORE HEALTH INDICATORS: CHILD<br />
HEALTH<br />
Pediatric Asthma Hospital Admission Rate<br />
• Summary Health Statistics for U.S. Children: National Health Interview<br />
Survey, 2008 http://www.cdc.gov/nchs/data/series/sr_10/sr10_244.pdf<br />
(Ever told have asthma, still have asthma (national/region)<br />
Percent of Children not tested for elevated blood lead blood levels by 30<br />
months<br />
• http://www.cdc.gov/nceh/lead/data/state.htm (most states, 2006-2008)<br />
• http://www.cdc.gov/nceh/lead/data/national.htm (national data for most<br />
states 1997-2007)<br />
Percent of children not receiving recommended immunizations<br />
• Kaiser Family State Health Facts:<br />
http://www.statehealthfacts.org/index.jsp (Immunizations children age<br />
19-35 months)<br />
• http://www.cdc.gov/nchs/data/hus/hus09.pdf#082 (National data on<br />
vaccination coverage 19-35 months)<br />
National Health Statistics Reports, Number 5, July 30,2008 (Table 2)<br />
http://www.cdc.gov/nchs/data/series/sr_10/sr10_244.pdf<br />
• Under 15 years , 15-44 years (national)<br />
<strong>Community</strong> Fact Sheets –<br />
http://datawarehouse.hrsa.gov/HGDWReports/<strong>Community</strong>_Fact_Sheet.aspx<br />
-<br />
• County-level birth and infant deaths<br />
4
EXAMPLE: % OF CHILDREN TESTED<br />
LEAD<br />
EXAMPLE: % OF CHILDREN TESTED<br />
LEAD<br />
CDC does not have state data for Colorado,<br />
Montana, or Utah<br />
EXAMPLE: % OF CHILDREN TESTED<br />
LEAD<br />
EXAMPLE: % OF CHILDREN TESTED<br />
LEAD<br />
CORE HEALTH INDICATORS:<br />
BEHAVIORAL AND ORAL HEALTH<br />
Depression Prevalence<br />
• http://oas.samhsa.gov/2k7/states/depression.htm (state estimates<br />
2004-2005)<br />
• http://oas.samhsa.gov/statesList.cfm (links to state level data)<br />
• http://oas.samhsa.gov/2k6/suicide/suicide.htm (prevalence of MDE)<br />
Suicide Rate<br />
• http://webappa.cdc.gov/cgi-bin/broker.exe (national, by age group)<br />
• http://www.afsp.org/index.cfmfuseaction=home.viewPage&page_id=0<br />
5114FBE-E445-7831-F0C1494E2FADB8EA (state level data)<br />
Youth Suicide Attempts Requiring Medical Attention<br />
• http://oas.samhsa.gov/2k6/suicide/suicide.htm (drug-related suicide<br />
attempts)<br />
Percent of Adults with Mental Disorders Not Receiving<br />
Treatment<br />
• http://oas.samhsa.gov/NSDUH/2k6nsduh/tabs/Sect6peTabs1to41.htm#<br />
Tab6.17A (unmet need for treatment 2005-2006)<br />
CORE HEALTH INDICATORS:<br />
BEHAVIORAL AND ORAL HEALTH<br />
Any Illicit Drug Use in the Past Month<br />
• http://oas.samhsa.gov/statesList.cfm (links to state level data)<br />
Heavy Alcohol Use (12 and over)<br />
• http://apps.nccd.cdc.gov/brfss/page.aspyr=2008&state=All&cat=AC#AC<br />
Homeless with Severe Mental Illness (% of all Homeless)<br />
• http://www.nationalhomeless.org/publications/facts/Mental_Illness.pdf<br />
(national data)<br />
• http://www.nami.org/Content/NavigationMenu/State_Advocacy/About_the_<br />
Issue/Homelessness.pdf (national data)<br />
• http://www.huduser.org/publications/pdf/5thHomeless<strong>Assessment</strong>Report.p<br />
df (national homelessness data)<br />
• http://www.nationalhomeless.org/factsheets/rural.html (rural<br />
homelessness)<br />
• http://www.usmayors.org/pressreleases/documents/hungerhomelessnessrep<br />
ort_121208.pdf (select cities)<br />
Oral Health (% without dental visit in the last year)<br />
• BRFSS<br />
http://apps.nccd.cdc.gov/brfss/page.aspyr=2008&state=All&cat=OH#OH<br />
(visited dentist in the past year)<br />
• CDC Oral Health Resources by State<br />
http://apps.nccd.cdc.gov/synopses/StateDataV.aspStateID=AL&Year=2009<br />
• Kaiser State Health Facts – Health Status – Oral Health<br />
http://statehealthfacts.org<br />
5
EXAMPLE: % WITHOUT DENTAL<br />
VISIT IN LAST YEAR<br />
EXAMPLE: % WITHOUT DENTAL<br />
VISIT IN LAST YEAR<br />
EXAMPLE: % WITHOUT DENTAL<br />
VISIT IN LAST YEAR<br />
OTHER HEALTH INDICATORS<br />
<br />
<br />
Age-adjusted death rate<br />
• CDC Wonder http://wonder.cdc.gov/mcd-icd10.html (age-adjusted, national, state,<br />
metro/micopolitan, through 2006)<br />
HIV infection prevalence<br />
• National Center for HIV/AIDS, Viral Hep., STD, and TB Prevention<br />
http://www.cdc.gov/nchhstp/stateprofiles/usmap.htm ( state profiles )<br />
• CDC: HIV in the United States Fact Sheet<br />
http://www.cdc.gov/hiv/resources/factsheets/us.htm (national)<br />
• HIV Surveillance Report 2008<br />
http://www.cdc.gov/hiv/surveillance/resources/reports/2008report/pdf/2008Surveillance<br />
Report.pdf (national, state, links for state/local surveillance reports)<br />
Percent Elderly (65+)<br />
• U.S. Census Bureau State and County Quick Facts<br />
http://quickfacts.census.gov/qfd/index.html<br />
<br />
• U.S. Census Population Estimates http://www.census.gov/popest/counties/CO-<br />
EST2009-01.html (county-level all ages)<br />
Adult Asthma Hospital Admission Rate<br />
• CDC Fast Facts: Asthma http://www.cdc.gov/nchs/fastats/asthma.htm<br />
Bacterial Pneumonia Hospital Admission Rate<br />
• State Hospital Association’s “Report Card”<br />
Example CO - http://www.cohospitalquality.org/index.php<br />
Three Year Average Pneumonia Death Rate<br />
State Hospital Association Data<br />
See above<br />
EXAMPLE: THREE YEAR AVERAGE<br />
PNEUMONIA DEATH RATE<br />
OTHER HEALTH INDICATORS<br />
Adult Current Asthma Prevalence<br />
• CDC 2008 Adult Asthma Data http://www.cdc.gov/asthma/brfss/08/brfssdata.htm<br />
Adult Ever Told Had Asthma<br />
• SMART: BRFSS City and County Data http://apps.nccd.cdc.gov/brfsssmart/ListMMSAQuest.aspyr2=2009&MMSA=All&cat=AS&qkey=4417&grp=0<br />
(selected local prevalence data through 2009)<br />
Unintentional death<br />
• National Center for Injury Prevention and Control<br />
http://webappa.cdc.gov/sasweb/ncipc/mortrate10_sy.html (national, region and state<br />
data through 2007)<br />
Linguistically isolated (% over age 5 speaking language other than English)<br />
• U.S. Census Bureau State and County Quick Facts http://quickfacts.census.gov/qfd/<br />
(state data)<br />
<br />
• U.S. Census Bureau American Fact Finder http://factfinder.census.gov (city, town,<br />
county-level data for 2000, some for 2006-2008)<br />
Waiting time for public housing<br />
• A Picture of Subsidized Households 2008<br />
http://www.huduser.org/portal/picture2008/form_1s4.odb (naitonal, state, city level)<br />
• Contact state HUD office http://portal.hud.gov/portal/page/portal/HUD/states<br />
• 2009 annual Homelessness <strong>Assessment</strong> Report to Congress<br />
http://www.huduser.org/publications/pdf/5thHomeless<strong>Assessment</strong>Report.pdf<br />
• Worst Case Housing <strong>Needs</strong> 2007: A Report to Congress<br />
http://www.huduser.org/Publications/pdf/worstcase_Hsg<strong>Needs</strong>07.pdf<br />
6
GENERAL RESOURCES<br />
American Fact Finder (