Fact Sheet for the month of May-07 - HDFC Mutual Fund
Fact Sheet for the month of May-07 - HDFC Mutual Fund
Fact Sheet for the month of May-07 - HDFC Mutual Fund

Create successful ePaper yourself
Turn your PDF publications into a flip-book with our unique Google optimized e-Paper software.
hdfc-eq-r.qxd 5/8/20<strong>07</strong> 20:39 Page 3<br />
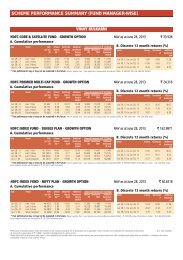
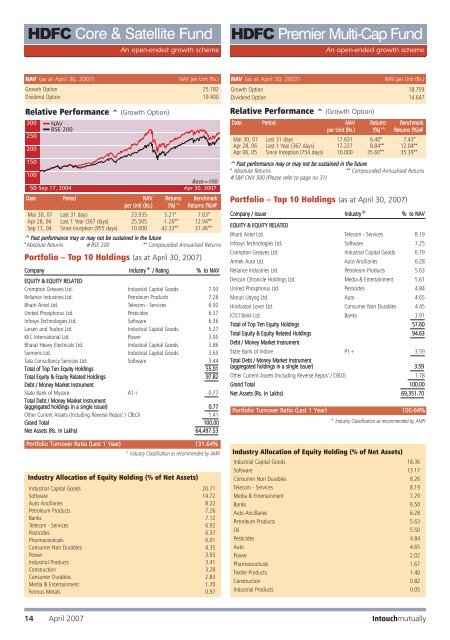
<strong>HDFC</strong> Core & Satellite <strong>Fund</strong><br />
An open-ended growth scheme<br />
<strong>HDFC</strong> Premier Multi-Cap <strong>Fund</strong><br />
An open-ended growth scheme<br />
NAV (as at April 30, 20<strong>07</strong>)<br />
NAV per Unit (Rs.)<br />
Growth Option 25.182<br />
Dividend Option 19.400<br />
Relative Per<strong>for</strong>mance ^ (Growth Option)<br />
NAV (as at April 30, 20<strong>07</strong>)<br />
NAV per Unit (Rs.)<br />
Growth Option 18.759<br />
Dividend Option 14.647<br />
Relative Per<strong>for</strong>mance ^ (Growth Option)<br />
Date Period NAV Returns Benchmark<br />
per Unit (Rs.) (%)^ Returns (%)#<br />
Mar 30, <strong>07</strong> Last 31 days 17.631 6.40* 7.43*<br />
Apr 28, 06 Last 1 Year (367 days) 17.227 8.84** 12.04**<br />
Apr 06, 05 Since Inception (754 days) 10.000 35.60** 35.39**<br />
^Past per<strong>for</strong>mance may or may not be sustained in <strong>the</strong> future<br />
* Absolute Returns ** Compounded Annualised Returns<br />
#S&P CNX 500 (Please refer to page no 31)<br />
Date Period NAV Returns Benchmark<br />
per Unit (Rs.) (%)^ Returns (%)#<br />
Mar 30, <strong>07</strong> Last 31 days 23.935 5.21* 7.03*<br />
Apr 28, 06 Last 1 Year (367 days) 25.505 -1.26** 12.94**<br />
Sep 17, 04 Since Inception (955 days) 10.000 42.33** 37.46**<br />
^Past per<strong>for</strong>mance may or may not be sustained in <strong>the</strong> future<br />
*Absolute Returns #BSE 200 ** Compounded Annualised Returns<br />
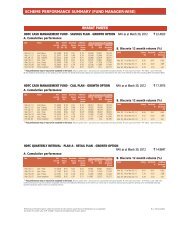
Portfolio – Top 10 Holdings (as at April 30, 20<strong>07</strong>)<br />
Company Industry + / Rating % to NAV<br />
EQUITY & EQUITY RELATED<br />
Crompton Greaves Ltd. Industrial Capital Goods 7.93<br />
Reliance Industries Ltd. Petroleum Products 7.26<br />
Bharti Airtel Ltd. Telecom - Services 6.92<br />
United Phosphorus Ltd. Pesticides 6.37<br />
Infosys Technologies Ltd. S<strong>of</strong>tware 6.36<br />
Larsen and Toubro Ltd. Industrial Capital Goods 5.27<br />
KEC International Ltd. Power 3.95<br />
Bharat Heavy Electricals Ltd. Industrial Capital Goods 3.86<br />
Siemens Ltd. Industrial Capital Goods 3.65<br />
Tata Consultancy Services Ltd. S<strong>of</strong>tware 3.44<br />
Total <strong>of</strong> Top Ten Equity Holdings 55.01<br />
Total Equity & Equity Related Holdings 97.82<br />
Debt / Money Market Instrument<br />
State Bank <strong>of</strong> Mysore A1+ 0.77<br />
Total Debt / Money Market Instrument<br />
(aggregated holdings in a single issuer) 0.77<br />
O<strong>the</strong>r Current Assets (Including Reverse Repos’ / CBLO) 1.41<br />
Grand Total 100.00<br />
Net Assets (Rs. In Lakhs) 64,497.53<br />
Portfolio Turnover Ratio (Last 1 Year) 131.64%<br />
+ Industry Classification as recommended by AMFI<br />
Industry Allocation <strong>of</strong> Equity Holding (% <strong>of</strong> Net Assets)<br />
Industrial Capital Goods 20.71<br />
S<strong>of</strong>tware 14.72<br />
Auto Ancillaries 8.22<br />
Petroleum Products 7.26<br />
Banks 7.12<br />
Telecom - Services 6.92<br />
Pesticides 6.37<br />
Pharmaceuticals 6.01<br />
Consumer Non Durables 4.35<br />
Power 3.95<br />
Industrial Products 3.41<br />
Construction 3.28<br />
Consumer Durables 2.83<br />
Media & Entertainment 1.70<br />
Ferrous Metals 0.97<br />
Portfolio – Top 10 Holdings (as at April 30, 20<strong>07</strong>)<br />
Company / Issuer Industry + % to NAV<br />
EQUITY & EQUITY RELATED<br />
Bharti Airtel Ltd. Telecom - Services 8.19<br />
Infosys Technologies Ltd. S<strong>of</strong>tware 7.25<br />
Crompton Greaves Ltd. Industrial Capital Goods 6.79<br />
Amtek Auto Ltd. Auto Ancillaries 6.28<br />
Reliance Industries Ltd. Petroleum Products 5.63<br />
Deccan Chronicle Holdings Ltd. Media & Entertainment 5.61<br />
United Phosphorus Ltd. Pesticides 4.84<br />
Maruti Udyog Ltd. Auto 4.65<br />
Hindustan Lever Ltd. Consumer Non Durables 4.45<br />
ICICI Bank Ltd. Banks 3.91<br />
Total <strong>of</strong> Top Ten Equity Holdings 57.60<br />
Total Equity & Equity Related Holdings 94.63<br />
Debt / Money Market Instrument<br />
State Bank <strong>of</strong> Indore P1+ 3.59<br />
Total Debt / Money Market Instrument<br />
(aggregated holdings in a single issuer) 3.59<br />
O<strong>the</strong>r Current Assets (Including Reverse Repos’ / CBLO) 1.78<br />
Grand Total 100.00<br />
Net Assets (Rs. In Lakhs) 69,351.70<br />
Portfolio Turnover Ratio (Last 1 Year) 100.64%<br />
+ Industry Classification as recommended by AMFI<br />
Industry Allocation <strong>of</strong> Equity Holding (% <strong>of</strong> Net Assets)<br />
Industrial Capital Goods 18.36<br />
S<strong>of</strong>tware 13.17<br />
Consumer Non Durables 8.26<br />
Telecom - Services 8.19<br />
Media & Entertainment 7.29<br />
Banks 6.50<br />
Auto Ancillaries 6.28<br />
Petroleum Products 5.63<br />
Oil 5.50<br />
Pesticides 4.84<br />
Auto 4.65<br />
Power 2.02<br />
Pharmaceuticals 1.67<br />
Textile Products 1.40<br />
Construction 0.82<br />
Industrial Products 0.05<br />
14 April 20<strong>07</strong> Intouchmutually