

1eVf8UD
1eVf8UD
1eVf8UD

You also want an ePaper? Increase the reach of your titles
YUMPU automatically turns print PDFs into web optimized ePapers that Google loves.
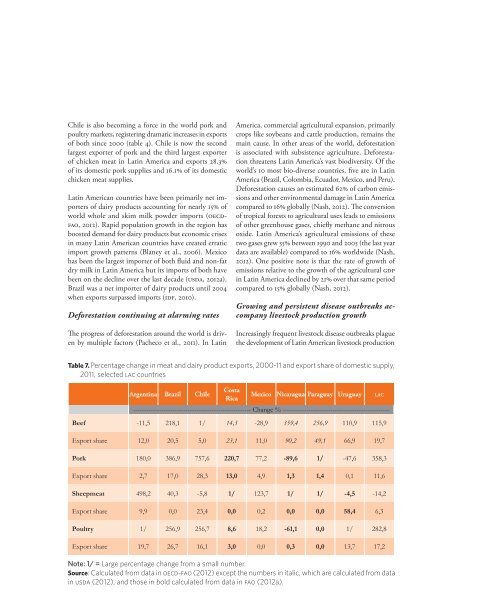
Chile is also becoming a force in the world pork and<br />
poultry markets, registering dramatic increases in exports<br />
of both since 2000 (table 4). Chile is now the second<br />
largest exporter of pork and the third largest exporter<br />
of chicken meat in Latin America and exports 28.3%<br />
of its domestic pork supplies and 16.1% of its domestic<br />
chicken meat supplies.<br />
Latin American countries have been primarily net importers<br />
of dairy products accounting for nearly 15% of<br />
world whole and skim milk powder imports (oecdfao,<br />
2012). Rapid population growth in the region has<br />
boosted demand for dairy products but economic crises<br />
in many Latin American countries have created erratic<br />
import growth patterns (Blaney et al., 2006). Mexico<br />
has been the largest importer of both fluid and non-fat<br />
dry milk in Latin America but its imports of both have<br />
been on the decline over the last decade (usda, 2012a).<br />
Brazil was a net importer of dairy products until 2004<br />
when exports surpassed imports (idf, 2010).<br />
Deforestation continuing at alarming rates<br />
The progress of deforestation around the world is driven<br />
by multiple factors (Pacheco et al., 2011). In Latin<br />
America, commercial agricultural expansion, primarily<br />
crops like soybeans and cattle production, remains the<br />
main cause. In other areas of the world, deforestation<br />
is associated with subsistence agriculture. Deforestation<br />
threatens Latin America’s vast biodiversity. Of the<br />
world’s 10 most bio-diverse countries, five are in Latin<br />
America (Brazil, Colombia, Ecuador, Mexico, and Peru).<br />
Deforestation causes an estimated 62% of carbon emissions<br />
and other environmental damage in Latin America<br />
compared to 16% globally (Nash, 2012). The conversion<br />
of tropical forests to agricultural uses leads to emissions<br />
of other greenhouse gases, chiefly methane and nitrous<br />
oxide. Latin America’s agricultural emissions of these<br />
two gases grew 35% between 1990 and 2005 (the last year<br />
data are available) compared to 16% worldwide (Nash,<br />
2012). One positive note is that the rate of growth of<br />
emissions relative to the growth of the agricultural gdp<br />
in Latin America declined by 21% over that same period<br />
compared to 15% globally (Nash, 2012).<br />
Growing and persistent disease outbreaks accompany<br />
livestock production growth<br />
Increasingly frequent livestock disease outbreaks plague<br />
the development of Latin American livestock production<br />
Table 7. Percentage change in meat and dairy product exports, 2000-11 and export share of domestic supply,<br />
2011, selected lac countries<br />
Argentina Brazil Chile<br />
Costa<br />
Rica<br />
Mexico Nicaragua Paraguay Uruguay LAC<br />
------------------------------------------------------ Change % -------------------------------------------------<br />
Beef -11,5 218,1 1/ 14,3 -28,9 359,4 256,9 110,9 115,9<br />
Export share 12,0 20,5 5,0 23,1 11,0 90,2 49,1 66,9 19,7<br />
Pork 180,0 386,9 757,6 220,7 77,2 -89,6 1/ -47,6 358,3<br />
Export share 2,7 17,0 28,3 13,0 4,9 1,3 1,4 0,1 11,6<br />
Sheepmeat 498,2 40,3 -5,8 1/ 123,7 1/ 1/ -4,5 -14,2<br />
Export share 9,9 0,0 23,4 0,0 0,2 0,0 0,0 58,4 6,3<br />
Poultry 1/ 256,9 256,7 8,6 18,2 -61,1 0,0 1/ 282,8<br />
Export share 19,7 26,7 16,1 3,0 0,0 0,3 0,0 13,7 17,2<br />
Note: 1/ = Large percentage change from a small number.<br />
Source: Calculated from data in oecd-fao (2012) except the numbers in italic, which are calculated from data<br />
in usda (2012), and those in bold calculated from data in fao (2012a).<br />
A Perspective on Latin America and the Caribbean<br />
57