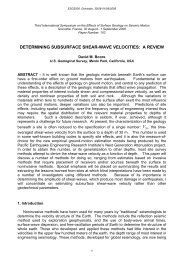
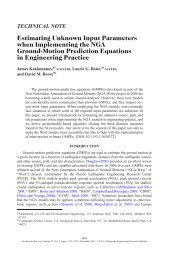
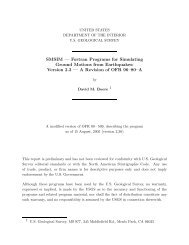
Some thoughts on relating density to velocity - David M. Boore
Some thoughts on relating density to velocity - David M. Boore
Some thoughts on relating density to velocity - David M. Boore

Create successful ePaper yourself
Turn your PDF publications into a flip-book with our unique Google optimized e-Paper software.
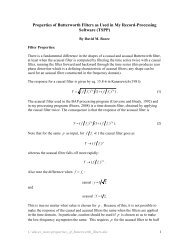
<str<strong>on</strong>g>Some</str<strong>on</strong>g> <str<strong>on</strong>g>thoughts</str<strong>on</strong>g> <strong>on</strong> <strong>relating</strong> <strong>density</strong> <strong>to</strong> <strong>velocity</strong><br />
<strong>David</strong> M. <strong>Boore</strong><br />
1 March 2007<br />
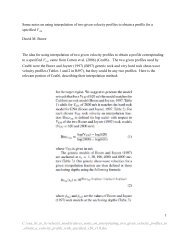
There are many occasi<strong>on</strong>s when <strong>density</strong> is needed for modeling of site<br />
amplificati<strong>on</strong>, but all that is available are values for shear-wave or<br />
compressi<strong>on</strong>al-wave <strong>velocity</strong>. For example, my program site_amp<br />
and Chuck Mueller’s nrattle need input of shear-wave <strong>velocity</strong> and<br />
<strong>density</strong>. I’ve built in a default relati<strong>on</strong> between the two in site_amp,<br />
but I’ve never been happy with it (it is shown in a figure below, and<br />
clearly my reservati<strong>on</strong>s were well founded), so these notes describe<br />
my attempt <strong>to</strong> replace that relati<strong>on</strong>. I’ve made use of Tom Brocher’s<br />
recent work (in particular, Brocher, 2005a, b).<br />
Relating Density <strong>to</strong> Compressi<strong>on</strong>al-Wave Velocity:<br />
A popular relati<strong>on</strong> between <strong>density</strong> ( ρ ) and P-wave <strong>velocity</strong> ( V P<br />
)<br />
seems <strong>to</strong> be that of Gardner et al. (1974). The relati<strong>on</strong> takes the<br />
following forms, depending <strong>on</strong> the units of V P<br />
(in all cases the units of<br />
<strong>density</strong> are gm/cc):<br />
0.25<br />
ft/sec: ρ = 0.23V<br />
P<br />
(1)<br />
0.25<br />
km/sec: ρ = 1.74 V P<br />
(2)<br />
0.25<br />
m/sec: ρ = 0.31V<br />
P<br />
(3)<br />
Their relati<strong>on</strong> is simply an approximate average of the relati<strong>on</strong>s for a<br />
number of sedimentary rock types, weighted <strong>to</strong>ward shales. The<br />
relati<strong>on</strong> comes from Figure 1 in Gardner et al. (1974):<br />
C:\site_amp\daves_notes_<strong>on</strong>_<strong>relating</strong>_<strong>density</strong>_<strong>to</strong>_<strong>velocity</strong>_v1.2.doc,<br />
Modified <strong>on</strong> 3/2/2007<br />
1
Figure 1. From Gardner et al. (1974)<br />
Note that no data are shown and that the relati<strong>on</strong> <strong>on</strong>ly applies for V P<br />
above about 5000 ft/sec (1524 m/sec); c<strong>on</strong>sequently, there is no<br />
reas<strong>on</strong> <strong>to</strong> think that the relati<strong>on</strong> should hold for smaller values of V P<br />
.<br />
Here is a plot of <strong>density</strong> and P-wave <strong>velocity</strong>, both measured in<br />
Quaternary sediments and from Gardner’s relati<strong>on</strong>. The values of V P<br />
less than about 1500 m/sec are presumably in unsaturated sediments.<br />
C:\site_amp\daves_notes_<strong>on</strong>_<strong>relating</strong>_<strong>density</strong>_<strong>to</strong>_<strong>velocity</strong>_v1.2.doc,<br />
Modified <strong>on</strong> 3/2/2007<br />
2
Density (gm/cm 3 )<br />
2.5<br />
2<br />
1.5<br />
1<br />
fresh water <strong>velocity</strong> at 15 o C<br />
File: C:\brocher\dens_vp_from_new_rock_properties.draw; Date: 2007-03-01; Time: 20:02:59<br />
0.5<br />
Gardner et al. (1974) (for 1500 > V P < 6100 m/sec)<br />
values from Brocher (2005) (Holocene units in SF Bay Area)<br />
0<br />
0 500 1000 1500 2000<br />
V P (m/sec)<br />
Figure 2. The vertical red line is the <strong>velocity</strong> of P-waves in fresh water<br />
at 15 degrees C (1477 m/s, Press, Table 9-6 in Clark, 1966); the<br />
<strong>velocity</strong> in salt water is above 1500 m/s.<br />
The average densities of the Holocene units for<br />
V < 1477 m/s is 2.0<br />
gm/cc. The Gardner et al. (1974) relati<strong>on</strong> clearly should not be used<br />
for unsaturated near-surface sediments (for which V P<br />
is less than<br />
about 1500 m/sec). What values of <strong>density</strong> should be expected<br />
The bulk <strong>density</strong> ( ρ ) of a rock composed of solids and fluid-filled voids<br />
is:<br />
ρ = ρ (1 − φ)<br />
+ ρ φ (4)<br />
S<br />
V<br />
where ρ<br />
S<br />
, ρ V<br />
, and φ are the densities of the solid material, the<br />
material filling the voids, and the porosity, respectively. For water-<br />
P<br />
C:\site_amp\daves_notes_<strong>on</strong>_<strong>relating</strong>_<strong>density</strong>_<strong>to</strong>_<strong>velocity</strong>_v1.2.doc,<br />
Modified <strong>on</strong> 3/2/2007<br />
3
filled voids, ρ<br />
V<br />
= 1; for air-filled voids ρ<br />
V<br />
= 0 . Here are predicted bulk<br />
densities for a range of solid densities and porosities:<br />
Table 1.<br />
porosity rho_saturated rho_dry<br />
0 2.65 2.65<br />
0.1 2.49 2.39<br />
0.2 2.32 2.12<br />
0.3 2.16 1.86<br />
0.4 1.99 1.59<br />
0.5 1.83 1.33<br />
0.6 1.66 1.06<br />
0.7 1.50 0.80<br />
0.8 1.33 0.53<br />
0.9 1.17 0.27<br />
where a value of ρ<br />
S<br />
= 2.65 gm/cc was used ( ρ<br />
S<br />
= 2.65 for quartz and<br />
ρ = 2.54 − 2.76 for feldspars, according <strong>to</strong> Lambe and Whitman (1969,<br />
S<br />
Table 3.1).<br />
Here is a plot of the ratio of bulk <strong>density</strong> for dry and fully-saturated<br />
rocks, as a functi<strong>on</strong> of porosity.<br />
C:\site_amp\daves_notes_<strong>on</strong>_<strong>relating</strong>_<strong>density</strong>_<strong>to</strong>_<strong>velocity</strong>_v1.2.doc,<br />
Modified <strong>on</strong> 3/2/2007<br />
4
dry/ wet<br />
1<br />
0.8<br />
0.6<br />
0.4<br />
0.2<br />
0<br />
solid = 2.65 gm/cc<br />
File: C:\site_amp\dens_dry_dens_wet_vs_porosity.draw; Date: 2007-03-01; Time: 16:57:50<br />
0 0.2 0.4 0.6 0.8 1<br />
Porosity<br />
Figure 3.<br />
So the important questi<strong>on</strong> is: “what is the porosity” Porosity depends<br />
<strong>on</strong> material, c<strong>on</strong>solidati<strong>on</strong>, size distributi<strong>on</strong>, and so <strong>on</strong>. For materials<br />
of most relevance, the porosities are generally less than 0.5 (Lambe<br />
and Whitman, 1969, Table 3.2).<br />
According <strong>to</strong> the Wikipedia entry<br />
(http://en.wikipedia.org/wiki/Porosity):<br />
Porosity of soil<br />
Porosity of surface soil typically decreases as particle size increases. This is due <strong>to</strong> soil<br />
aggregate formati<strong>on</strong> in finer textured surface soils when subject <strong>to</strong> soil biological<br />
processes. Aggregati<strong>on</strong> involves particulate adhesi<strong>on</strong> and higher resistance <strong>to</strong><br />
compacti<strong>on</strong>. Typical bulk <strong>density</strong> of sandy soil is between 1.5 and 1.7 g/cm 3 . This<br />
calculates <strong>to</strong> a porosity between 0.43 and 0.36. Typical bulk <strong>density</strong> of clay soil is<br />
between 1.1 and 1.3 g/cm 3 . This calculates <strong>to</strong> a porosity between 0.58 and 0.51. This<br />
seems counterintuitive because clay soils are termed heavy, implying lower porosity.<br />
C:\site_amp\daves_notes_<strong>on</strong>_<strong>relating</strong>_<strong>density</strong>_<strong>to</strong>_<strong>velocity</strong>_v1.2.doc,<br />
Modified <strong>on</strong> 3/2/2007<br />
5
Heavy apparently refers <strong>to</strong> a gravitati<strong>on</strong>al moisture c<strong>on</strong>tent effect in combinati<strong>on</strong> with<br />
terminology that harkens back <strong>to</strong> the relative force required <strong>to</strong> pull a tillage implement<br />
through the clayey soil at field moisture c<strong>on</strong>tent as compared <strong>to</strong> sand.<br />
Porosity of subsurface soil is lower than in surface soil due <strong>to</strong> compacti<strong>on</strong> by gravity.<br />
Porosity of 0.20 is c<strong>on</strong>sidered normal for unsorted gravel size material at depths below<br />
the biomantle. Porosity in finer material below the aggregating influence of pedogenesis<br />
can be expected <strong>to</strong> approximate this value.<br />
Soil porosity is complex. Traditi<strong>on</strong>al models regard porosity as c<strong>on</strong>tinuous. This fails <strong>to</strong><br />
account for anomalous features and produces <strong>on</strong>ly approximate results. Furthermore it<br />
cannot help model the influence of envir<strong>on</strong>mental fac<strong>to</strong>rs which affect pore geometry. A<br />
number of more complex models have been proposed, including fractals, bubble theory,<br />
cracking theory, Boolean grain process, packed sphere, and numerous other models.<br />
Using the spreadsheet table above with porosities of 0.2 <strong>to</strong> 0.35 gives<br />
wet and dry densities in good agreement with the values in Figure 2.<br />
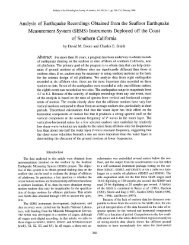
Here is another plot of <strong>velocity</strong> vs <strong>density</strong>. The base is a graph I<br />
scanned out of a report by Nafe and Drake (I think) that I found <strong>on</strong> my<br />
computer. I’ve superimposed data from Brocher for Quaternary<br />
sediments (references indicated in the graph). There is a lot <strong>on</strong> this<br />
graph, because it is a working plot. Note that the Nafe and Drake plot<br />
included both P- and S-wave velocities. Let’s look at the P-wave<br />
velocities first. Based <strong>on</strong> the graph below and the c<strong>on</strong>siderati<strong>on</strong>s<br />
above, I propose the following model <strong>relating</strong> <strong>density</strong> (units of gm/cc)<br />
and P-wave <strong>velocity</strong> (units of km/sec):<br />
VP<br />
3<br />
< 1.50 km/sec: ρ=1.93 gm/cm<br />
(5)<br />
1.50 km/sec ≤ VP<br />
< 6.0 km/sec : ρ = 1.74<br />
P<br />
0.25<br />
V (Gardner et al., 1974) (6)<br />
6.0 km/sec ≤ V P<br />
:<br />
2 3 4<br />
5<br />
ρ = 1.6612VP − 0.4721VP + 0.0671VP − 0.0043VP<br />
+ 0.000106V P<br />
(Brocher, 2005b, eq. 1) (7)<br />
I chose the Gardner et al. curve because it does a somewhat better<br />
job of fitting the Quaternary data than Nafe and Drake (as given by<br />
Brocher’s eq. 1) for intermediate values of V P<br />
. In additi<strong>on</strong>, the<br />
Gardner et al. relati<strong>on</strong> seems <strong>to</strong> be the standard in the explorati<strong>on</strong><br />
geophysics, where it is referred <strong>to</strong> as “Gardner’s Rule” (Sheriff and<br />
Geldart, 1995). I chose the break point at V = 1.5 km/s because it is<br />
P<br />
C:\site_amp\daves_notes_<strong>on</strong>_<strong>relating</strong>_<strong>density</strong>_<strong>to</strong>_<strong>velocity</strong>_v1.2.doc,<br />
Modified <strong>on</strong> 3/2/2007<br />
6
etween the velocities in fresh and salt water and because it yields a<br />
<strong>density</strong> somewhat below 2.0 gm/cc (I think it is better <strong>to</strong> err slightly<br />
<strong>on</strong> the side of densities that are <strong>to</strong>o small, as that will increase the<br />
amplificati<strong>on</strong>; in additi<strong>on</strong>, many soils near the surface in dry materials<br />
probably have densities somewhat less than 2.0 gm/cc; coincidentally,<br />
I’m sure, the average <strong>density</strong> of the data in Figure 2 for velocities less<br />
than 1430 m/s is 1.93 gm/cc). C<strong>on</strong>versely, Brocher (2005b) does a<br />
better job of fitting Nafe and Drake for larger values of V P<br />
(as it<br />
should).<br />
C:\site_amp\daves_notes_<strong>on</strong>_<strong>relating</strong>_<strong>density</strong>_<strong>to</strong>_<strong>velocity</strong>_v1.2.doc,<br />
Modified <strong>on</strong> 3/2/2007<br />
7
Figure 4.<br />
C:\site_amp\daves_notes_<strong>on</strong>_<strong>relating</strong>_<strong>density</strong>_<strong>to</strong>_<strong>velocity</strong>_v1.2.doc,<br />
Modified <strong>on</strong> 3/2/2007<br />
8
Relating Density <strong>to</strong> Shear-Wave Velocity:<br />
At first thought it would seem that the relati<strong>on</strong>s given in equati<strong>on</strong>s (5),<br />
(6), and (7), in combinati<strong>on</strong> with equati<strong>on</strong>s <strong>relating</strong> VS<br />
and V<br />
P<br />
could be<br />
used <strong>to</strong> relate <strong>density</strong> and shear-wave <strong>velocity</strong>. Brocher (2005b, eq.<br />
9) gives the following relati<strong>on</strong> between VS<br />
and V<br />
P<br />
:<br />
V V V V<br />
2 3<br />
P(km/sec) = 0.9409 + 2.0947<br />
S<br />
− 0.8206<br />
S<br />
+ 0.2683<br />
S<br />
−0.0251<br />
V<br />
4<br />
S<br />
(8)<br />
A potential problem is that near-surface (largely at depths less than<br />
100 m) data indicate that the relati<strong>on</strong> should be multivalued, because<br />
below the water table V is c<strong>on</strong>trolled by the water <strong>velocity</strong> and<br />
P<br />
therefore the Poiss<strong>on</strong>’s ratio jumps <strong>to</strong> a large value. The multivalued<br />
relati<strong>on</strong>ship is shown in the graph below. The data come from <strong>velocity</strong><br />
models fit <strong>to</strong> many borehole measurements, as given in <strong>Boore</strong> (2003).<br />
The data in the graph below were extracted from the results provided<br />
by <strong>Boore</strong> (2003) as follows: (1) copy the Poiss<strong>on</strong>’s ratio files for all<br />
boreholes in<strong>to</strong> a folder “pr_out” (the program that produced these files<br />
subdivided layers if necessary so that both the P-wave and the S-<br />
wave <strong>velocity</strong> models had the same stack of c<strong>on</strong>stant <strong>velocity</strong> layers;<br />
this in general is not the case for the individual P-wave and S-wave<br />
model files); 2) use a Fortran program <strong>to</strong> read each Poiss<strong>on</strong>’s ratio file<br />
and write a summary file c<strong>on</strong>taining all P- and S-values at the same<br />
depths for all boreholes.<br />
C:\site_amp\daves_notes_<strong>on</strong>_<strong>relating</strong>_<strong>density</strong>_<strong>to</strong>_<strong>velocity</strong>_v1.2.doc,<br />
Modified <strong>on</strong> 3/2/2007<br />
9
10<br />
Brocher (2005) eq. 9<br />
x*sqrt(2*(1-0.20)/(1-2.0*0.20))<br />
x*sqrt(2*(1-0.25)/(1-2.0*0.25))<br />
x*sqrt(2*(1-0.30)/(1-2.0*0.30))<br />
x*sqrt(2*(1-0.35)/(1-2.0*0.35))<br />
from data in <strong>Boore</strong> OFR 03-191<br />
V P (km/sec)<br />
2<br />
1<br />
0.2<br />
File: C:\site_amp\vp_vs.draw; Date: 2007-02-26; Time: 11:08:28<br />
0.1<br />
0.1 0.2 1 2<br />
V S (km/sec)<br />
Figure 5.<br />
The straight lines in the figure above assume Poiss<strong>on</strong> ratio (σ ) values<br />
of 0.20, 0.25, 0.30, and 0.35. The green line (for σ = 0.30 ) seems like<br />
a good representati<strong>on</strong> of the average value.<br />
I will ignore the complicati<strong>on</strong> due <strong>to</strong> the multivalued nature of the<br />
relati<strong>on</strong> between VS<br />
and V<br />
P<br />
, which may be less important than it would<br />
first appear: values of <strong>density</strong> for soils with relatively low-shear wave<br />
velocities may be similar (and close <strong>to</strong> 2.0 gm/cc) for both dry and<br />
saturated soils. With this assumpti<strong>on</strong>, Figure 4 suggests that the<br />
following procedure, which is parallel <strong>to</strong> that proposed above for the<br />
ρ − V P<br />
correlati<strong>on</strong>, gives a reas<strong>on</strong>able fit <strong>to</strong> the scant data:<br />
C:\site_amp\daves_notes_<strong>on</strong>_<strong>relating</strong>_<strong>density</strong>_<strong>to</strong>_<strong>velocity</strong>_v1.2.doc,<br />
Modified <strong>on</strong> 3/2/2007<br />
10
VS<br />
< 0.30 km/sec: ρ=1.93 gm/cm<br />
3<br />
0.30 km/s < V S<br />
< 3.55 km/s : Use Brocher’s (2005b) relati<strong>on</strong> (equati<strong>on</strong> 8)<br />
between S-wave <strong>velocity</strong> and P-wave <strong>velocity</strong>, in combinati<strong>on</strong> with<br />
Gardner et al.’s (1974) relati<strong>on</strong> between P-wave <strong>velocity</strong> and <strong>density</strong><br />
(equati<strong>on</strong> 2). Note that using this procedure for S-wave velocities less<br />
than 0.3 km/s gives reas<strong>on</strong>able values of <strong>density</strong> (1.8 gm/cc for 0.1<br />
km/s), but I’ve kept the break <strong>to</strong> a c<strong>on</strong>stant <strong>density</strong> <strong>to</strong> have an<br />
algorithm parallel <strong>to</strong> that for P-wave velocities.<br />
3.55 km/s ≤ V S<br />
: Use Brocher’s (2005b) relati<strong>on</strong> (equati<strong>on</strong> 8) between S-<br />
wave <strong>velocity</strong> and P-wave <strong>velocity</strong>, in combinati<strong>on</strong> with Brocher’s<br />
(2005b) relati<strong>on</strong> between P-wave <strong>velocity</strong> and <strong>density</strong> (equati<strong>on</strong> 7).<br />
Acknowledgments<br />
I wish <strong>to</strong> thank Tom Brocher and Eric Thomps<strong>on</strong> for useful reviews and<br />
c<strong>on</strong>versati<strong>on</strong>s.<br />
References Cited<br />
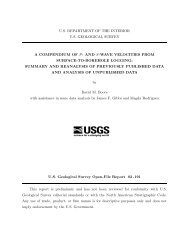
<strong>Boore</strong>, D. M. (2003). A compendium of P- and S-wave velocities from<br />
surface-<strong>to</strong>-borehole logging: Summary and reanalysis of previously<br />
published data and analysis of unpublished data, U. S. Geological<br />
Survey Open-File Report 03-191, 13 pp.<br />
Brocher, T. M. (2005a). Compressi<strong>on</strong>al and shear wave <strong>velocity</strong> versus<br />
depth in the San Francisco Bay Area, California: Rules for USGS Bay<br />
Area <strong>velocity</strong>, Model 05.0.0, U. S. Geological Survey Open-File Report<br />
05–1317, 58 pp.<br />
Brocher, T. M. (2005b). Empirical relati<strong>on</strong>s between elastic<br />
wavespeeds and <strong>density</strong> in the Earth’s crust, Bull. Seism. Soc. Am. 95,<br />
2081—2092.<br />
Clark, S. P., Jr. (Edi<strong>to</strong>r) (1966). Handbook of Physical C<strong>on</strong>stants,<br />
Geological Society of America Memoir 97, 587 p.<br />
{c<strong>on</strong>tains some references <strong>to</strong> porosity studies, as well as tables of<br />
densities}.<br />
Gardner, G. H. F., L. W. Gardner, and A. R. Gregory (1974). Formati<strong>on</strong><br />
<strong>velocity</strong> and <strong>density</strong>—the diagnostic basics for stratigraphic traps,<br />
Geophysics 39, 770-–780.<br />
C:\site_amp\daves_notes_<strong>on</strong>_<strong>relating</strong>_<strong>density</strong>_<strong>to</strong>_<strong>velocity</strong>_v1.2.doc,<br />
Modified <strong>on</strong> 3/2/2007<br />
11
Lambe, T. W. and R. V. Whitman (1969). Soil Mechanics, John Wiley &<br />
S<strong>on</strong>s, New York, 553 pp.<br />
Sheriff, R. E. and L. P. Geldart (1995). Explorati<strong>on</strong> Seismology,<br />
Cambridge University Press, Cambridge, UK, 2nd Editi<strong>on</strong>, 592 pp.<br />
Other References<br />
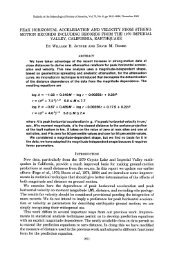
Castagna, J. P., M. L. Batzle, and T. K. Kan (1993) Rock physics; the<br />
link between rock properties and AVO resp<strong>on</strong>se, in Offset-Dependent<br />
Reflectivity - Theory and Practice of AVO Analysis, J. P. Castagna and<br />
M. M. Backus, Eds., Investigati<strong>on</strong>s in Geophysics, No. 8, Society of<br />
Explorati<strong>on</strong> Geophysicists, Tulsa, Oklahoma, 135--171.<br />
Grant, F. S. and G. F. West (1965). Interpretati<strong>on</strong> Theory in Applied<br />
Geophysics, McGraw-Hill Book Company, New York, NY, 584 pp.<br />
{pp. 192--200 c<strong>on</strong>tain an excellent discussi<strong>on</strong> of rock densities,<br />
including graphs from Birch indicating that soils and alluvia have<br />
densities from about 1.65 <strong>to</strong> 2.2, with peaks in the distributi<strong>on</strong> at 1.7<br />
and 1.9 (the latter being larger); also included is a plot of the Nafe and<br />
Drake P-wave vs <strong>density</strong> data.}<br />
Mavko, G., T. Mukerji, and J. Dvorkin (1998). The Rock Physics<br />
Handbook: Tools for Seismic Analysis in Porous Media, Cambridge<br />
University Press, Cambridge, UK, 329 pp.<br />
{c<strong>on</strong>tains a chapter <strong>on</strong> <strong>velocity</strong>—<strong>density</strong> relati<strong>on</strong>s; the chapter makes<br />
heavy use of Castagna et al., 1993---referenced above. Note that<br />
most of the figures in the Mavko book are available in a pdf file from<br />
http://pangea.stanford.edu/courses/gp262/Notes/16.avo.pdf.}<br />
Santamarina, J. C., K. A. Klein, and M. A. Fam (2001). Soils and<br />
Waves, John Wiley & S<strong>on</strong>s, Ltd, Chichester, UK, 488 pp.<br />
{excellent discussi<strong>on</strong> of porosity and wave speeds in particulate<br />
media}.<br />
C:\site_amp\daves_notes_<strong>on</strong>_<strong>relating</strong>_<strong>density</strong>_<strong>to</strong>_<strong>velocity</strong>_v1.2.doc,<br />
Modified <strong>on</strong> 3/2/2007<br />
12