cdms-ii - CDMS Experiment - University of California, Berkeley
cdms-ii - CDMS Experiment - University of California, Berkeley
cdms-ii - CDMS Experiment - University of California, Berkeley
You also want an ePaper? Increase the reach of your titles
YUMPU automatically turns print PDFs into web optimized ePapers that Google loves.
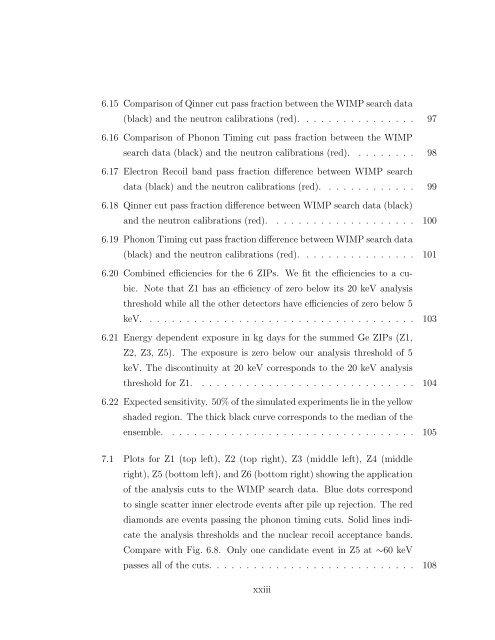
6.15 Comparison <strong>of</strong> Qinner cut pass fraction between the WIMP search data<br />
(black) and the neutron calibrations (red). . . . . . . . . . . . . . . . 97<br />
6.16 Comparison <strong>of</strong> Phonon Timing cut pass fraction between the WIMP<br />
search data (black) and the neutron calibrations (red). . . . . . . . . 98<br />
6.17 Electron Recoil band pass fraction difference between WIMP search<br />
data (black) and the neutron calibrations (red). . . . . . . . . . . . . 99<br />
6.18 Qinner cut pass fraction difference between WIMP search data (black)<br />
and the neutron calibrations (red). . . . . . . . . . . . . . . . . . . . 100<br />
6.19 Phonon Timing cut pass fraction difference between WIMP search data<br />
(black) and the neutron calibrations (red). . . . . . . . . . . . . . . . 101<br />
6.20 Combined efficiencies for the 6 ZIPs. We fit the efficiencies to a cubic.<br />
Note that Z1 has an efficiency <strong>of</strong> zero below its 20 keV analysis<br />
threshold while all the other detectors have efficiencies <strong>of</strong> zero below 5<br />
keV. . . . . . . . . . . . . . . . . . . . . . . . . . . . . . . . . . . . . 103<br />
6.21 Energy dependent exposure in kg days for the summed Ge ZIPs (Z1,<br />
Z2, Z3, Z5). The exposure is zero below our analysis threshold <strong>of</strong> 5<br />
keV. The discontinuity at 20 keV corresponds to the 20 keV analysis<br />
threshold for Z1. . . . . . . . . . . . . . . . . . . . . . . . . . . . . . 104<br />
6.22 Expected sensitivity. 50% <strong>of</strong> the simulated experiments lie in the yellow<br />
shaded region. The thick black curve corresponds to the median <strong>of</strong> the<br />
ensemble. . . . . . . . . . . . . . . . . . . . . . . . . . . . . . . . . . 105<br />
7.1 Plots for Z1 (top left), Z2 (top right), Z3 (middle left), Z4 (middle<br />
right), Z5 (bottom left), and Z6 (bottom right) showing the application<br />
<strong>of</strong> the analysis cuts to the WIMP search data. Blue dots correspond<br />
to single scatter inner electrode events after pile up rejection. The red<br />
diamonds are events passing the phonon timing cuts. Solid lines indicate<br />
the analysis thresholds and the nuclear recoil acceptance bands.<br />
Compare with Fig. 6.8. Only one candidate event in Z5 at ∼60 keV<br />
passes all <strong>of</strong> the cuts. . . . . . . . . . . . . . . . . . . . . . . . . . . . 108<br />
xx<strong>ii</strong>i


