biochemical study of freshwater fish catla catla with reference to ...
biochemical study of freshwater fish catla catla with reference to ...
biochemical study of freshwater fish catla catla with reference to ...

Create successful ePaper yourself
Turn your PDF publications into a flip-book with our unique Google optimized e-Paper software.
Iran. P. J. Martin, Environ. et Health. al., BIOCHEMICAL Sci. Eng., 2008, STUDY Vol. OF 5, FRESHWATER...<br />
No. 2, pp. 109-116<br />
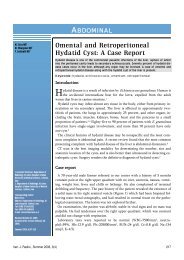
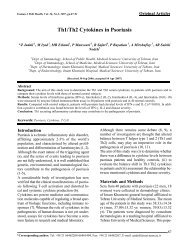
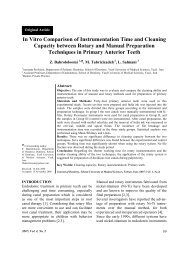
Enzyme analysis<br />
The activity <strong>of</strong> Na + -K + , Ca 2+ and Mg 2+ ATPase in<br />
muscle (Fig. 7), intestine (Fig. 8) and brain (Fig. 9)<br />
were estimated in the experimental <strong>fish</strong> after 24, 48,<br />
72 and 96h in 0.1, 0.3 and 0.5mg/L sub-lethal<br />
concentration <strong>of</strong> exposure <strong>to</strong> the mercury chloride.<br />
The alteration in the activity <strong>of</strong> enzymes <strong>of</strong> Na + K +<br />
ATPase were observed. The activity <strong>of</strong> Mg 2+<br />
ATPase in muscle (Fig. 10), intestine (Fig. 11) and<br />
brain (Fig. 12) were studied and the maximum<br />
depletion was observed in 96h, 72h, and 72h,<br />
respectively. The activity <strong>of</strong> Ca 2+ ATPase in muscle<br />
and depletion <strong>of</strong> enzyme activity was observed at all<br />
exposure periods, except for 96h (Fig. 13). In intestine,<br />
enzyme activity was gradually decreased in all<br />
exposures and increased during 96h (Fig. 14). In<br />
brain, the enzyme activity was also observed at all<br />
exposure periods except 96h (Fig. 15).<br />
mm pi released/mg protein/hr<br />
12<br />
10<br />
8<br />
6<br />
4<br />
2<br />
0<br />
24h hr 48h hr 72h hr 96hhr<br />
control 0.1 0.3 0.5<br />
Mercury concentrations Concentrations (mg/L) (ppm)<br />
Fig. 7: Alteration in Na + K + ATPase level (mm pi released/mg protein/h) in muscle tissue <strong>of</strong> Catla <strong>catla</strong> exposed <strong>to</strong><br />
different sublethal concentrations <strong>of</strong> mercury chloride <strong>with</strong> different exposure periods (n=6)<br />
mm pi released/mg protein/hr<br />
8<br />
7<br />
6<br />
5<br />
4<br />
3<br />
2<br />
1<br />
0<br />
24h hr 48h hr 72h hr 96h<br />
hr<br />
control 0.1 0.3 0.5<br />
Mercury Concentrations concentrations (ppm) (mg/L)<br />
Fig. 8: Alteration in Na + K + ATPase level (mm pi released/mg protein/h) in intestine tissue <strong>of</strong> Catla <strong>catla</strong> exposed <strong>to</strong><br />
different sublethal concentrations <strong>of</strong> mercury chloride <strong>with</strong> different exposure periods (n=6)<br />
mm pi released/mg protein/hr<br />
12<br />
10<br />
8<br />
6<br />
4<br />
2<br />
24h hr 48h hr 72h hr 96hhr<br />
0<br />
control 0.1 0.3 0.5<br />
Mercury Concentrations concentrations (ppm) (mg/L)<br />
Fig. 9: Alteration in Na + K + ATPase level (mm pi released/mg protein/h) in brain tissue <strong>of</strong> Catla <strong>catla</strong> exposed <strong>to</strong><br />
different sublethal concentrations <strong>of</strong> mercury chloride <strong>with</strong> different exposure periods (n=6)<br />
112