Astron 104 Laboratory #7 Sunspots and the Solar Cycle
Astron 104 Laboratory #7 Sunspots and the Solar Cycle
Astron 104 Laboratory #7 Sunspots and the Solar Cycle
Create successful ePaper yourself
Turn your PDF publications into a flip-book with our unique Google optimized e-Paper software.
Lab <strong>#7</strong><br />
Name:<br />
Date:<br />
Section:<br />
<strong>Astron</strong> <strong>104</strong> <strong>Laboratory</strong> <strong>#7</strong><br />
<strong>Sunspots</strong> <strong>and</strong> <strong>the</strong> <strong>Solar</strong> <strong>Cycle</strong><br />
Section 9.4<br />
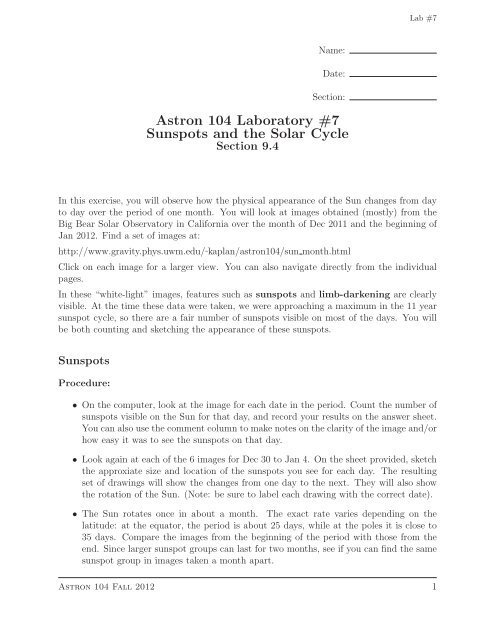
In this exercise, you will observe how <strong>the</strong> physical appearance of <strong>the</strong> Sun changes from day<br />
to day over <strong>the</strong> period of one month. You will look at images obtained (mostly) from <strong>the</strong><br />
Big Bear <strong>Solar</strong> Observatory in California over <strong>the</strong> month of Dec 2011 <strong>and</strong> <strong>the</strong> beginning of<br />
Jan 2012. Find a set of images at:<br />
http://www.gravity.phys.uwm.edu/˜kaplan/astron<strong>104</strong>/sun month.html<br />
Click on each image for a larger view. You can also navigate directly from <strong>the</strong> individual<br />
pages.<br />
In <strong>the</strong>se “white-light” images, features such as sunspots <strong>and</strong> limb-darkening are clearly<br />
visible. At <strong>the</strong> time <strong>the</strong>se data were taken, we were approaching a maximum in <strong>the</strong> 11 year<br />
sunspot cycle, so <strong>the</strong>re are a fair number of sunspots visible on most of <strong>the</strong> days. You will<br />
be both counting <strong>and</strong> sketching <strong>the</strong> appearance of <strong>the</strong>se sunspots.<br />
<strong>Sunspots</strong><br />
Procedure:<br />
• On <strong>the</strong> computer, look at <strong>the</strong> image for each date in <strong>the</strong> period. Count <strong>the</strong> number of<br />
sunspots visible on <strong>the</strong> Sun for that day, <strong>and</strong> record your results on <strong>the</strong> answer sheet.<br />
You can also use <strong>the</strong> comment column to make notes on <strong>the</strong> clarity of <strong>the</strong> image <strong>and</strong>/or<br />
how easy it was to see <strong>the</strong> sunspots on that day.<br />
• Look again at each of <strong>the</strong> 6 images for Dec 30 to Jan 4. On <strong>the</strong> sheet provided, sketch<br />
<strong>the</strong> approxiate size <strong>and</strong> location of <strong>the</strong> sunspots you see for each day. The resulting<br />
set of drawings will show <strong>the</strong> changes from one day to <strong>the</strong> next. They will also show<br />
<strong>the</strong> rotation of <strong>the</strong> Sun. (Note: be sure to label each drawing with <strong>the</strong> correct date).<br />
• The Sun rotates once in about a month. The exact rate varies depending on <strong>the</strong><br />
latitude: at <strong>the</strong> equator, <strong>the</strong> period is about 25 days, while at <strong>the</strong> poles it is close to<br />
35 days. Compare <strong>the</strong> images from <strong>the</strong> beginning of <strong>the</strong> period with those from <strong>the</strong><br />
end. Since larger sunspot groups can last for two months, see if you can find <strong>the</strong> same<br />
sunspot group in images taken a month apart.<br />
<strong>Astron</strong> <strong>104</strong> Fall 2012 1
Lab <strong>#7</strong><br />
Questions:<br />
1. Is it always clear just what is a single sunspot Do you think it better to split complicated<br />
regions into multiple spots, or lump <strong>the</strong>m all in toge<strong>the</strong>r<br />
2. What type of radiation do you expect to detect from <strong>the</strong> regions of <strong>the</strong> sunspots<br />
Why<br />
3. How could sunspot activity affect <strong>the</strong> wea<strong>the</strong>r on Earth<br />
<strong>Astron</strong> <strong>104</strong> Fall 2012 2
Lab <strong>#7</strong><br />
4. The photosphere (<strong>the</strong> visible surface of <strong>the</strong> Sun) is at a temperature of 5800K <strong>and</strong><br />
sunspots on average are around 4200K. What is <strong>the</strong> percent difference in temperature<br />
between<strong>the</strong>photosphere<strong>and</strong>sunspots Atwhatwavelengthdoes<strong>the</strong>radiationemitted<br />
by each region peak (Hint: use Wien’s law, which says that <strong>the</strong> peak wavelength<br />
λ peak = 3×10 6 nm/T, where T is in Kelvin)<br />
<strong>Solar</strong> <strong>Cycle</strong><br />
Now you will look at data taken once per month for 6 years (which is approximately half of<br />
a <strong>Solar</strong> <strong>Cycle</strong>):<br />
http://www.gravity.phys.uwm.edu/˜kaplan/astron<strong>104</strong>/sun cycle.html<br />
1. Look at <strong>the</strong> images for each date. Can you notice any trends between <strong>the</strong> beginning of<br />
<strong>the</strong> period (at <strong>the</strong> bottom of <strong>the</strong> page) <strong>and</strong> <strong>the</strong> end of <strong>the</strong> period (at <strong>the</strong> top) Which<br />
do you think is closer to <strong>the</strong> maximum of <strong>the</strong> <strong>Solar</strong> <strong>Cycle</strong>, when sun-spot activity is<br />
highest<br />
<strong>Astron</strong> <strong>104</strong> Fall 2012 3
Lab <strong>#7</strong><br />
Date Number of <strong>Sunspots</strong> Comments<br />
Nov 30<br />
Dec 01<br />
Dec 02<br />
Dec 03<br />
Dec 04<br />
Dec 05<br />
Dec 06<br />
Dec 07<br />
Dec 08<br />
Dec 09<br />
Dec 10<br />
Dec 11<br />
Dec 12<br />
Dec 13<br />
Dec 14<br />
Dec 15<br />
Dec 16<br />
Dec 17<br />
Dec 18<br />
Dec 19<br />
Dec 20<br />
(continued on next page...)<br />
<strong>Astron</strong> <strong>104</strong> Fall 2012 4
Lab <strong>#7</strong><br />
Date Number of <strong>Sunspots</strong> Comments<br />
Dec 21<br />
Dec 22<br />
Dec 23<br />
Dec 24<br />
Dec 25<br />
Dec 26<br />
Dec 27<br />
Dec 28<br />
Dec 29<br />
Dec 30<br />
Dec 31<br />
Jan 01<br />
Jan 02<br />
Jan 03<br />
Jan 04<br />
<strong>Astron</strong> <strong>104</strong> Fall 2012 5
Lab <strong>#7</strong><br />
Date:<br />
Date:<br />
Date:<br />
Date:<br />
Date:<br />
Date:<br />
<strong>Astron</strong> <strong>104</strong> Fall 2012 6


