Yanbu Cement Company (YNCC)
Yanbu Cement Company (YNCC)
Yanbu Cement Company (YNCC)

Create successful ePaper yourself
Turn your PDF publications into a flip-book with our unique Google optimized e-Paper software.
Ratio Analysis<br />
Cash Flow<br />
Balance Sheet<br />
Income Statement<br />
Global Research – Saudi Arabia<br />
<strong>Yanbu</strong> <strong>Cement</strong> <strong>Company</strong> (<strong>YNCC</strong>)<br />
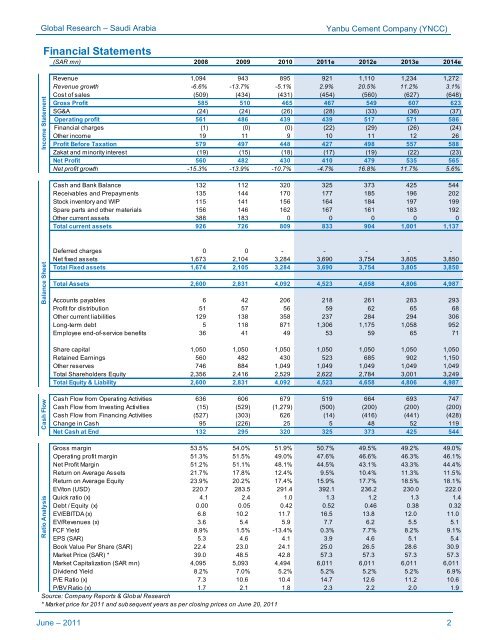
Financial Statements<br />
(SAR mn) 2008 2009 2010 2011e 2012e 2013e 2014e<br />
Revenue 1,094 943 895 921 1,110 1,234 1,272<br />
Revenue growth -6.6% -13.7% -5.1% 2.9% 20.5% 11.2% 3.1%<br />
Cost of sales (509) (434) (431) (454) (560) (627) (648)<br />
Gross Profit 585 510 465 467 549 607 623<br />
SG&A (24) (24) (26) (28) (33) (36) (37)<br />
Operating profit 561 486 439 439 517 571 586<br />
Financial charges (1) (0) (0) (22) (29) (26) (24)<br />
Other income 19 11 9 10 11 12 26<br />
Profit Before Taxation 579 497 448 427 498 557 588<br />
Zakat and minority interest (19) (15) (18) (17) (19) (22) (23)<br />
Net Profit 560 482 430 410 479 535 565<br />
Net profit growth -15.3% -13.9% -10.7% -4.7% 16.8% 11.7% 5.6%<br />
Cash and Bank Balance 132 112 320 325 373 425 544<br />
Receivables and Prepayments 135 144 170 177 185 196 202<br />
Stock inventory and WIP 115 141 156 164 184 197 199<br />
Spare parts and other materials 156 146 162 167 161 183 192<br />
Other current assets 388 183 0 0 0 0 0<br />
Total current assets 926 726 809 833 904 1,001 1,137<br />
Deferred charges 0 0 - - - - -<br />
Net fixed assets 1,673 2,104 3,284 3,690 3,754 3,805 3,850<br />
Total Fixed assets 1,674 2,105 3,284 3,690 3,754 3,805 3,850<br />
Total Assets 2,600 2,831 4,092 4,523 4,658 4,806 4,987<br />
Accounts payables 6 42 206 218 261 283 293<br />
Profit for distribution 51 57 56 59 62 65 68<br />
Other current liabilities 129 138 358 237 284 294 306<br />
Long-term debt 5 118 871 1,306 1,175 1,058 952<br />
Employee end-of-service benefits 36 41 49 53 59 65 71<br />
Share capital 1,050 1,050 1,050 1,050 1,050 1,050 1,050<br />
Retained Earnings 560 482 430 523 685 902 1,150<br />
Other reserves 746 884 1,049 1,049 1,049 1,049 1,049<br />
Total Shareholders Equity 2,356 2,416 2,529 2,622 2,784 3,001 3,249<br />
Total Equity & Liability 2,600 2,831 4,092 4,523 4,658 4,806 4,987<br />
Cash Flow from Operating Activities 636 606 679 519 664 693 747<br />
Cash Flow from Investing Activities (15) (529) (1,279) (500) (200) (200) (200)<br />
Cash Flow from Financing Activities (527) (303) 626 (14) (416) (441) (428)<br />
Change in Cash 95 (226) 25 5 48 52 119<br />
Net Cash at End 132 295 320 325 373 425 544<br />
Gross margin 53.5% 54.0% 51.9% 50.7% 49.5% 49.2% 49.0%<br />
Operating profit margin 51.3% 51.5% 49.0% 47.6% 46.6% 46.3% 46.1%<br />
Net Profit Margin 51.2% 51.1% 48.1% 44.5% 43.1% 43.3% 44.4%<br />
Return on Average Assets 21.7% 17.8% 12.4% 9.5% 10.4% 11.3% 11.5%<br />
Return on Average Equity 23.9% 20.2% 17.4% 15.9% 17.7% 18.5% 18.1%<br />
EV/ton (USD) 220.7 283.5 291.4 392.1 236.2 230.0 222.0<br />
Quick ratio (x) 4.1 2.4 1.0 1.3 1.2 1.3 1.4<br />
Debt / Equity (x) 0.00 0.05 0.42 0.52 0.46 0.38 0.32<br />
EV/EBITDA (x) 6.8 10.2 11.7 16.5 13.8 12.0 11.0<br />
EV/Revenues (x) 3.6 5.4 5.9 7.7 6.2 5.5 5.1<br />
FCF Yield 8.9% 1.5% -13.4% 0.3% 7.7% 8.2% 9.1%<br />
EPS (SAR) 5.3 4.6 4.1 3.9 4.6 5.1 5.4<br />
Book Value Per Share (SAR) 22.4 23.0 24.1 25.0 26.5 28.6 30.9<br />
Market Price (SAR) * 39.0 48.5 42.8 57.3 57.3 57.3 57.3<br />
Market Capitalization (SAR mn) 4,095 5,093 4,494 6,011 6,011 6,011 6,011<br />
Dividend Yield 8.2% 7.0% 5.2% 5.2% 5.2% 5.2% 6.9%<br />
P/E Ratio (x) 7.3 10.6 10.4 14.7 12.6 11.2 10.6<br />
P/BV Ratio (x) 1.7 2.1 1.8 2.3 2.2 2.0 1.9<br />
Source: <strong>Company</strong> Reports & Global Research<br />
* Market price for 2011 and subsequent years as per closing prices on June 20, 2011<br />
June – 2011 2