Yanbu Cement Company (YNCC)
Yanbu Cement Company (YNCC)
Yanbu Cement Company (YNCC)

You also want an ePaper? Increase the reach of your titles
YUMPU automatically turns print PDFs into web optimized ePapers that Google loves.
Jun-10<br />
Jul-10<br />
Aug-10<br />
Sep-10<br />
Oct-10<br />
Nov-10<br />
Dec-10<br />
Jan-11<br />
Feb-11<br />
Mar-11<br />
Apr-11<br />
May-11<br />
Jun-11<br />
Global Research<br />
Result Update<br />
Equity – Saudi Arabia<br />
<strong>Cement</strong> Sector<br />
21 June, 2011<br />
<strong>Yanbu</strong> <strong>Cement</strong> <strong>Company</strong> (<strong>YNCC</strong>)<br />
Market Data<br />
Bloomberg Code:<br />
<strong>YNCC</strong>O AB<br />
Reuters Code:<br />
3060.SE<br />
CMP (20 June 2011): SAR 57.3<br />
O/S (mn) 105.0<br />
Market Cap (SAR mn): 6,011<br />
Market Cap (USD mn): 1,603<br />
P/E 2011e (x): 14.7<br />
P/Bv 2011e (x): 2.3<br />
Price Performance 1-Yr<br />
High (SAR): 57.6<br />
Low (SAR): 39.0<br />
Average Volume: (000) 67.8<br />
1m 3m 12m<br />
Absolute (%) 12.3 29.5 39.3<br />
Relative (%) 16.8 27.9 36.7<br />
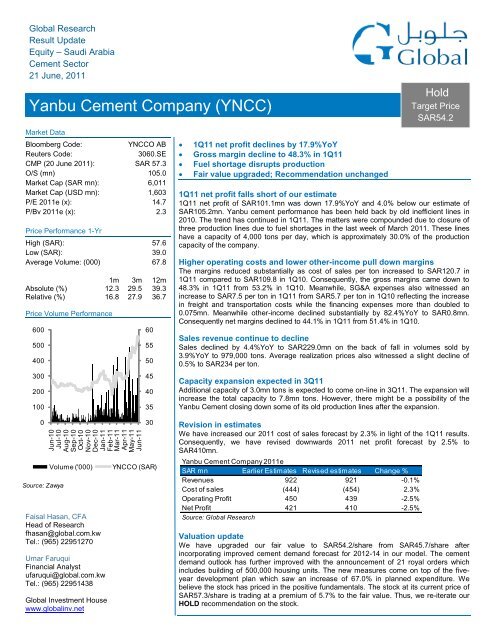
Price Volume Performance<br />
600<br />
500<br />
400<br />
300<br />
200<br />
100<br />
60<br />
55<br />
50<br />
45<br />
40<br />
35<br />
<br />
<br />
<br />
<br />
1Q11 net profit declines by 17.9%YoY<br />
Gross margin decline to 48.3% in 1Q11<br />
Fuel shortage disrupts production<br />
Fair value upgraded; Recommendation unchanged<br />
Hold<br />
Target Price<br />
SAR54.2<br />
1Q11 net profit falls short of our estimate<br />
1Q11 net profit of SAR101.1mn was down 17.9%YoY and 4.0% below our estimate of<br />
SAR105.2mn. <strong>Yanbu</strong> cement performance has been held back by old inefficient lines in<br />
2010. The trend has continued in 1Q11. The matters were compounded due to closure of<br />
three production lines due to fuel shortages in the last week of March 2011. These lines<br />
have a capacity of 4,000 tons per day, which is approximately 30.0% of the production<br />
capacity of the company.<br />
Higher operating costs and lower other-income pull down margins<br />
The margins reduced substantially as cost of sales per ton increased to SAR120.7 in<br />
1Q11 compared to SAR109.8 in 1Q10. Consequently, the gross margins came down to<br />
48.3% in 1Q11 from 53.2% in 1Q10. Meanwhile, SG&A expenses also witnessed an<br />
increase to SAR7.5 per ton in 1Q11 from SAR5.7 per ton in 1Q10 reflecting the increase<br />
in freight and transportation costs while the financing expenses more than doubled to<br />
0.075mn. Meanwhile other-income declined substantially by 82.4%YoY to SAR0.8mn.<br />
Consequently net margins declined to 44.1% in 1Q11 from 51.4% in 1Q10.<br />
Sales revenue continue to decline<br />
Sales declined by 4.4%YoY to SAR229.0mn on the back of fall in volumes sold by<br />
3.9%YoY to 979,000 tons. Average realization prices also witnessed a slight decline of<br />
0.5% to SAR234 per ton.<br />
Capacity expansion expected in 3Q11<br />
Additional capacity of 3.0mn tons is expected to come on-line in 3Q11. The expansion will<br />
increase the total capacity to 7.8mn tons. However, there might be a possibility of the<br />
<strong>Yanbu</strong> <strong>Cement</strong> closing down some of its old production lines after the expansion.<br />
0<br />
Source: Zawya<br />
Volume ('000)<br />
Faisal Hasan, CFA<br />
Head of Research<br />
fhasan@global.com.kw<br />
Tel.: (965) 22951270<br />
Umar Faruqui<br />
Financial Analyst<br />
ufaruqui@global.com.kw<br />
Tel.: (965) 22951438<br />
Global Investment House<br />
www.globalinv.net<br />
30<br />
<strong>YNCC</strong>O (SAR)<br />
Revision in estimates<br />
We have increased our 2011 cost of sales forecast by 2.3% in light of the 1Q11 results.<br />
Consequently, we have revised downwards 2011 net profit forecast by 2.5% to<br />
SAR410mn.<br />
<strong>Yanbu</strong> <strong>Cement</strong> <strong>Company</strong> 2011e<br />
SAR mn Earlier Estimates Revised estimates Change %<br />
Revenues 922 921 -0.1%<br />
Cost of sales (444) (454) 2.3%<br />
Operating Profit 450 439 -2.5%<br />
Net Profit 421 410 -2.5%<br />
Source: Global Research<br />
Valuation update<br />
We have upgraded our fair value to SAR54.2/share from SAR45.7/share after<br />
incorporating improved cement demand forecast for 2012-14 in our model. The cement<br />
demand outlook has further improved with the announcement of 21 royal orders which<br />
includes building of 500,000 housing units. The new measures come on top of the fiveyear<br />
development plan which saw an increase of 67.0% in planned expenditure. We<br />
believe the stock has priced in the positive fundamentals. The stock at its current price of<br />
SAR57.3/share is trading at a premium of 5.7% to the fair value. Thus, we re-iterate our<br />
HOLD recommendation on the stock.
Ratio Analysis<br />
Cash Flow<br />
Balance Sheet<br />
Income Statement<br />
Global Research – Saudi Arabia<br />
<strong>Yanbu</strong> <strong>Cement</strong> <strong>Company</strong> (<strong>YNCC</strong>)<br />
Financial Statements<br />
(SAR mn) 2008 2009 2010 2011e 2012e 2013e 2014e<br />
Revenue 1,094 943 895 921 1,110 1,234 1,272<br />
Revenue growth -6.6% -13.7% -5.1% 2.9% 20.5% 11.2% 3.1%<br />
Cost of sales (509) (434) (431) (454) (560) (627) (648)<br />
Gross Profit 585 510 465 467 549 607 623<br />
SG&A (24) (24) (26) (28) (33) (36) (37)<br />
Operating profit 561 486 439 439 517 571 586<br />
Financial charges (1) (0) (0) (22) (29) (26) (24)<br />
Other income 19 11 9 10 11 12 26<br />
Profit Before Taxation 579 497 448 427 498 557 588<br />
Zakat and minority interest (19) (15) (18) (17) (19) (22) (23)<br />
Net Profit 560 482 430 410 479 535 565<br />
Net profit growth -15.3% -13.9% -10.7% -4.7% 16.8% 11.7% 5.6%<br />
Cash and Bank Balance 132 112 320 325 373 425 544<br />
Receivables and Prepayments 135 144 170 177 185 196 202<br />
Stock inventory and WIP 115 141 156 164 184 197 199<br />
Spare parts and other materials 156 146 162 167 161 183 192<br />
Other current assets 388 183 0 0 0 0 0<br />
Total current assets 926 726 809 833 904 1,001 1,137<br />
Deferred charges 0 0 - - - - -<br />
Net fixed assets 1,673 2,104 3,284 3,690 3,754 3,805 3,850<br />
Total Fixed assets 1,674 2,105 3,284 3,690 3,754 3,805 3,850<br />
Total Assets 2,600 2,831 4,092 4,523 4,658 4,806 4,987<br />
Accounts payables 6 42 206 218 261 283 293<br />
Profit for distribution 51 57 56 59 62 65 68<br />
Other current liabilities 129 138 358 237 284 294 306<br />
Long-term debt 5 118 871 1,306 1,175 1,058 952<br />
Employee end-of-service benefits 36 41 49 53 59 65 71<br />
Share capital 1,050 1,050 1,050 1,050 1,050 1,050 1,050<br />
Retained Earnings 560 482 430 523 685 902 1,150<br />
Other reserves 746 884 1,049 1,049 1,049 1,049 1,049<br />
Total Shareholders Equity 2,356 2,416 2,529 2,622 2,784 3,001 3,249<br />
Total Equity & Liability 2,600 2,831 4,092 4,523 4,658 4,806 4,987<br />
Cash Flow from Operating Activities 636 606 679 519 664 693 747<br />
Cash Flow from Investing Activities (15) (529) (1,279) (500) (200) (200) (200)<br />
Cash Flow from Financing Activities (527) (303) 626 (14) (416) (441) (428)<br />
Change in Cash 95 (226) 25 5 48 52 119<br />
Net Cash at End 132 295 320 325 373 425 544<br />
Gross margin 53.5% 54.0% 51.9% 50.7% 49.5% 49.2% 49.0%<br />
Operating profit margin 51.3% 51.5% 49.0% 47.6% 46.6% 46.3% 46.1%<br />
Net Profit Margin 51.2% 51.1% 48.1% 44.5% 43.1% 43.3% 44.4%<br />
Return on Average Assets 21.7% 17.8% 12.4% 9.5% 10.4% 11.3% 11.5%<br />
Return on Average Equity 23.9% 20.2% 17.4% 15.9% 17.7% 18.5% 18.1%<br />
EV/ton (USD) 220.7 283.5 291.4 392.1 236.2 230.0 222.0<br />
Quick ratio (x) 4.1 2.4 1.0 1.3 1.2 1.3 1.4<br />
Debt / Equity (x) 0.00 0.05 0.42 0.52 0.46 0.38 0.32<br />
EV/EBITDA (x) 6.8 10.2 11.7 16.5 13.8 12.0 11.0<br />
EV/Revenues (x) 3.6 5.4 5.9 7.7 6.2 5.5 5.1<br />
FCF Yield 8.9% 1.5% -13.4% 0.3% 7.7% 8.2% 9.1%<br />
EPS (SAR) 5.3 4.6 4.1 3.9 4.6 5.1 5.4<br />
Book Value Per Share (SAR) 22.4 23.0 24.1 25.0 26.5 28.6 30.9<br />
Market Price (SAR) * 39.0 48.5 42.8 57.3 57.3 57.3 57.3<br />
Market Capitalization (SAR mn) 4,095 5,093 4,494 6,011 6,011 6,011 6,011<br />
Dividend Yield 8.2% 7.0% 5.2% 5.2% 5.2% 5.2% 6.9%<br />
P/E Ratio (x) 7.3 10.6 10.4 14.7 12.6 11.2 10.6<br />
P/BV Ratio (x) 1.7 2.1 1.8 2.3 2.2 2.0 1.9<br />
Source: <strong>Company</strong> Reports & Global Research<br />
* Market price for 2011 and subsequent years as per closing prices on June 20, 2011<br />
June – 2011 2
Global Research – Saudi Arabia<br />
<strong>Yanbu</strong> <strong>Cement</strong> <strong>Company</strong> (<strong>YNCC</strong>)<br />
Disclosure<br />
The following is a comprehensive list of disclosures which may or may not apply to all our researches. Only the relevant<br />
disclosures which apply to this particular research has been mentioned in the table below under the heading of disclosure.<br />
Disclosure Checklist<br />
<strong>Company</strong><br />
Recommendation<br />
Bloomberg<br />
Ticker<br />
Reuters<br />
Ticker Price Disclosure<br />
<strong>Yanbu</strong> <strong>Cement</strong> <strong>Company</strong> HOLD <strong>YNCC</strong>O AB 3060.SE SAR 57.3 1,10<br />
1. Global Investment House did not receive and will not receive any compensation from the company or anyone else for the<br />
preparation of this report.<br />
2. The company being researched holds more than 5% stake in Global Investment House.<br />
3. Global Investment House makes a market in securities issued by this company.<br />
4. Global Investment House acts as a corporate broker or sponsor to this company.<br />
5. The author of or an individual who assisted in the preparation of this report (or a member of his/her household) has a direct<br />
ownership position in securities issued by this company.<br />
6. An employee of Global Investment House serves on the board of directors of this company.<br />
7. Within the past year, Global Investment House has managed or co-managed a public offering for this company, for which it<br />
received fees.<br />
8. Global Investment House has received compensation from this company for the provision of investment banking or financial<br />
advisory services within the past year.<br />
9. Global Investment House expects to receive or intends to seek compensation for investment banking services from this<br />
company in the next three month.<br />
10. Please see special footnote below for other relevant disclosures.<br />
Global Research: Equity Ratings Definitions<br />
Global Rating<br />
Definition<br />
STRONG BUY<br />
BUY<br />
HOLD<br />
SELL<br />
Fair value of the stock is >20% from the current market price<br />
Fair value of the stock is between +10% and +20% from the current market price<br />
Fair value of the stock is between +10% and -10% from the current market price<br />
Fair value of the stock is < -10% from the current market price<br />
Disclaimer<br />
This material was produced by Global Investment House KSCC (‘Global’),a firm regulated by the Central Bank of Kuwait. This document is not<br />
to be used or considered as an offer to sell or a solicitation of an offer to buy any securities. Global may, from time to time to the extent permitted<br />
by law, participate or invest in other financing transactions with the issuers of the securities (‘securities’), perform services for or solicit business<br />
from such issuer, and/or have a position or effect transactions in the securities or options thereof. Global may, to the extent permitted by<br />
applicable Kuwaiti law or other applicable laws or regulations, effect transactions in the securities before this material is published to recipients.<br />
Information and opinions contained herein have been compiled or arrived by Global from sources believed to be reliable, but Global has not<br />
independently verified the contents of this document. Accordingly, no representation or warranty, express or implied, is made as to and no<br />
reliance should be placed on the fairness, accuracy, completeness or correctness of the information and opinions contained in this document.<br />
Global accepts no liability for any loss arising from the use of this document or its contents or otherwise arising in connection therewith. This<br />
document is not to be relied upon or used in substitution for the exercise of independent judgment. Global shall have no responsibility or liability<br />
whatsoever in respect of any inaccuracy in or omission from this or any other document prepared by Global for, or sent by Global to any person<br />
and any such person shall be responsible for conducting his own investigation and analysis of the information contained or referred to in this<br />
document and of evaluating the merits and risks involved in the securities forming the subject matter of this or other such document. Opinions<br />
and estimates constitute our judgment and are subject to change without prior notice. Past performance is not indicative of future results. This<br />
document does not constitute an offer or invitation to subscribe for or purchase any securities, and neither this document nor anything contained<br />
herein shall form the basis of any contract or commitment whatsoever. It is being furnished to you solely for your information and may not be<br />
reproduced or redistributed to any other person. Neither this report nor any copy hereof may be distributed in any jurisdiction outside Kuwait<br />
where its distribution may be restricted by law. Persons who receive this report should make themselves aware of and adhere to any such<br />
restrictions. By accepting this report you agree to be bound by the foregoing limitations.<br />
June - 2011 3
Global Investment House<br />
Website: www.globalinv.net<br />
Global Tower<br />
Sharq, Al-Shuhada Str.<br />
Tel. + (965) 2 295 1000<br />
Fax. + (965) 2 295 1005<br />
P.O. Box: 28807 Safat, 13149 Kuwait<br />
Research<br />
Faisal Hasan, CFA<br />
(965) 2295-1270<br />
fhasan@global.com.kw<br />
Index<br />
Rasha Al-Huneidi<br />
(965) 2295-1285<br />
huneidi@global.com.kw<br />
Brokerage<br />
Fouad Fahmi Darwish<br />
(965) 2295-1700<br />
fdarwish@global.com.kw<br />
Wealth Management - Kuwait<br />
Rasha Al-Qenaei<br />
(965) 2295-1380<br />
alqenaei@global.com.kw<br />
Wealth Management - International<br />
Fahad Al-Ibrahim<br />
(965) 2295-1400<br />
fahad@global.com.kw<br />
Global Kuwait<br />
Tel: (965) 2 295 1000<br />
Fax: (965) 2 295 1005<br />
P.O.Box 28807 Safat, 13149 Kuwait<br />
Global Bahrain<br />
Tel: (973) 17 210011<br />
Fax: (973) 17 210222<br />
P.O.Box 855 Manama, Bahrain<br />
Global Saudi Arabia<br />
Tel: (966) 1 2994100<br />
Fax: (966) 1 2994199<br />
P.O. Box 66930 Riyadh 11586,<br />
Kingdom of Saudi Arabia<br />
Global Egypt<br />
Tel: (202) 24189705/06<br />
Fax: (202) 22905972<br />
24 Cleopatra St., Heliopolis, Cairo<br />
Global UAE<br />
Tel: (971) 4 4477066<br />
Fax: (971) 4 4477067<br />
P.O. Box 121227 Dubai, UAE<br />
Global Jordan<br />
Tel: (962) 6 5005060<br />
Fax: (962) 6 5005066<br />
P.O.Box 3268 Amman 11180,<br />
Jordan<br />
Global Wealth Manager<br />
E-mail: contactus@global.com.kw<br />
Tel: (965) 1-804-242