IN CANADA, 2012 Appendices - Council of Canadian Academies
IN CANADA, 2012 Appendices - Council of Canadian Academies
IN CANADA, 2012 Appendices - Council of Canadian Academies

You also want an ePaper? Increase the reach of your titles
YUMPU automatically turns print PDFs into web optimized ePapers that Google loves.
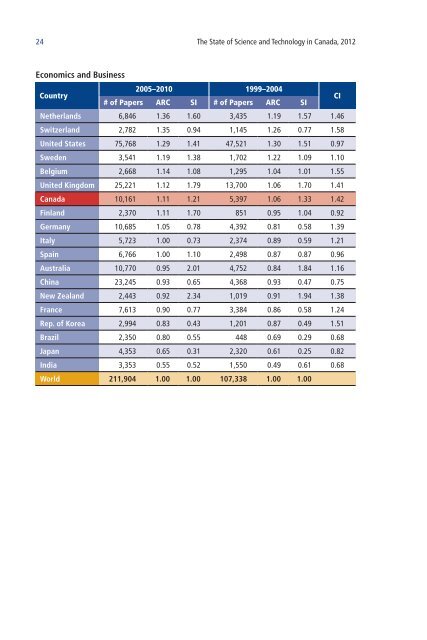
24 The State <strong>of</strong> Science and Technology in Canada, <strong>2012</strong><br />
Economics and Business<br />
Country<br />
2005–2010 1999–2004<br />
# <strong>of</strong> Papers ARC SI # <strong>of</strong> Papers ARC SI<br />
CI<br />
Netherlands 6,846 1.36 1.60 3,435 1.19 1.57 1.46<br />
Switzerland 2,782 1.35 0.94 1,145 1.26 0.77 1.58<br />
United States 75,768 1.29 1.41 47,521 1.30 1.51 0.97<br />
Sweden 3,541 1.19 1.38 1,702 1.22 1.09 1.10<br />
Belgium 2,668 1.14 1.08 1,295 1.04 1.01 1.55<br />
United Kingdom 25,221 1.12 1.79 13,700 1.06 1.70 1.41<br />
Canada 10,161 1.11 1.21 5,397 1.06 1.33 1.42<br />
Finland 2,370 1.11 1.70 851 0.95 1.04 0.92<br />
Germany 10,685 1.05 0.78 4,392 0.81 0.58 1.39<br />
Italy 5,723 1.00 0.73 2,374 0.89 0.59 1.21<br />
Spain 6,766 1.00 1.10 2,498 0.87 0.87 0.96<br />
Australia 10,770 0.95 2.01 4,752 0.84 1.84 1.16<br />
China 23,245 0.93 0.65 4,368 0.93 0.47 0.75<br />
New Zealand 2,443 0.92 2.34 1,019 0.91 1.94 1.38<br />
France 7,613 0.90 0.77 3,384 0.86 0.58 1.24<br />
Rep. <strong>of</strong> Korea 2,994 0.83 0.43 1,201 0.87 0.49 1.51<br />
Brazil 2,350 0.80 0.55 448 0.69 0.29 0.68<br />
Japan 4,353 0.65 0.31 2,320 0.61 0.25 0.82<br />
India 3,353 0.55 0.52 1,550 0.49 0.61 0.68<br />
World 211,904 1.00 1.00 107,338 1.00 1.00