Basic Principles of Life Insurance - The American College
Basic Principles of Life Insurance - The American College
Basic Principles of Life Insurance - The American College

You also want an ePaper? Increase the reach of your titles
YUMPU automatically turns print PDFs into web optimized ePapers that Google loves.
1.22 Essentials <strong>of</strong> <strong>Life</strong> <strong>Insurance</strong> Products<br />
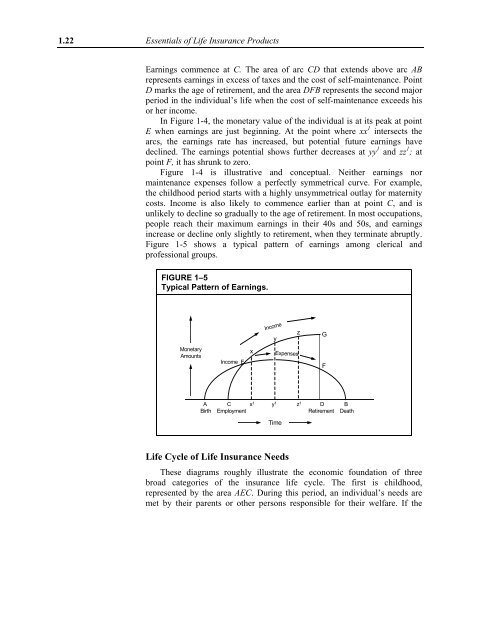
Earnings commence at C. <strong>The</strong> area <strong>of</strong> arc CD that extends above arc AB<br />
represents earnings in excess <strong>of</strong> taxes and the cost <strong>of</strong> self-maintenance. Point<br />
D marks the age <strong>of</strong> retirement, and the area DFB represents the second major<br />
period in the individual’s life when the cost <strong>of</strong> self-maintenance exceeds his<br />
or her income.<br />
In Figure 1-4, the monetary value <strong>of</strong> the individual is at its peak at point<br />
E when earnings are just beginning. At the point where xx 1 intersects the<br />
arcs, the earnings rate has increased, but potential future earnings have<br />
declined. <strong>The</strong> earnings potential shows further decreases at yy 1 and zz 1 ; at<br />
point F, it has shrunk to zero.<br />
Figure 1-4 is illustrative and conceptual. Neither earnings nor<br />
maintenance expenses follow a perfectly symmetrical curve. For example,<br />
the childhood period starts with a highly unsymmetrical outlay for maternity<br />
costs. Income is also likely to commence earlier than at point C, and is<br />
unlikely to decline so gradually to the age <strong>of</strong> retirement. In most occupations,<br />
people reach their maximum earnings in their 40s and 50s, and earnings<br />
increase or decline only slightly to retirement, when they terminate abruptly.<br />
Figure 1-5 shows a typical pattern <strong>of</strong> earnings among clerical and<br />
pr<strong>of</strong>essional groups.<br />
FIGURE 1–5<br />
Typical Pattern <strong>of</strong> Earnings.<br />
Income<br />
y<br />
z<br />
G<br />
Monetary<br />
Amounts<br />
Income E<br />
x<br />
Expenses<br />
F<br />
A C x 1 y 1 z 1 D B<br />
Birth Employment Retirement Death<br />
Time<br />
<strong>Life</strong> Cycle <strong>of</strong> <strong>Life</strong> <strong>Insurance</strong> Needs<br />
<strong>The</strong>se diagrams roughly illustrate the economic foundation <strong>of</strong> three<br />
broad categories <strong>of</strong> the insurance life cycle. <strong>The</strong> first is childhood,<br />
represented by the area AEC. During this period, an individual’s needs are<br />
met by their parents or other persons responsible for their welfare. If the