Preliminary World Airport Traffic 2009 - ACI
Preliminary World Airport Traffic 2009 - ACI
Preliminary World Airport Traffic 2009 - ACI

You also want an ePaper? Increase the reach of your titles
YUMPU automatically turns print PDFs into web optimized ePapers that Google loves.
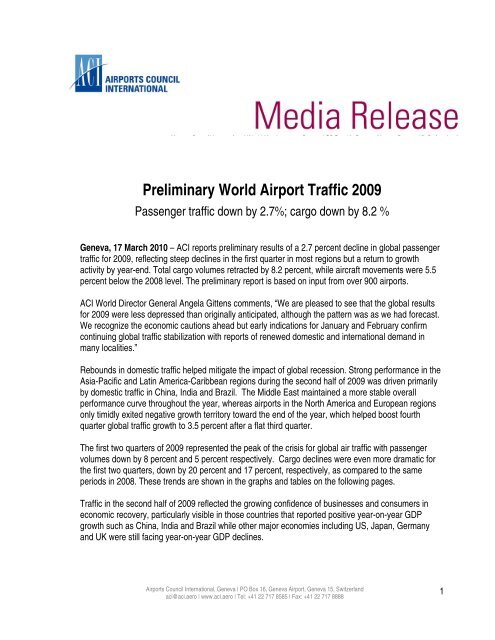
<strong>Preliminary</strong> <strong>World</strong> <strong>Airport</strong> <strong>Traffic</strong> <strong>2009</strong><br />
Passenger traffic down by 2.7%; cargo down by 8.2 %<br />
Geneva, 17 March 2010 – <strong>ACI</strong> reports preliminary results of a 2.7 percent decline in global passenger<br />
traffic for <strong>2009</strong>, reflecting steep declines in the first quarter in most regions but a return to growth<br />
activity by year-end. Total cargo volumes retracted by 8.2 percent, while aircraft movements were 5.5<br />
percent below the 2008 level. The preliminary report is based on input from over 900 airports.<br />
<strong>ACI</strong> <strong>World</strong> Director General Angela Gittens comments, “We are pleased to see that the global results<br />
for <strong>2009</strong> were less depressed than originally anticipated, although the pattern was as we had forecast.<br />
We recognize the economic cautions ahead but early indications for January and February confirm<br />
continuing global traffic stabilization with reports of renewed domestic and international demand in<br />
many localities.”<br />
Rebounds in domestic traffic helped mitigate the impact of global recession. Strong performance in the<br />
Asia-Pacific and Latin America-Caribbean regions during the second half of <strong>2009</strong> was driven primarily<br />
by domestic traffic in China, India and Brazil. The Middle East maintained a more stable overall<br />
performance curve throughout the year, whereas airports in the North America and European regions<br />
only timidly exited negative growth territory toward the end of the year, which helped boost fourth<br />
quarter global traffic growth to 3.5 percent after a flat third quarter.<br />
The first two quarters of <strong>2009</strong> represented the peak of the crisis for global air traffic with passenger<br />
volumes down by 8 percent and 5 percent respectively. Cargo declines were even more dramatic for<br />
the first two quarters, down by 20 percent and 17 percent, respectively, as compared to the same<br />
periods in 2008. These trends are shown in the graphs and tables on the following pages.<br />
<strong>Traffic</strong> in the second half of <strong>2009</strong> reflected the growing confidence of businesses and consumers in<br />
economic recovery, particularly visible in those countries that reported positive year-on-year GDP<br />
growth such as China, India and Brazil while other major economies including US, Japan, Germany<br />
and UK were still facing year-on-year GDP declines.<br />
<strong>Airport</strong>s Council International, Geneva | PO Box 16, Geneva <strong>Airport</strong>, Geneva 15, Switzerland<br />
aci@aci.aero | www.aci.aero | Tel: +41 22 717 8585 | Fax: +41 22 717 8888<br />
1
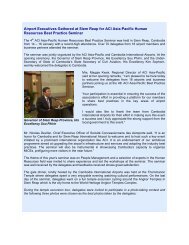
Gittens concludes, “<strong>Airport</strong> managers maintain a long-term focus within a constantly evolving business<br />
context. With customer demand on the rise once again, airports and their partners face an additional<br />
set of challenges. Renewed growth will require well-planned investments made in a spirit of partnership<br />
with airlines, air traffic control providers, and the many partners and community stakeholders who<br />
share our dual objectives of service delivery excellence and maximum cost effectiveness for all users.”<br />
SUMMARY: PRELIMINARY RESULTS FOR <strong>2009</strong>, compared to final results 2008<br />
Total Passengers: 4.4 billion, -2.7%<br />
Total International Passengers: 1.8 billion, -4.2%<br />
Total Cargo (includes mail): 71.3 million metric tonnes, -8.2%<br />
Total International Freight: 41.7 million metric tonnes, -10.1%<br />
Total Aircraft Movements: 63.9 million, -5.5%<br />
* Please note that these figures and percentages are based on both the submissions submitted by the 906<br />
reporting entities representing 93% of global traffic. The final confirmed report will be published in July 2010 and<br />
will include any outstanding reports (1300+ airports), therefore figures are subject to slight variation.<br />
Total traffic<br />
The regional results are represented in Tables 1 and 2 (page 3). Among the top 20 busiest airports<br />
worldwide, Beijing, Dubai, Bangkok and San Francisco were the only airports registering new<br />
growth. Beijing leaped to rank 3 with growth of 17 percent. The top 30 listings are provided in Tables 3,<br />
4 and 5.<br />
In the top 100 listing, 26 airports showed positive growth, and of the 26 only Cairo, San Francisco,<br />
Baltimore and Istanbul were not located in either the Asia-Pacific Region (mainly China) or Brazil.<br />
Others in the top100 fared less well: Vancouver, London Stansted, Detroit, Stockholm Arlanda, St.<br />
Louis, Manchester, Dublin and Osaka report double digit declines.<br />
International traffic<br />
Amongst those airports reporting international traffic results, Beirut, Kuwait and Sharjah were the<br />
leaders of the top 100 international airports and the only ones showing double digit growth. Dubai grew<br />
by 9.6 percent solidifying its 6th rank. Kuala Lumpur and Istanbul airports were the only other two<br />
among the top 20 international airports that reported growth of 9 percent and 8 percent respectively.<br />
Mexico City and Cancun both suffered declines of 13 percent in international passengers as a result of<br />
significant declines in the wake of the H1N1 outbreak in the second quarter of <strong>2009</strong>.<br />
Notes for Editors<br />
1. <strong>ACI</strong>, the only worldwide association of airports, is a non-profit organisation whose prime purpose is to represent<br />
the interests of airports and to promote professional excellence in airport management and operations. <strong>ACI</strong> has 575<br />
members who operate over 1600 airports in 179 countries and territories.<br />
2. For queries concerning the statistics, please contact Nancy Gautier, Director Communications at <strong>ACI</strong> <strong>World</strong><br />
ngautier@aci.aero or tel +41 22 717 8562.<br />
3. 906 airports contributed to the global preliminary rankings and 612 in international; results may change slightly<br />
when confirmed figures from all airports worldwide (approx. 1300) are submitted and tabulated in July <strong>2009</strong>.<br />
<strong>Airport</strong>s Council International, Geneva | PO Box 16, Geneva <strong>Airport</strong>, Geneva 15, Switzerland<br />
aci@aci.aero | www.aci.aero | Tel: +41 22 717 8585 | Fax: +41 22 717 8888<br />
2
CHART 1 -- <strong>Traffic</strong> Trends 2008 and <strong>2009</strong><br />
15<br />
10<br />
EVOLUTION OF AIRPORT TRAFFIC WORLDWIDE<br />
2008<br />
Passengers Cargo Movements<br />
% CHANGE FROM PREVIOUS YEAR<br />
5<br />
0<br />
-5<br />
-10<br />
-15<br />
-20<br />
-25<br />
JAN FEB MAR APR MAY JUN JUL AUG SEP OCT NOV DEC<br />
25<br />
20<br />
EVOLUTION OF AIRPORT TRAFFIC WORLDWIDE<br />
<strong>2009</strong><br />
Passengers Cargo Movements<br />
% CHANGE FROM PREVIOUS YEAR<br />
15<br />
10<br />
5<br />
0<br />
-5<br />
-10<br />
-15<br />
-20<br />
-25<br />
JAN FEB MAR APR MAY JUN JUL AUG SEP OCT NOV DEC<br />
<strong>Airport</strong>s Council International, Geneva | PO Box 16, Geneva <strong>Airport</strong>, Geneva 15, Switzerland<br />
aci@aci.aero | www.aci.aero | Tel: +41 22 717 8585 | Fax: +41 22 717 8888<br />
3
TABLE 1 - WORLDWIDE AIRPORT TRAFFIC REPORT SUMMARY<br />
<strong>Preliminary</strong> Results <strong>2009</strong><br />
STATS<br />
REGIONS<br />
PASSENGERS<br />
percent<br />
change<br />
CARGO<br />
percent<br />
change<br />
MOVEMENTS<br />
percent<br />
change<br />
AFR 134 597 889 (1.8) 1 463 857 (10.6) 2 275 227 (2.4)<br />
ASP 1 076 357 816 3.2 25 842 088 (4.9) 9 826 861 1.8<br />
EUR 1 351 649 669 (5.5) 14 873 077 (11.4) 17 733 698 (7.1)<br />
LAC 296 746 850 0.8 3 260 502 (12.2) 5 102 789 (1.8)<br />
MEA 100 141 509 7.1 3 810 713 3.4 963 981 6.0<br />
NAM 1 419 126 381 (5.4) 22 053 069 (10.7) 28 045 047 (8.0)<br />
<strong>ACI</strong> 4 378 620 114 (2.7) 71 303 306 (8.2) 63 947 603 (5.5)<br />
Passengers<br />
Cargo<br />
Movements<br />
total passengers enplaned and deplaned; passengers in transit counted once.<br />
loaded and unloaded freight and mail in metric tonnes.<br />
landing or take-off of an aircraft.<br />
Number of participating airports by region included in this summary in <strong>2009</strong>:<br />
AFR: 121; ASP: 130; EUR: 307; LAC: 155; MEA: 13; NAM: 180<br />
TOTAL: 906<br />
TABLE 2 - INTERNATIONAL PASSENGER & FREIGHT SUMMARY<br />
<strong>Preliminary</strong> Results <strong>2009</strong><br />
STATS<br />
REGIONS<br />
INTERNATIONAL<br />
PASSENGERS<br />
percent<br />
change<br />
INTERNATIONAL<br />
FREIGHT<br />
percent<br />
change<br />
AFR 86 801 785 (0.7) 1 287 187 (12.3)<br />
ASP 384 039 154 (1.7) 17 708 177 (9.6)<br />
EUR 962 707 632 (6.2) 10 958 502 (11.5)<br />
LAC 95 858 154 (6.0) 2 056 548 (12.7)<br />
MEA 96 057 842 7.9 3 711 663 3.5<br />
NAM 186 386 939 (5.3) 5 983 836 (14.7)<br />
<strong>ACI</strong> 1 811 851 506 (4.2) 41 705 913 (10.1)<br />
International (Passengers/Freight) traffic (passengers and freight) performed between the designated<br />
airport and an airport in another country/territory<br />
Freight comprises goods, newspapers, diplomatic bags, parcel post and express parcel; does not include<br />
passenger baggage and trucked freight; loaded and unloaded in metric tonnes.<br />
Number of participating airports by region included in the international summary in <strong>2009</strong>:<br />
AFR: 95 ASP: 89 EUR: 248 LAC: 95 MEA: 13 NAM: 72<br />
TOTAL: 612<br />
<strong>Airport</strong>s Council International, Geneva | PO Box 16, Geneva <strong>Airport</strong>, Geneva 15, Switzerland<br />
aci@aci.aero | www.aci.aero | Tel: +41 22 717 8585 | Fax: +41 22 717 8888<br />
4
WORLD’S BUSIEST AIRPORTS – <strong>Preliminary</strong> Ranking<br />
Table 3 – AIRCRAFT MOVEMENTS <strong>2009</strong><br />
MOVEMENTS<br />
RANK AIRPORT CODE Take-off and<br />
Landings<br />
Percent<br />
change<br />
1 ATLANTA GA, US ATL 970 235 (0.8)<br />
2 CHICAGO IL, US ORD 827 679 (6.1)<br />
3 DALLAS/FORT WORTH TX, US DFW 638 782 (2.5)<br />
4 DENVER CO, US DEN 606 006 (2.2)<br />
5 HOUSTON TX, US IAH 578 150 (5.8)<br />
6 LOS ANGELES CA, US LAX 545 210 (12.4)<br />
7 PARIS, FR CDG 525 314 (6.2)<br />
8 LAS VEGAS NV, US LAS 511 064 (11.7)<br />
9 CHARLOTTE NC, US CLT 509 358 (5.0)<br />
10 BEIJING, CN PEK 488 495 13.6<br />
11 PHILADELPHIA PA, US PHL 472 668 (3.9)<br />
12 LONDON, GB LHR 466 393 (2.6)<br />
13 FRANKFURT, DE FRA 463 111 (4.7)<br />
14 PHOENIX AZ, US PHX 457 207 (9.0)<br />
15 MADRID, ES MAD 435 179 (7.4)<br />
16 MINNEAPOLIS MN, US MSP 432 604 (3.7)<br />
17 DETROIT MI, US DTW 432 589 (6.5)<br />
18 NEW YORK NY, US JFK 412 980 (5.2)<br />
19 NEWARK NJ, US EWR 411 185 (5.2)<br />
20 TORONTO ON, CA YYZ 407 736 (5.3)<br />
21 AMSTERDAM, NL AMS 406 969 (8.9)<br />
22 PHOENIX AZ, US DVT 402 335 6.9<br />
23 MUNICH, DE MUC 396 805 (8.2)<br />
24 SAN FRANCISCO CA, US SFO 379 751 (2.1)<br />
25 SALT LAKE CITY UT, US SLC 372 354 (4.3)<br />
26 NEW YORK NY, US LGA 353 191 (6.7)<br />
27 MIAMI FL, US MIA 351 417 (5.7)<br />
28 LOS ANGELES CA, US VNY 351 233 (9.2)<br />
29 MEXICO CITY, MX MEX 348 060 (5.0)<br />
30 BOSTON MA, US BOS 345 306 (7.1)<br />
The figures in the summary table have been submitted by 906 airports, which together represent 93% of traffic<br />
worldwide.<br />
<strong>Airport</strong>s Council International, Geneva | PO Box 16, Geneva <strong>Airport</strong>, Geneva 15, Switzerland<br />
aci@aci.aero | www.aci.aero | Tel: +41 22 717 8585 | Fax: +41 22 717 8888<br />
5
WORLD’S BUSIEST AIRPORTS – <strong>Preliminary</strong> Ranking<br />
Table 4 – TOTAL PASSENGER TRAFFIC <strong>2009</strong><br />
PASSENGERS<br />
RANK AIRPORT CITY / COUNTRY CODE (Enplaning and<br />
deplaning)<br />
Percent<br />
change<br />
1 ATLANTA GA, US ATL 87 993 451 (2.3)<br />
2 LONDON, GB LHR 66 037 578 (1.5)<br />
3 BEIJING, CN PEK 65 329 851 16.8<br />
4 CHICAGO IL, US ORD 64 397 891 (8.8)<br />
5 TOKYO, JP HND 61 903 656 (7.2)<br />
6 PARIS, FR CDG 57 884 954 (4.9)<br />
7 LOS ANGELES CA, US LAX 56 518 605 (5.5)<br />
8 DALLAS/FORT WORTH TX, US DFW 56 030 457 (1.9)<br />
9 FRANKFURT, DE FRA 50 932 840 (4.7)<br />
10 DENVER CO, US DEN 50 167 485 (2.1)<br />
11 MADRID, ES MAD 48 248 890 (5.1)<br />
12 NEW YORK NY, US JFK 45 912 430 (3.9)<br />
13 HONG KONG, HK HKG 45 560 888 (4.8)<br />
14 AMSTERDAM, NL AMS 43 569 553 (8.1)<br />
15 DUBAI, AE DXB 40 901 752 9.2<br />
16 BANGKOK, TH BKK 40 500 269 4.9<br />
17 LAS VEGAS NV, US LAS 40 460 310 (8.2)<br />
18 HOUSTON TX, US IAH 39 993 236 (4.1)<br />
19 PHOENIX AZ, US PHX 37 824 982 (5.2)<br />
20 SAN FRANCISCO CA, US SFO 37 366 287 0.2<br />
21 SINGAPORE, SG SIN 37 203 978 (1.3)<br />
22 GUANGZHOU, CN CAN 37 048 550 10.8<br />
23 JAKARTA, ID CGK 36 466 823 13.3<br />
24 CHARLOTTE NC, US CLT 34 577 808 (0.5)<br />
25 MIAMI FL, US MIA 33 886 025 (0.5)<br />
26 ORLANDO FL, US MCO 33 731 431 (5.4)<br />
27 ROME, IT FCO 33 723 213 (4.0)<br />
28 SYDNEY, AU SYD 33 444 687 0.4<br />
29 NEWARK NJ, US EWR 33 400 626 (5.5)<br />
30 MUNICH, DE MUC 32 681 067 (5.4)<br />
The figures in the summary table have been submitted by 906 airports, which together represent 93% of traffic<br />
worldwide.<br />
<strong>Airport</strong>s Council International, Geneva | PO Box 16, Geneva <strong>Airport</strong>, Geneva 15, Switzerland<br />
aci@aci.aero | www.aci.aero | Tel: +41 22 717 8585 | Fax: +41 22 717 8888<br />
6
WORLD’S BUSIEST AIRPORTS – <strong>Preliminary</strong> Ranking<br />
Table 5 – TOTAL CARGO TRAFFIC <strong>2009</strong><br />
CARGO (Metric tonnes)<br />
RANK AIRPORT CODE Loaded and<br />
unloaded<br />
Percent<br />
change<br />
1 MEMPHIS TN, US MEM 3 697 185 0.4<br />
2 HONG KONG, HK HKG 3 384 765 (7.5)<br />
3 SHANGHAI, CN PVG 2 539 284 (2.3)<br />
4 INCHEON, KR ICN 2 313 001 (4.6)<br />
5 ANCHORAGE AK, US ANC 1 990 061 (14.9)<br />
6 LOUISVILLE KY, US SDF 1 949 130 (1.3)<br />
7 DUBAI, AE DXB 1 927 520 5.6<br />
8 FRANKFURT, DE FRA 1 887 718 (10.6)<br />
9 TOKYO, JP NRT 1 851 972 (11.8)<br />
10 PARIS, FR CDG 1 818 503 (10.8)<br />
11 SINGAPORE, SG SIN 1 660 851 (11.8)<br />
12 MIAMI FL, US MIA 1 557 401 (13.8)<br />
13 LOS ANGELES CA, US LAX 1 506 295 (7.6)<br />
14 BEIJING, CN PEK 1 420 977 4.0<br />
15 TAIPEI, TW TPE 1 358 304 (9.0)<br />
16 LONDON, GB LHR 1 349 574 (9.2)<br />
17 AMSTERDAM, NL AMS 1 314 938 (17.9)<br />
18 CHICAGO IL, US ORD 1 150 027 (14.1)<br />
19 NEW YORK NY, US JFK 1 135 043 (21.8)<br />
20 BANGKOK, TH BKK 1 045 194 (10.9)<br />
21 GUANGZHOU, CN CAN 955 271 39.3<br />
22 INDIANAPOLIS IN, US IND 900 583 (9.0)<br />
23 TOKYO, JP HND 779 103 (8.3)<br />
24 NEWARK NJ, US EWR 767 668 (13.5)<br />
25 LUXEMBOURG, LU LUX 628 641 (20.2)<br />
26 OSAKA, JP KIX 608 871 (28.0)<br />
27 SHENZHEN, CN SZX 606 013 1.3<br />
28 DALLAS/FORT WORTH TX, US DFW 601 780 (8.6)<br />
29 KUALA LUMPUR, MY KUL 601 409 (9.7)<br />
30 MUMBAI, IN BOM 568 007 1.6<br />
The figures in the summary table have been submitted by 906 airports, which together represent 93% of traffic<br />
worldwide.<br />
- END -<br />
<strong>Airport</strong>s Council International, Geneva | PO Box 16, Geneva <strong>Airport</strong>, Geneva 15, Switzerland<br />
aci@aci.aero | www.aci.aero | Tel: +41 22 717 8585 | Fax: +41 22 717 8888<br />
7