2012 CAFR - Pickerington Local School District
2012 CAFR - Pickerington Local School District
2012 CAFR - Pickerington Local School District

You also want an ePaper? Increase the reach of your titles
YUMPU automatically turns print PDFs into web optimized ePapers that Google loves.
PICKERINGTON LOCAL SCHOOL DISTRICT<br />
FAIRFIELD COUNTY, OHIO<br />
MANAGEMENT’S DISCUSSION AND ANALYSIS<br />
FOR THE FISCAL YEAR ENDED JUNE 30, <strong>2012</strong><br />
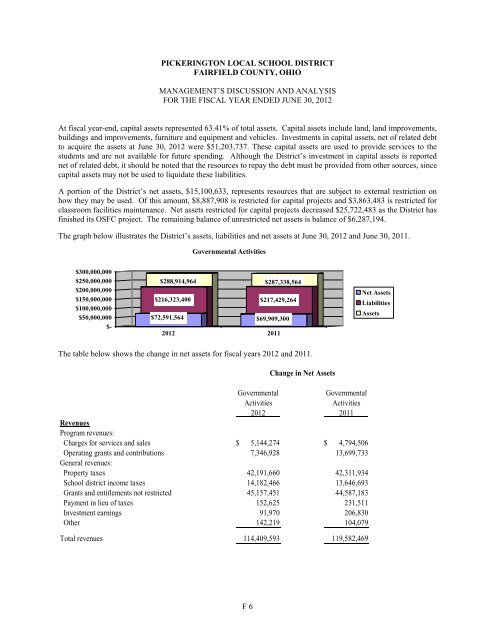
At fiscal year-end, capital assets represented 63.41% of total assets. Capital assets include land, land improvements,<br />
buildings and improvements, furniture and equipment and vehicles. Investments in capital assets, net of related debt<br />
to acquire the assets at June 30, <strong>2012</strong> were $51,203,737. These capital assets are used to provide services to the<br />
students and are not available for future spending. Although the <strong>District</strong>’s investment in capital assets is reported<br />
net of related debt, it should be noted that the resources to repay the debt must be provided from other sources, since<br />
capital assets may not be used to liquidate these liabilities.<br />
A portion of the <strong>District</strong>’s net assets, $15,100,633, represents resources that are subject to external restriction on<br />
how they may be used. Of this amount, $8,887,908 is restricted for capital projects and $3,863,483 is restricted for<br />
classroom facilities maintenance. Net assets restricted for capital projects decreased $25,722,483 as the <strong>District</strong> has<br />
finished its OSFC project. The remaining balance of unrestricted net assets is balance of $6,287,194.<br />
The graph below illustrates the <strong>District</strong>’s assets, liabilities and net assets at June 30, <strong>2012</strong> and June 30, 2011.<br />
Governmental Activities<br />
$300,000,000<br />
$250,000,000<br />
$200,000,000<br />
$150,000,000<br />
$100,000,000<br />
$50,000,000<br />
$-<br />
$288,914,964 $287,338,564<br />
$216,323,400 $217,429,264<br />
$72,591,564 $69,909,300<br />
<strong>2012</strong> 2011<br />
Net Assets<br />
Liabilities<br />
Assets<br />
The table below shows the change in net assets for fiscal years <strong>2012</strong> and 2011.<br />
Change in Net Assets<br />
Governmental<br />
Governmental<br />
Activities<br />
Activities<br />
<strong>2012</strong> 2011<br />
Revenues<br />
Program revenues:<br />
Charges for services and sales $ 5,144,274<br />
$ 4,794,506<br />
Operating grants and contributions 7,346,928 13,699,733<br />
General revenues:<br />
Property taxes 42,191,660 42,311,934<br />
<strong>School</strong> district income taxes 14,182,466 13,646,693<br />
Grants and entitlements not restricted 45,157,451 44,587,183<br />
Payment in lieu of taxes 152,625 231,511<br />
Investment earnings 91,970 206,830<br />
Other 142,219 104,079<br />
Total revenues 114,409,593 119,582,469<br />
F 6