Study on under-floor flow to reduce ballast flying phenomena ... - UIC
Study on under-floor flow to reduce ballast flying phenomena ... - UIC
Study on under-floor flow to reduce ballast flying phenomena ... - UIC

Create successful ePaper yourself
Turn your PDF publications into a flip-book with our unique Google optimized e-Paper software.
2.2 Wind tunnel tests<br />
In the <strong>on</strong>-track tests, we c<strong>on</strong>firmed that the <strong>under</strong>-<strong>floor</strong> shapes of the cars influenced the <strong>flow</strong><br />
above the <strong>ballast</strong>. Then, we investigated the possibility of reducti<strong>on</strong> of the <strong>flow</strong> by modificati<strong>on</strong> of<br />
<strong>under</strong>-<strong>floor</strong> shape in the wind tunnel tests.<br />
(1) Method<br />
The wind tunnel tests were carried out by using a closed type test secti<strong>on</strong> of the Large-scale<br />
wind tunnel of Railway Technical Research Institute. The size of the test secti<strong>on</strong> is 5m wide, 3m<br />
high and 20m l<strong>on</strong>g. The wind velocity was 50m/s in the tests. In the research of the <strong>under</strong>-<strong>floor</strong><br />
<strong>flow</strong> of the cars by using the wind tunnel, it is very important <strong>to</strong> simulate the ground effect. So,<br />
we used the moving-belt and the boundary layer sucti<strong>on</strong> device <strong>to</strong> simulate the <strong>flow</strong> between<br />
the car models and the ground. The size of the moving-belt is 2.7m wide and 6m l<strong>on</strong>g. The<br />
speed of the moving belt is the same as the wind velocity.<br />
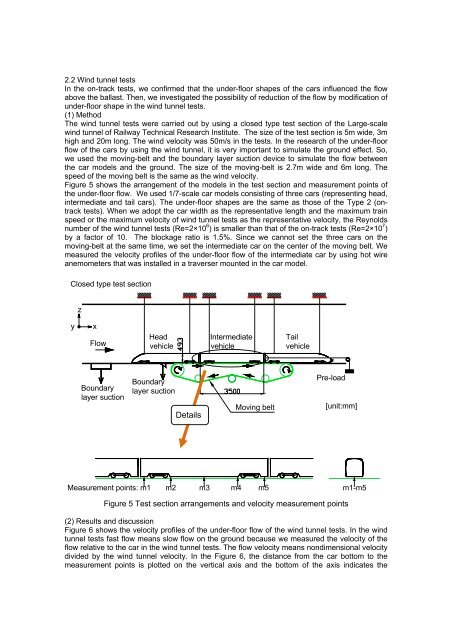
Figure 5 shows the arrangement of the models in the test secti<strong>on</strong> and measurement points of<br />
the <strong>under</strong>-<strong>floor</strong> <strong>flow</strong>. We used 1/7-scale car models c<strong>on</strong>sisting of three cars (representing head,<br />
intermediate and tail cars). The <strong>under</strong>-<strong>floor</strong> shapes are the same as those of the Type 2 (<strong>on</strong>track<br />
tests). When we adopt the car width as the representative length and the maximum train<br />
speed or the maximum velocity of wind tunnel tests as the representative velocity, the Reynolds<br />
number of the wind tunnel tests (Re=2×10 6 ) is smaller than that of the <strong>on</strong>-track tests (Re=2×10 7 )<br />
by a fac<strong>to</strong>r of 10. The blockage ratio is 1.5%. Since we cannot set the three cars <strong>on</strong> the<br />
moving-belt at the same time, we set the intermediate car <strong>on</strong> the center of the moving belt. We<br />
measured the velocity profiles of the <strong>under</strong>-<strong>floor</strong> <strong>flow</strong> of the intermediate car by using hot wire<br />
anemometers that was installed in a traverser mounted in the car model.<br />
Closed type test secti<strong>on</strong><br />
z<br />
y<br />
x<br />
Flow<br />
Head<br />
vehicle<br />
Intermediate<br />
vehicle<br />
Tail<br />
vehicle<br />
Boundary<br />
layer sucti<strong>on</strong><br />
Boundary<br />
layer sucti<strong>on</strong><br />
Details<br />
Moving belt<br />
Pre-load<br />
[unit:mm]<br />
Measurement points: m1 m2 m3 m4 m5 m1-m5<br />
Figure 5 Test secti<strong>on</strong> arrangements and velocity measurement points<br />
(2) Results and discussi<strong>on</strong><br />
Figure 6 shows the velocity profiles of the <strong>under</strong>-<strong>floor</strong> <strong>flow</strong> of the wind tunnel tests. In the wind<br />
tunnel tests fast <strong>flow</strong> means slow <strong>flow</strong> <strong>on</strong> the ground because we measured the velocity of the<br />
<strong>flow</strong> relative <strong>to</strong> the car in the wind tunnel tests. The <strong>flow</strong> velocity means n<strong>on</strong>dimensi<strong>on</strong>al velocity<br />
divided by the wind tunnel velocity. In the Figure 6, the distance from the car bot<strong>to</strong>m <strong>to</strong> the<br />
measurement points is plotted <strong>on</strong> the vertical axis and the bot<strong>to</strong>m of the axis indicates the