Study on under-floor flow to reduce ballast flying phenomena ... - UIC
Study on under-floor flow to reduce ballast flying phenomena ... - UIC
Study on under-floor flow to reduce ballast flying phenomena ... - UIC

You also want an ePaper? Increase the reach of your titles
YUMPU automatically turns print PDFs into web optimized ePapers that Google loves.
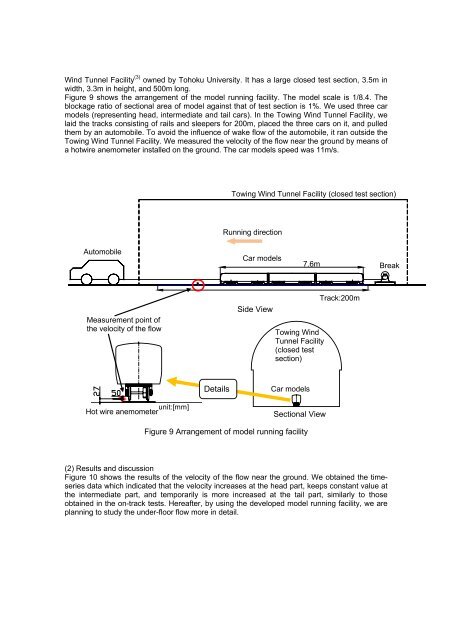
Wind Tunnel Facility (3) owned by Tohoku University. It has a large closed test secti<strong>on</strong>, 3.5m in<br />
width, 3.3m in height, and 500m l<strong>on</strong>g.<br />
Figure 9 shows the arrangement of the model running facility. The model scale is 1/8.4. The<br />
blockage ratio of secti<strong>on</strong>al area of model against that of test secti<strong>on</strong> is 1%. We used three car<br />
models (representing head, intermediate and tail cars). In the Towing Wind Tunnel Facility, we<br />
laid the tracks c<strong>on</strong>sisting of rails and sleepers for 200m, placed the three cars <strong>on</strong> it, and pulled<br />
them by an au<strong>to</strong>mobile. To avoid the influence of wake <strong>flow</strong> of the au<strong>to</strong>mobile, it ran outside the<br />
Towing Wind Tunnel Facility. We measured the velocity of the <strong>flow</strong> near the ground by means of<br />
a hotwire anemometer installed <strong>on</strong> the ground. The car models speed was 11m/s.<br />
Towing Wind Tunnel Facility (closed test secti<strong>on</strong>)<br />
Running directi<strong>on</strong><br />
Au<strong>to</strong>mobile<br />
Car models<br />
7.6m<br />
Break<br />
Measurement point of<br />
the velocity of the <strong>flow</strong><br />
Side View<br />
Towing Wind<br />
Tunnel Facility<br />
(closed test<br />
secti<strong>on</strong>)<br />
Track:200m<br />
Details<br />
Car models<br />
unit:[mm]<br />
Hot wire anemometer<br />
Secti<strong>on</strong>al View<br />
Figure 9 Arrangement of model running facility<br />
(2) Results and discussi<strong>on</strong><br />
Figure 10 shows the results of the velocity of the <strong>flow</strong> near the ground. We obtained the timeseries<br />
data which indicated that the velocity increases at the head part, keeps c<strong>on</strong>stant value at<br />
the intermediate part, and temporarily is more increased at the tail part, similarly <strong>to</strong> those<br />
obtained in the <strong>on</strong>-track tests. Hereafter, by using the developed model running facility, we are<br />
planning <strong>to</strong> study the <strong>under</strong>-<strong>floor</strong> <strong>flow</strong> more in detail.