103 - Paul Barrett
103 - Paul Barrett
103 - Paul Barrett

Create successful ePaper yourself
Turn your PDF publications into a flip-book with our unique Google optimized e-Paper software.
482 B.P. Chapman et al. / Personality and Individual Differences 54 (2013) 479–484<br />
Neuroticism 10.5 ; 2, 4, 7, 9, 11, 13, 16, 19, 21, 23, 26, 28, 31, 33, 35, 38, 40, 43, 45, 47, 50, 52, 55, 57<br />
.92 .78<br />
Emotional Reactivity 9.3 ; 2, 4, 7, 9, 11, 13, 16, 19, 21, 23, 26, 28, 38,<br />
40, 47, 50, 52<br />
.90 .83<br />
.48<br />
Global Anxiety 8.1; 26, 31, 33, 35, 43, 45, 47, 55, 57<br />
.99<br />
Oversensitivity 8.0; 11, 14, 16,<br />
23, 26, 47, 50, 52<br />
.97<br />
.52<br />
Mood Lability 7.7; 2, 4, 7, 9, 19,<br />
23, 38<br />
.45<br />
.96<br />
Global Anxiety 8.1; 26, 31, 33, 35, 43, 45, 47, 55, 57<br />
.80 .88<br />
Oversensitivity: 7.7 ; 11, 14,<br />
16, 23, 40, 50, 52<br />
Mood Lability: 7.5; 2, 4, 7, Nervous Tension: 7.3;<br />
.71 .44 .52<br />
9, 19, 38<br />
26, 35, 47<br />
Rumination: 2.7; 31, 33, 43, 45,<br />
55, 57<br />
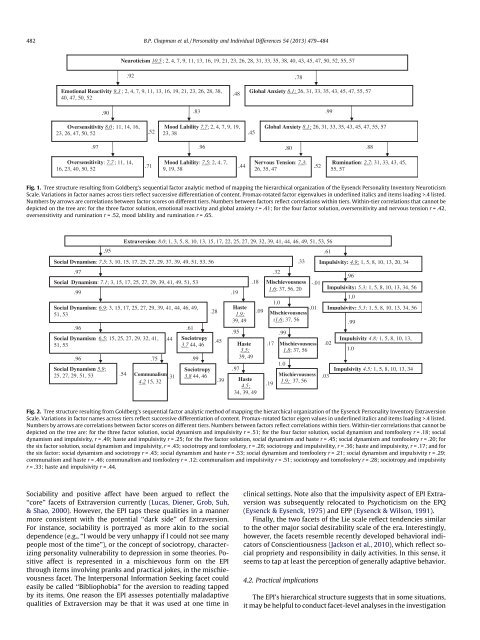
Fig. 1. Tree structure resulting from Goldberg’s sequential factor analytic method of mapping the hierarchical organization of the Eysenck Personality Inventory Neuroticism<br />
Scale. Variations in factor names across tiers reflect successive differentiation of content. Promax-rotated factor eigenvalues in underlined italics and items loading >.4 listed.<br />
Numbers by arrows are correlations between factor scores on different tiers. Numbers between factors reflect correlations within tiers. Within-tier correlations that cannot be<br />
depicted on the tree are: for the three factor solution, emotional reactivity and global anxiety r = .41; for the four factor solution, oversensitivity and nervous tension r = .42,<br />
oversensitivity and rumination r = .52, mood lability and rumination r = .65.<br />
Extraversion: 8.0; 1, 3, 5, 8, 10, 13, 15, 17, 22, 25, 27, 29, 32, 39, 41, 44, 46, 49, 51, 53, 56<br />
.95 .61<br />
Social Dynamism: 7.5; 3, 10, 15, 17, 25, 27, 29, 37, 39, 49, 51, 53, 56 .33 Impulsivity: 4.9; 1, 5, 8, 10, 13, 20, 34<br />
.97 .32<br />
Social Dynamism: 7.1; 3, 15, 17, 25, 27, 29, 39, 41, 49, 51, 53<br />
.99<br />
Social Dynamism: 6.9; 3, 15, 17, 25, 27, 29, 39, 41, 44, 46, 49,<br />
51, 53<br />
.96<br />
Social Dynamism 6.5; 15, 25, 27, 29, 32, 41,<br />
51, 53<br />
.96<br />
Social Dynamism 5.9;<br />
25, 27, 29, 51, 53<br />
.54<br />
.75<br />
Communalism<br />
.31<br />
4.2 15, 32<br />
.61<br />
.44 Sociotropy<br />
.45<br />
3.7 44, 46<br />
.99<br />
Sociotropy<br />
3.8 44, 46<br />
.28<br />
Haste<br />
1.9;<br />
.09<br />
39, 49<br />
.39<br />
.95<br />
.19<br />
.95<br />
Haste<br />
3.5;<br />
39, 49<br />
.97<br />
Haste<br />
4.5;<br />
34, 39, 49<br />
.18 Mischievousness -.01<br />
1.6; 37, 56, 20<br />
1.0<br />
-.01<br />
Mischievousness<br />
:1.6; 37, 56<br />
.99<br />
.17 Mischievousness .02<br />
1.8; 37, 56<br />
.19<br />
1.0<br />
Mischievousness<br />
1.9; 37, 56<br />
.03<br />
.96<br />
Impulsivity: 5.3; 1, 5, 8, 10, 13, 34, 56<br />
1.0<br />
Impulsivity: 5.3; 1, 5, 8, 10, 13, 34, 56<br />
.99<br />
Impulsivity 4.8; 1, 5, 8, 10, 13,<br />
1.0<br />
Impulsivity 4.5; 1, 5, 8, 10, 13, 34<br />
Fig. 2. Tree structure resulting from Goldberg’s sequential factor analytic method of mapping the hierarchical organization of the Eysenck Personality Inventory Extraversion<br />
Scale. Variations in factor names across tiers reflect successive differentiation of content. Promax-rotated factor eigen values in underlined italics and items loading >.4 listed.<br />
Numbers by arrows are correlations between factor scores on different tiers. Numbers between factors reflect correlations within tiers. Within-tier correlations that cannot be<br />
depicted on the tree are: for the three factor solution, social dynamism and impulsivity r = .51; for the four factor solution, social dynamism and tomfoolery r = .18; social<br />
dynamism and impulsivity, r = .49; haste and impulsivity r = .25; for the five factor solution, social dynamism and haste r = .45; social dynamism and tomfoolery r = .20; for<br />
the six factor solution, social dynamism and impulsivity, r = .43; sociotropy and tomfoolery, r = .26; sociotropy and impulsivility, r = .36; haste and impulsivity, r = .17; and for<br />
the six factor: social dynamism and sociotropy r = .43; social dynamism and haste r = .53; social dynamism and tomfoolery r = .21; social dynamism and impulsivity r = .29;<br />
communalism and haste r = .46; communalism and tomfoolery r = .12; communalism and impulsivity r = .51; sociotropy and tomofoolery r = .28; sociotropy and impulsivity<br />
r = .33; haste and impulsivity r = .44.<br />
Sociability and positive affect have been argued to reflect the<br />
‘‘core’’ facets of Extraversion currently (Lucas, Diener, Grob, Suh,<br />
& Shao, 2000). However, the EPI taps these qualities in a manner<br />
more consistent with the potential ‘‘dark side’’ of Extraversion.<br />
For instance, sociability is portrayed as more akin to the social<br />
dependence (e.g., ‘‘I would be very unhappy if I could not see many<br />
people most of the time’’), or the concept of sociotropy, characterizing<br />
personality vulnerability to depression in some theories. Positive<br />
affect is represented in a mischievous form on the EPI<br />
through items involving pranks and practical jokes, in the mischievousness<br />
facet. The Interpersonal Information Seeking facet could<br />
easily be called ‘‘Bibliophobia’’ for the aversion to reading tapped<br />
by its items. One reason the EPI assesses potentially maladaptive<br />
qualities of Extraversion may be that it was used at one time in<br />
clinical settings. Note also that the impulsivity aspect of EPI Extraversion<br />
was subsequently relocated to Psychoticism on the EPQ<br />
(Eysenck & Eysenck, 1975) and EPP (Eysenck & Wilson, 1991).<br />
Finally, the two facets of the Lie scale reflect tendencies similar<br />
to the other major social desirability scale of the era. Interestingly,<br />
however, the facets resemble recently developed behavioral indicators<br />
of Conscientiousness (Jackson et al., 2010), which reflect social<br />
propriety and responsibility in daily activities. In this sense, it<br />
seems to tap at least the perception of generally adaptive behavior.<br />
4.2. Practical implications<br />
The EPI’s hierarchical structure suggests that in some situations,<br />
it may be helpful to conduct facet-level analyses in the investigation