103 - Paul Barrett
103 - Paul Barrett
103 - Paul Barrett

Create successful ePaper yourself
Turn your PDF publications into a flip-book with our unique Google optimized e-Paper software.
B.P. Chapman et al. / Personality and Individual Differences 54 (2013) 479–484 483<br />
Table 1<br />
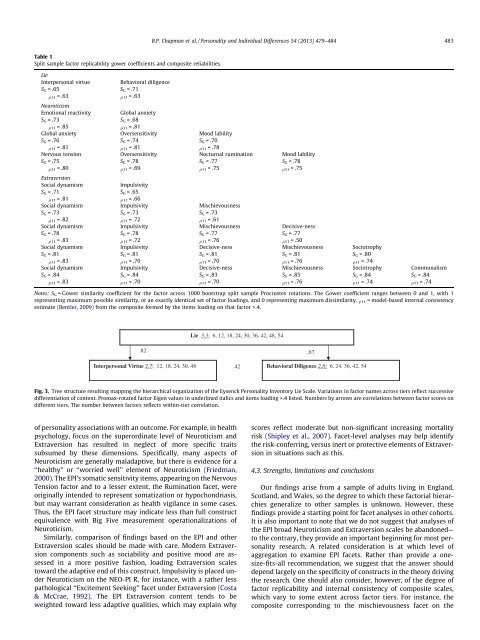
Split sample factor replicability gower coefficients and composite reliabilities.<br />
Lie<br />
Interpersonal virtue<br />
Behavioral diligence<br />
S G = .65<br />
q11 = .63<br />
S G = .71<br />
q11 = .63<br />
Neuroticism<br />
Emotional reactivity<br />
Global anxiety<br />
S G = .73<br />
q11 = .85<br />
S G = .68<br />
q11 = .81<br />
Global anxiety Oversensitivity Mood lability<br />
S G = .76<br />
q11 = .81<br />
S G = .74<br />
q11 = .81<br />
S G = .70<br />
q11 = .78<br />
Nervous tension Oversensitivity Nocturnal rumination Mood lability<br />
S G = .75<br />
q11 = .80<br />
S G = .78<br />
q11 = .69<br />
S G = .77<br />
q11 = .75<br />
S G = .78<br />
q11 = .75<br />
Extraversion<br />
Social dynamism<br />
Impulsivity<br />
S G = .71<br />
q11 = .81<br />
S G = .65<br />
q11 = .66<br />
Social dynamism Impulsivity Mischievousness<br />
S G = .73<br />
q11 = .82<br />
S G = .73<br />
q11 = .72<br />
S G = .73<br />
q11 = .61<br />
Social dynamism Impulsivity Mischievousness Decisive-ness<br />
S G = .78<br />
q11 = .83<br />
S G = .78<br />
q11 = .72<br />
S G = .77<br />
q11 = .76<br />
S G = .77<br />
q11 = .50<br />
Social dynamism Impulsivity Decisive-ness Mischievousness Sociotrophy<br />
S G = .81<br />
q11 = .83<br />
S G = .81<br />
q11 = .70<br />
S G = .81<br />
q11 = .70<br />
S G = .81<br />
q11 = .76<br />
S G = .80<br />
q11 = .74<br />
Social dynamism Impulsivity Decisive-ness Mischievousness Sociotrophy Communalism<br />
S G = .84<br />
q11 = .83<br />
S G = .84<br />
q11 = .70<br />
S G = .83<br />
q11 = .70<br />
S G = .85<br />
q11 = .76<br />
S G = .84<br />
q11 = .74<br />
S G = .84<br />
q11 = .74<br />
Notes: S G = Gower similarity coefficient for the factor across 1000 bootstrap split sample Procrustes rotations. The Gower coefficient ranges between 0 and 1, with 1<br />
representing maximum possible similarity, or an exactly identical set of factor loadings, and 0 representing maximum dissimilarity. q11 = model-based internal consistency<br />
estimate (Bentler, 2009) from the composite formed by the items loading on that factor >.4.<br />
Lie 3.3; 6, 12, 18, 24, 30, 36, 42, 48, 54<br />
.82 .87<br />
Interpersonal Virtue 2.7; 12, 18, 24, 30, 48 .42 Behavioral Diligence 2.8; 6, 24, 36, 42, 54<br />
Fig. 3. Tree structure resulting mapping the hierarchical organization of the Eysenck Personality Inventory Lie Scale. Variations in factor names across tiers reflect successive<br />
differentiation of content. Promax-rotated factor Eigen values in underlined italics and items loading >.4 listed. Numbers by arrows are correlations between factor scores on<br />
different tiers. The number between factors reflects within-tier correlation.<br />
of personality associations with an outcome. For example, in health<br />
psychology, focus on the superordinate level of Neuroticism and<br />
Extraversion has resulted in neglect of more specific traits<br />
subsumed by these dimensions. Specifically, many aspects of<br />
Neuroticism are generally maladaptive, but there is evidence for a<br />
‘‘healthy’’ or ‘‘worried well’’ element of Neuroticism (Friedman,<br />
2000). The EPI’s somatic sensitivity items, appearing on the Nervous<br />
Tension factor and to a lesser extent, the Rumination facet, were<br />
originally intended to represent somatization or hypochondriasis,<br />
but may warrant consideration as health vigilance in some cases.<br />
Thus, the EPI facet structure may indicate less than full construct<br />
equivalence with Big Five measurement operationalizations of<br />
Neuroticism.<br />
Similarly, comparison of findings based on the EPI and other<br />
Extraversion scales should be made with care. Modern Extraversion<br />
components such as sociability and positive mood are assessed<br />
in a more positive fashion, loading Extraversion scales<br />
toward the adaptive end of this construct. Impulsivity is placed under<br />
Neuroticism on the NEO-PI R, for instance, with a rather less<br />
pathological ‘‘Excitement Seeking’’ facet under Extraversion (Costa<br />
& McCrae, 1992). The EPI Extraversion content tends to be<br />
weighted toward less adaptive qualities, which may explain why<br />
scores reflect moderate but non-significant increasing mortality<br />
risk (Shipley et al., 2007). Facet-level analyses may help identify<br />
the risk-conferring, versus inert or protective elements of Extraversion<br />
in situations such as this.<br />
4.3. Strengths, limitations and conclusions<br />
Our findings arise from a sample of adults living in England,<br />
Scotland, and Wales, so the degree to which these factorial hierarchies<br />
generalize to other samples is unknown. However, these<br />
findings provide a starting point for facet analyses in other cohorts.<br />
It is also important to note that we do not suggest that analyses of<br />
the EPI broad Neuroticism and Extraversion scales be abandoned—<br />
to the contrary, they provide an important beginning for most personality<br />
research. A related consideration is at which level of<br />
aggregation to examine EPI facets. Rather than provide a onesize-fits-all<br />
recommendation, we suggest that the answer should<br />
depend largely on the specificity of constructs in the theory driving<br />
the research. One should also consider, however, of the degree of<br />
factor replicability and internal consistency of composite scales,<br />
which vary to some extent across factor tiers. For instance, the<br />
composite corresponding to the mischievousness facet on the