presentation - NGI
presentation - NGI
presentation - NGI

You also want an ePaper? Increase the reach of your titles
YUMPU automatically turns print PDFs into web optimized ePapers that Google loves.
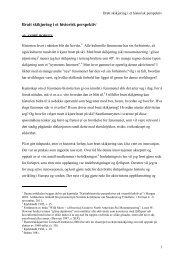
Water Depth (m)<br />
The Frontier<br />
3500<br />
3000<br />
2500<br />
2000<br />
1500<br />
1000<br />
500<br />
0<br />
1940 1950 1960 1970 1980 1990 2000 2010<br />
Year
Water Depth (m)<br />
Air Speed (km/hr)<br />
The Frontier<br />
3500<br />
3000<br />
4000<br />
3500<br />
2500<br />
3000<br />
2000<br />
1500<br />
1000<br />
500<br />
2500<br />
2000<br />
1500<br />
1000<br />
500<br />
0<br />
0<br />
1940 1950 1960 1970 1980 1990 2000 2010<br />
Year
The Frontier<br />
Image Courtesy of Jeanjean
The Frontier
The Frontier
Risk and Reliability<br />
on the Frontier<br />
of Offshore Geotechnics<br />
Bob Gilbert, The University of Texas at Austin<br />
Don Murff, Consultant<br />
Ed Clukey, BP America<br />
6
Achieving<br />
Appropriate Risk<br />
Requires Balancing<br />
Risk and<br />
Conservatism
Probability of Failure with C or More Cost in Lifetime<br />
Target Risk<br />
1.E+00<br />
1.E-01<br />
1.E-02<br />
Not Tolerable<br />
1.E-03<br />
1.E-04<br />
Tolerable<br />
1.E-05<br />
1.E-06<br />
10 100 1,000 10,000 100,000<br />
Cost, C ($1,000,000 U.S.)
Riser – Installation Load<br />
Ballast Box<br />
Driven Pile
Probability of Failure with C or More Cost in Lifetime<br />
1.E+00<br />
1.E-01<br />
Not Tolerable<br />
1.E-02<br />
1.E-03<br />
1.E-04<br />
Tolerable<br />
1.E-05<br />
1.E-06<br />
Riser Tower Foundation<br />
10 100 1,000 10,000 100,000<br />
Cost, C ($1,000,000 U.S.)
Required Weight of Ballast (% of Design Load)<br />
80%<br />
70%<br />
Proposed Design<br />
60%<br />
50%<br />
40%<br />
30%<br />
20%<br />
0.0001 Probability of Overload<br />
0.001 Probability of Overload<br />
10%<br />
0%<br />
0 20 40 60 80 100<br />
Set-Up Time (days)
Riser Bundle –<br />
Sustained Load<br />
Suction<br />
Caisson
Design Check<br />
Contractor Proposed<br />
Uplift Capacity<br />
<br />
Load Factor<br />
<br />
Resistance Factor<br />
<br />
<br />
<br />
<br />
Tension Load <br />
W caisson<br />
<br />
Versus<br />
Uplift Capacity<br />
<br />
Load Factor<br />
<br />
Resistance Factor<br />
<br />
Tension Load <br />
<br />
W caisson
Probability of Failure with C or More Cost in Lifetime<br />
1.E+00<br />
1.E-01<br />
1.E-02<br />
Not Tolerable<br />
Riser Bundle<br />
Foundation<br />
1.E-03<br />
1.E-04<br />
Tolerable<br />
1.E-05<br />
1.E-06<br />
10 100 1,000 10,000 100,000<br />
Cost, C ($1,000,000 U.S.)
Managing Risk<br />
Requires<br />
Understanding<br />
Loads as well as<br />
Capacities
Annual Probability of Exceedance<br />
10<br />
1<br />
0.1<br />
0.01<br />
0.001<br />
0.0001<br />
0.00001<br />
0.5 0.6 0.7 0.8 0.9 1<br />
Actual Load/Design Load
Gulf of Mexico – Mudslide Prone Area
Mechanism for Wave-Induced Mudslides
Mudslide scars after Hurricane Ivan<br />
3 km<br />
From Thomson et al. 2005 OTC 17738
Pipeline Failure from MP-151 after Hurricane Ivan<br />
From Coyne et al. 2005, OTC 17734
Hurricane Paths<br />
Delta
Hurricane Ivan vs. Hurricane Katrina<br />
Hurricane Ivan<br />
Hurricane Katrina
Factor of Safety<br />
Ivan vs. Katrina at MC 20<br />
1.2<br />
14 sec.<br />
Hurricane Ivan, Period = 16.1 sec.<br />
1.1<br />
Peak Spectral Period = 14 sec.<br />
Hurricane Katrina, Period = 15.2 sec.<br />
15 sec.<br />
Stable<br />
1.0<br />
17 sec.<br />
16 sec.<br />
Ivan<br />
Katrina Katrina<br />
0.9<br />
Unstable<br />
0.8<br />
15 50 15 18 60 18 21 70 21 24 80 24<br />
27 90 27<br />
30 100<br />
Maximum Maximum Wave Wave Height (ft) (m)
Main Pass Oil Gathering Pipeline Damage<br />
Hurricane Ivan<br />
MPOG<br />
Platform<br />
Leg<br />
Pipeline Damage<br />
Photos from Wicklund (2005)
Bottom Currents in Hurricane Ike
Developing<br />
Effective<br />
Geotechnical<br />
Designs Requires<br />
Understanding<br />
Their Role in the<br />
Systems They<br />
Support
Image Courtesy of<br />
Sandstrom et al.
Probability of Failure in Design Life<br />
1.0E-02<br />
1.0E-03<br />
1.0E-04<br />
1.0E-05<br />
Rope&<br />
Chains<br />
Anchor<br />
Total<br />
Rope&<br />
Chains<br />
Total<br />
Rope&<br />
Chains<br />
Total<br />
1.0E-06<br />
Anchor<br />
1.0E-07<br />
1.0E-08<br />
1,000<br />
(Semi-Taut)<br />
2,000<br />
(Taut)<br />
Anchor<br />
3,000<br />
(Taut)<br />
Water Depth (m)
Structural Systems<br />
Grout<br />
Member<br />
Doubler<br />
Repair<br />
Legend<br />
True North<br />
5 deg<br />
Platform<br />
North<br />
(+)10’ Elv.<br />
(-)20’ Elv.<br />
(-)51’ Elv.<br />
B<br />
1<br />
2<br />
3<br />
4<br />
A
Base Shear<br />
Foundation System<br />
Capacity Interaction Curve<br />
Shear<br />
Failure<br />
Unstable<br />
Combined<br />
Failure<br />
Unstable<br />
Unstable<br />
Stable<br />
Stable<br />
Stable<br />
Overturning<br />
Failure<br />
Overturning Moment
Structural System
Structural System
Structural System
Tripod Failure in Hurricane Ike<br />
Leg C<br />
Leg A<br />
Leg B
Base Shear (kips)<br />
Pile Flexibility<br />
2500<br />
2000<br />
Peak Side<br />
Shear<br />
Mobilized on<br />
All Piles<br />
1500<br />
1000<br />
Residual Side<br />
Shear Mobilized<br />
on All Piles<br />
500<br />
0<br />
Maximum<br />
Load in Ike<br />
0.0E+00 1.0E+05 2.0E+05 3.0E+05 4.0E+05 5.0E+05<br />
Overturning Moment (ft-kips)<br />
Maximum<br />
Capacity<br />
Mobilized on<br />
All Piles
Base Shear (kN)<br />
Base Shear (kN)<br />
Pile System Robustness<br />
3-Pile System Failed in<br />
Overturning<br />
6-Pile System Survived<br />
Potential Shear Failure<br />
12000<br />
*Foundation system capacity includes the effect of the conductor.<br />
30000<br />
* Foundation system capacity includes the effect of the conductors.<br />
25000<br />
8000<br />
20000<br />
15000<br />
4000<br />
Sensitivity<br />
Possible<br />
to +/-30%<br />
range of<br />
Change<br />
foundation<br />
in<br />
system<br />
Lateral<br />
capacity* due to increasing or decreasing the<br />
& Axial Soil Capacity for Single Pile<br />
axial and lateral capacity of one pile by 30 %<br />
0<br />
0.0E+00 2.0E+05 4.0E+05 6.0E+05<br />
Overturning Moment (kN-m)<br />
10000<br />
5000<br />
Possible range of foundation system<br />
Sensitivity to +/-30% Change in Lateral<br />
capacity* due to increasing or decreasing the<br />
& Axial axial Soil and lateral Capacity capacity for of one Single pile by Pile 30 %<br />
0<br />
0.0E+00 5.0E+05 1.0E+06 1.5E+06<br />
Overturning Moment (kN-m)
Maximizing Value<br />
of Information<br />
Requires<br />
Considering How It<br />
Might Affect<br />
Decisions
Value of Reliability Approach<br />
Less Data<br />
Acceptable<br />
Reliability<br />
Cost of<br />
Foundation<br />
Unacceptable<br />
Reliability<br />
Conventional<br />
More Data<br />
Cost of Investigation
Mature Field<br />
N<br />
Boring (pre 1982)<br />
Boring (post 1982)<br />
20 km<br />
Geophysics<br />
Geophysics + Boring
500<br />
1000<br />
1500<br />
2000<br />
2500<br />
3000<br />
3500<br />
4000<br />
0<br />
Expected Pile Capacity (MN)<br />
Geo-Statistical Model<br />
34<br />
Older Boring<br />
Modern Boring<br />
33<br />
32<br />
31<br />
30<br />
29<br />
Unconditional Mean<br />
28<br />
27<br />
26<br />
x Coordinate (m)<br />
1-m Diameter, 100-m Long Pile<br />
0<br />
4000<br />
3500<br />
3000<br />
2500<br />
2000<br />
1500<br />
1000<br />
500<br />
y Coordinate (m)
500<br />
1000<br />
1500<br />
2000<br />
2500<br />
3000<br />
3500<br />
4000<br />
0<br />
c.o.v. in Pile Capacity<br />
Geo-Statistical Model<br />
0.080<br />
Unconditional c.o.v.<br />
0.060<br />
0.040<br />
0.020<br />
Older Boring<br />
Modern Boring<br />
0.000<br />
x Coordinate (m)<br />
0<br />
500<br />
4000<br />
3500<br />
3000<br />
2500<br />
2000<br />
1500<br />
1000<br />
y Coordinate (m)<br />
1-m Diameter, 100-m Long Pile
Partial FS due to Spatial Variability<br />
Value of Information<br />
2.00<br />
1.75<br />
Marine Clay over<br />
Alluvial Sand and<br />
1.50<br />
Platform<br />
Site<br />
1.25<br />
Marine<br />
Alluvial Sand<br />
and Clay<br />
1.00<br />
0.00 0.05 0.10 0.15 0.20 0.25 0.30<br />
Coefficient of Variation due to Spatial Variability
Communicating Uncertainty<br />
Boring A<br />
Platform<br />
Location<br />
Boring B<br />
Normally<br />
Consolidated<br />
Marine Clay<br />
100 m<br />
Over<br />
Consolidated<br />
Clay Crusts<br />
<br />
Buried<br />
Alluvial<br />
Channels<br />
300 m<br />
200 m
Uncertainty Multiples
Tension Leg Platform
Probability Density Function<br />
Tendon Load<br />
Pile Capacity<br />
Pile Design<br />
Method B<br />
Pile Design Pile Design<br />
Method A Method C<br />
0 1 2 3 4 5 6<br />
Failure Region<br />
Force/Design Load
Design Pile Capacity
Lower-Bound Pile Capacity
Probability Mass Function (PMF)<br />
Probability Density Function (PDF)<br />
Lower Bound Capacity<br />
PDF<br />
PMF<br />
Lower<br />
Bound<br />
Design or<br />
Median<br />
Pile Capacity
Probability of Foundation Failure in Design Life<br />
1.E-02<br />
Estimated Lower Bound of Pile Capacity (% of Median)<br />
0% 10% 20% 30% 40% 50% 60%<br />
1.E-03<br />
Target<br />
1.E-04<br />
1.E-05
Probability of Foundation Failure in Design Life<br />
1.E-02<br />
Estimated Lower Bound of Pile Capacity (% of Median)<br />
0% 10% 20% 30% 40% 50% 60%<br />
1.E-03<br />
Installation<br />
Target<br />
1.E-04<br />
Re-Tap<br />
1.E-05
Summary<br />
Risks<br />
Costs
Probability of Failure with C or More Cost in Lifetime<br />
Target Risk<br />
1.E+00<br />
1.E-01<br />
1.E-02<br />
Not Tolerable<br />
1.E-03<br />
1.E-04<br />
Tolerable<br />
1.E-05<br />
1.E-06<br />
10 100 1,000 10,000 100,000<br />
Cost, C ($1,000,000 U.S.)
Offshore Oil<br />
Industry<br />
Hurricane Protection<br />
System<br />
$30 Billion Damage<br />
100% Evacuation<br />
0 Fatalities<br />
$30 Billion Damage<br />
80% Evacuation<br />
1,600 Fatalities