Track Resolution Studies with the “LiC Detector Toy ... - HEPHY
Track Resolution Studies with the “LiC Detector Toy ... - HEPHY
Track Resolution Studies with the “LiC Detector Toy ... - HEPHY

You also want an ePaper? Increase the reach of your titles
YUMPU automatically turns print PDFs into web optimized ePapers that Google loves.
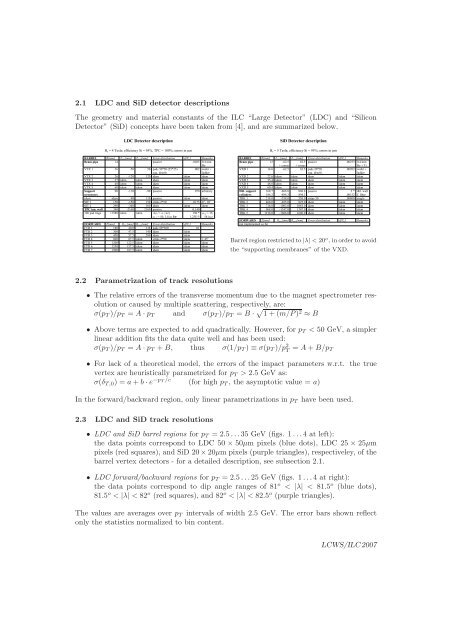
2.1 LDC and SiD detector descriptions<br />
The geometry and material constants of <strong>the</strong> ILC “Large <strong>Detector</strong>” (LDC) and “Silicon<br />
<strong>Detector</strong>” (SiD) concepts have been taken from [4], and are summarized below.<br />
LDC <strong>Detector</strong> description<br />
Bz = 4 Tesla; efficiency Si = 95%, TPC = 100%; errors in m<br />
BARREL R[mm] Zmin[mm] Zmax[mm] Error distribution d[Xo] Remarks<br />
Beam pipe 14 passive .0025 0.4 mm<br />
Be<br />
VTX 1 16 -50 50 pads 50*50 (25*25)<br />
equ. distrib.<br />
.002 wafer +<br />
ladder<br />
VTX 2 26 -120 120 idem idem idem<br />
VTX 3 37 idem idem idem idem idem<br />
VTX 4 48 idem idem idem idem idem<br />
VTX 5 60 idem idem idem idem idem<br />
Support<br />
90 -110 -90 passive .070 arbitrary<br />
structures<br />
idem idem 90 110 passive idem idem<br />
SIT 1 150 -150 150 strips 2*50 .0175 0 o , 10 o<br />
SIT 2 290 -360 360 idem idem idem<br />
TPC inn. wall 340 -2160 2160 passive 0.140<br />
196 pad rings 2.5 GeV as:<br />
σ(δ T,0 ) = a + b · e −pT /c (for high p T , <strong>the</strong> asymptotic value = a)<br />
In <strong>the</strong> forward/backward region, only linear parametrizations in p T have been used.<br />
2.3 LDC and SiD track resolutions<br />
• LDC and SiD barrel regions for p T = 2.5 . . .35 GeV (figs. 1 . . .4 at left):<br />
<strong>the</strong> data points correspond to LDC 50 × 50µm pixels (blue dots), LDC 25 × 25µm<br />
pixels (red squares), and SiD 20 × 20µm pixels (purple triangles), respectiveley, of <strong>the</strong><br />
barrel vertex detectors - for a detailed description, see subsection 2.1.<br />
• LDC forward/backward regions for p T = 2.5 . . .25 GeV (figs. 1 . . .4 at right):<br />
<strong>the</strong> data points correspond to dip angle ranges of 81 o < |λ| < 81.5 o (blue dots),<br />
81.5 o < |λ| < 82 o (red squares), and 82 o < |λ| < 82.5 o (purple triangles).<br />
The values are averages over p T intervals of width 2.5 GeV. The error bars shown reflect<br />
only <strong>the</strong> statistics normalized to bin content.<br />
LCWS/ILC2007