Barletta et al 2010.pdf - Department of Geological Sciences ...
Barletta et al 2010.pdf - Department of Geological Sciences ...
Barletta et al 2010.pdf - Department of Geological Sciences ...

You also want an ePaper? Increase the reach of your titles
YUMPU automatically turns print PDFs into web optimized ePapers that Google loves.
2320<br />
F. <strong>Barl<strong>et</strong>ta</strong> <strong>et</strong> <strong>al</strong>. / Quaternary Science Reviews 29 (2010) 2315e2324<br />
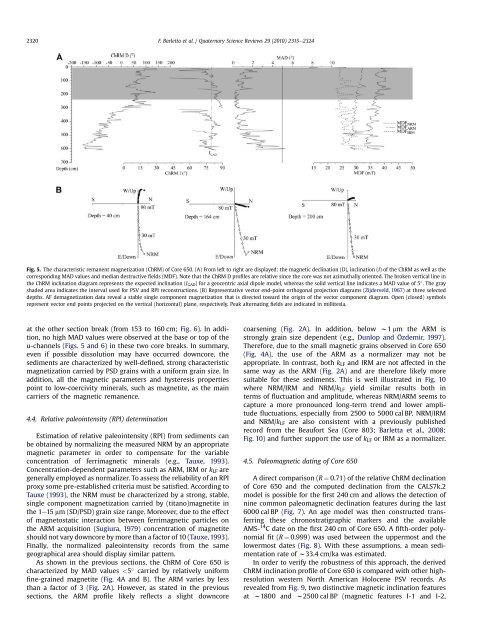
Fig. 5. The characteristic remanent magn<strong>et</strong>ization (ChRM) <strong>of</strong> Core 650. (A) From left to right are displayed: the magn<strong>et</strong>ic declination (D), inclination (I) <strong>of</strong> the ChRM as well as the<br />
corresponding MAD v<strong>al</strong>ues and median destructive fields (MDF). Note that the ChRM D pr<strong>of</strong>iles are relative since the core was not azimuth<strong>al</strong>ly oriented. The broken vertic<strong>al</strong> line in<br />
the ChRM inclination diagram represents the expected inclination (I GAD ) for a geocentric axi<strong>al</strong> dipole model, whereas the solid vertic<strong>al</strong> line indicates a MAD v<strong>al</strong>ue <strong>of</strong> 5 . The gray<br />
shaded area indicates the interv<strong>al</strong> used for PSV and RPI reconstructions. (B) Representative vector end-point orthogon<strong>al</strong> projection diagrams (Zijderveld, 1967) at three selected<br />
depths. AF demagn<strong>et</strong>ization data reve<strong>al</strong> a stable single component magn<strong>et</strong>ization that is directed toward the origin <strong>of</strong> the vector component diagram. Open (closed) symbols<br />
represent vector end points projected on the vertic<strong>al</strong> (horizont<strong>al</strong>) plane, respectively. Peak <strong>al</strong>ternating fields are indicated in millitesla.<br />
at the other section break (from 153 to 160 cm; Fig. 6). In addition,<br />
no high MAD v<strong>al</strong>ues were observed at the base or top <strong>of</strong> the<br />
u-channels (Figs. 5 and 6) in these two core breaks. In summary,<br />
even if possible dissolution may have occurred downcore, the<br />
sediments are characterized by well-defined, strong characteristic<br />
magn<strong>et</strong>ization carried by PSD grains with a uniform grain size. In<br />
addition, <strong>al</strong>l the magn<strong>et</strong>ic param<strong>et</strong>ers and hysteresis properties<br />
point to low-coercivity miner<strong>al</strong>s, such as magn<strong>et</strong>ite, as the main<br />
carriers <strong>of</strong> the magn<strong>et</strong>ic remanence.<br />
4.4. Relative p<strong>al</strong>eointensity (RPI) d<strong>et</strong>ermination<br />
Estimation <strong>of</strong> relative p<strong>al</strong>eointensity (RPI) from sediments can<br />
be obtained by norm<strong>al</strong>izing the measured NRM by an appropriate<br />
magn<strong>et</strong>ic param<strong>et</strong>er in order to compensate for the variable<br />
concentration <strong>of</strong> ferrimagn<strong>et</strong>ic miner<strong>al</strong>s (e.g., Tauxe, 1993).<br />
Concentration-dependent param<strong>et</strong>ers such as ARM, IRM or k LF are<br />
gener<strong>al</strong>ly employed as norm<strong>al</strong>izer. To assess the reliability <strong>of</strong> an RPI<br />
proxy some pre-established criteria must be satisfied. According to<br />
Tauxe (1993), the NRM must be characterized by a strong, stable,<br />
single component magn<strong>et</strong>ization carried by (titano)magn<strong>et</strong>ite in<br />
the 1e15 mm (SD/PSD) grain size range. Moreover, due to the effect<br />
<strong>of</strong> magn<strong>et</strong>ostatic interaction b<strong>et</strong>ween ferrimagn<strong>et</strong>ic particles on<br />
the ARM acquisition (Sugiura, 1979) concentration <strong>of</strong> magn<strong>et</strong>ite<br />
should not vary downcore by more than a factor <strong>of</strong> 10 (Tauxe, 1993).<br />
Fin<strong>al</strong>ly, the norm<strong>al</strong>ized p<strong>al</strong>eointensity records from the same<br />
geographic<strong>al</strong> area should display similar pattern.<br />
As shown in the previous sections, the ChRM <strong>of</strong> Core 650 is<br />
characterized by MAD v<strong>al</strong>ues