Applying Thermocouple Calibration Corrections - CAS DataLoggers
Applying Thermocouple Calibration Corrections - CAS DataLoggers
Applying Thermocouple Calibration Corrections - CAS DataLoggers

You also want an ePaper? Increase the reach of your titles
YUMPU automatically turns print PDFs into web optimized ePapers that Google loves.
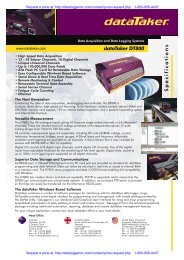
<strong>Applying</strong> <strong>Thermocouple</strong> <strong>Calibration</strong> <strong>Corrections</strong><br />
Utilizing the dataTaker DT80 Intelligent Universal Data Logger<br />
CHESTERLAND OH—November 10, 2011<br />
To improve the accuracy of thermocouples, it’s common to have them calibrated by a calibration lab. In<br />
this particular scenario, a calibration lab has already provided you with certificate which identifies<br />
calibration data at certain temperatures, and you want to apply these calibration connections. All you<br />
need are a dataTaker DT80 range data logger, the thermocouples with their calibration certificates, and<br />
a PC running Microsoft Excel.<br />
To apply these calibration corrections in the dataTaker data logger, you’ll utilize polynomials, but first<br />
you must generate the polynomial. The technique is to calculate a polynomial equation to calculate the<br />
adjustments. To calculate the polynomial factors, the results from the calibration lab are expressed as<br />
corrections at the measured temperatures. An example of this calibration data is given below:<br />
<strong>Thermocouple</strong> Test Temp Measured Temp Correction<br />
1 -50.40°C -47.30°C -3.10°C<br />
2 0.04°C -0.70°C 0.74°C<br />
3 200.85°C 202.40°C -1.55°C<br />
4 301.10°C 298.40°C 2.70°C<br />
Open Excel and enter the ‘Test’ and ‘Measured’ values into two columns. Now use the Chart Wizard in<br />
Excel to create an XY scatter graph using the data that you just entered. Add a trend line to the graph by<br />
right-clicking on one of the graph points and choosing ‘Add Trendline’, or using the Trendline Wizard in<br />
the ‘Layout’ tab in Excel 2007 and 2010. For trendline type, choose polynomial and set the order to 5. In<br />
Excel 2007 and 2010, make sure you check the ‘Show equation in chart’. In Excel 2003, click on the<br />
‘Options’ tab in the Trendline window and check the ‘Show Equation’ box.<br />
To add the polynomial to your DEX program, go to the thermocouple input in the DEX web interface and<br />
click on the ‘Scaling’ tab. Click on ‘Add’ and choose ‘Polynomial’. Enter the coefficients for each of the<br />
‘x’ variables in the K boxes. (Note: The factors are listed in reverse order in the DEX software). Now<br />
simply save the program to the datalogger and check your values to make sure that everything is in the<br />
correct range.<br />
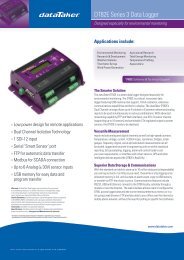
For further information on the dataTaker DT80 Intelligent Universal Data Logger, other dataloggers in<br />
the highly successful dataTaker line, or to find the ideal solution for your application-specific needs,<br />
contact a <strong>CAS</strong> Data Logger Applications Specialist at (800) 956-4437 or visit the website at<br />
www.DataLoggerInc.com.
Contact Information:<br />
<strong>CAS</strong> <strong>DataLoggers</strong>, Inc.<br />
12628 Chillicothe Road<br />
Chesterland, Ohio 44026<br />
(440) 729-2570<br />
(800) 956-4437<br />
sales@dataloggerinc.com<br />
http://www.dataloggerinc.com