View Palenik Polyurethane Foam Particles Presentation - Projects at ...
View Palenik Polyurethane Foam Particles Presentation - Projects at ...
View Palenik Polyurethane Foam Particles Presentation - Projects at ...

You also want an ePaper? Increase the reach of your titles
YUMPU automatically turns print PDFs into web optimized ePapers that Google loves.
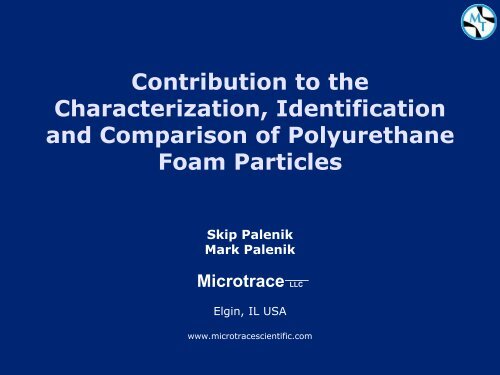
Contribution to the<br />
Characteriz<strong>at</strong>ion, Identific<strong>at</strong>ion<br />
and Comparison of <strong>Polyurethane</strong><br />
<strong>Foam</strong> <strong>Particles</strong><br />
Skip <strong>Palenik</strong><br />
Mark <strong>Palenik</strong><br />
Microtrace LLC<br />
Elgin, IL USA<br />
www.microtracescientific.com
<strong>Particles</strong> of plastic foam are occasionally<br />
encountered during the examin<strong>at</strong>ion of<br />
microscopic trace evidence
The fact th<strong>at</strong> they are usually observed as small<br />
particles (and thus easily transferable) is typically an<br />
indic<strong>at</strong>ion th<strong>at</strong> the source object has degraded
In cases where the source can be determined these<br />
particles can provide significant evidence of contact
Microscopical and microchemical methods<br />
are complimentary and have both proven of<br />
value in this type of analysis
• Stereomicroscopy<br />
Microscopy<br />
• Polarized light microscopy<br />
• Phase contrast microscopy<br />
• Color/MSP<br />
• Fluorescence/MSF<br />
• SEM-EDS / Micro-XRF
Stereomicroscopy<br />
Shape<br />
Color
Some details of internal structure can often<br />
be observed even before mounting for PLM
Testing for elastomerism
Polarized light microscopy<br />
(Mounted in 1.660)
Birefringence
Phase contrast microscopy
Microspectrophotometry
Raman microspectroscopy<br />
PB 15 Raman reference spectrum<br />
Blue foam Raman spectrum
Fluorescence microscopy and<br />
Microfluorimetry
SEM-EDS Analysis
SEM-EDS Analysis
Micro-XRF spectrum showing<br />
bromine from flame retardant
Microchemical Methods –<br />
primarily instrumental<br />
• Infrared microspectroscopy as ne<strong>at</strong><br />
particle in compression cell (if<br />
necessary)<br />
• Infrared microspectroscopy after<br />
solvent extraction<br />
• Raman microspectroscopy<br />
• GC/MS<br />
• Solvent extraction<br />
• Pyrolysis
Micro-FTIR<br />
• Identify as polyurethane or other.<br />
• Classify as polyether or polyester.<br />
• After extraction identify plasticizers<br />
(e.g. phthal<strong>at</strong>es) and obtain<br />
spectrum of the ne<strong>at</strong> polyurethane<br />
• Compare infrared spectra
Polyester type urethane - ne<strong>at</strong>
Polyester urethane after acetone wash
Acetone extract from <strong>Foam</strong> 2
Polyether type urethane foam - ne<strong>at</strong>
Polyether urethane after acetone wash
Acetone extract from foam 4
GC-MS<br />
• Inform<strong>at</strong>ion from both extraction and<br />
pyrolysis. Extraction provides<br />
especially useful d<strong>at</strong>a on lower<br />
molecular weight compounds.<br />
• Separ<strong>at</strong>ion and identific<strong>at</strong>ion of<br />
ingredients of the product (e.g.<br />
plasticizers, styrene, etc.)<br />
• Study of breakdown products, which<br />
provide especially good points of<br />
comparison.
kCounts Sample ID: Sample #1<br />
700<br />
Pyrolysis<br />
600<br />
Benzene, 2,4-diisocyan<strong>at</strong>o-1-methyl-<br />
500<br />
2H-Benzimidazol-2-one, 1,3-dihydro-5-methyl-<br />
400<br />
300<br />
Indole-2-one, 2,3-dihydro-6-amino-<br />
Benzene, 1,3-diisocyan<strong>at</strong>o-2-methyl-<br />
200<br />
100<br />
0<br />
2.5 5.0 7.5 10.0 12.5 15.0 17.5<br />
minutes
MCounts Sample ID Sample 1<br />
Acetone extract<br />
Indole-2-one, 2,3-dihydro-6-amino-<br />
1.5<br />
Benzene, 1,3-diisocyan<strong>at</strong>o-2-methyl-<br />
2H-Benzimidazol-2-one,<br />
1,3-dihydro-5-methyl-<br />
Benzene, 2,4-diisocyan<strong>at</strong>o-1-methyl-<br />
1.0<br />
1,3-Benzenediamine, 2-methyl-<br />
1,3-Benzenediamine, 4-methyl-<br />
0.5<br />
0.0<br />
2.5 5.0 7.5 10.0 12.5 15.0 17.5<br />
minutes
MCounts<br />
Isobutandiol<br />
Sample ID: Sample #2<br />
Pyrolysis<br />
3<br />
2<br />
1<br />
0<br />
2.5 5.0 7.5 10.0 12.5 15.0 17.5<br />
minutes
MCounts Sample ID Sample 2; 2 dgr-PU ac #2 ac - 8-3-2011dgr-PU ac #2 ac -1.SMS<br />
2.0<br />
Acetone extract<br />
1.5<br />
1.0<br />
0.5<br />
polyol<br />
0.0<br />
2.5 5.0 7.5 10.0 12.5 15.0 17.5<br />
minutes
MCounts<br />
styrene<br />
Sample ID: Jeep, Sample #7<br />
Pyrolysis<br />
7<br />
6<br />
5<br />
Naphthalene, 2-bromo-<br />
4<br />
3<br />
2<br />
ethylbenzene<br />
xylenes<br />
alpha-methylbenzene<br />
1<br />
toluene<br />
dimethylquinoline<br />
0<br />
2.5 5.0 7.5 10.0 12.5 15.0 17.5<br />
minutes
Summary<br />
• By means of microscopical and microchemical<br />
techniques, it is possible to analyze and identify<br />
even single small polyurethane particles.<br />
• By careful selection of techniques and their order<br />
of applic<strong>at</strong>ion, it is possible to characterize single<br />
polyuethane foam particles for purposes of<br />
comparison.<br />
• Since these particles are typically degraded to<br />
some degree, GC-MS analysis of ne<strong>at</strong> particles,<br />
their extracts or pyrolyz<strong>at</strong>es provides a<br />
convenient and reliable means of comparison<br />
based on the degree of chemical alter<strong>at</strong>ion th<strong>at</strong><br />
the Q and K samples have undergone.
Thanks and acknowledgement<br />
• Mark <strong>Palenik</strong><br />
• K<strong>at</strong>ie White<br />
• Jay Beckert<br />
• Chris <strong>Palenik</strong>