West Bengal - Data Highlights: The Scheduled Castes - Census of ...
West Bengal - Data Highlights: The Scheduled Castes - Census of ...
West Bengal - Data Highlights: The Scheduled Castes - Census of ...

Create successful ePaper yourself
Turn your PDF publications into a flip-book with our unique Google optimized e-Paper software.
<strong>West</strong> <strong>Bengal</strong><br />
DATA HIGHLIGHTS: THE SCHEDULED CASTES<br />
<strong>Census</strong> <strong>of</strong> India 2001<br />
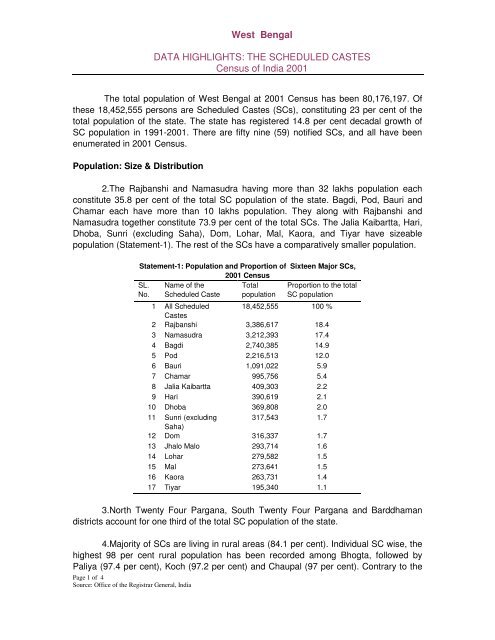
<strong>The</strong> total population <strong>of</strong> <strong>West</strong> <strong>Bengal</strong> at 2001 <strong>Census</strong> has been 80,176,197. Of<br />
these 18,452,555 persons are <strong>Scheduled</strong> <strong>Castes</strong> (SCs), constituting 23 per cent <strong>of</strong> the<br />
total population <strong>of</strong> the state. <strong>The</strong> state has registered 14.8 per cent decadal growth <strong>of</strong><br />
SC population in 1991-2001. <strong>The</strong>re are fifty nine (59) notified SCs, and all have been<br />
enumerated in 2001 <strong>Census</strong>.<br />
Population: Size & Distribution<br />
2.<strong>The</strong> Rajbanshi and Namasudra having more than 32 lakhs population each<br />
constitute 35.8 per cent <strong>of</strong> the total SC population <strong>of</strong> the state. Bagdi, Pod, Bauri and<br />
Chamar each have more than 10 lakhs population. <strong>The</strong>y along with Rajbanshi and<br />
Namasudra together constitute 73.9 per cent <strong>of</strong> the total SCs. <strong>The</strong> Jalia Kaibartta, Hari,<br />
Dhoba, Sunri (excluding Saha), Dom, Lohar, Mal, Kaora, and Tiyar have sizeable<br />
population (Statement-1). <strong>The</strong> rest <strong>of</strong> the SCs have a comparatively smaller population.<br />
Statement-1: Population and Proportion <strong>of</strong> Sixteen Major SCs,<br />
2001 <strong>Census</strong><br />
SL.<br />
No.<br />
Name <strong>of</strong> the<br />
<strong>Scheduled</strong> Caste<br />
Total<br />
population<br />
Proportion to the total<br />
SC population<br />
1 All <strong>Scheduled</strong> 18,452,555 100 %<br />
<strong>Castes</strong><br />
2 Rajbanshi 3,386,617 18.4<br />
3 Namasudra 3,212,393 17.4<br />
4 Bagdi 2,740,385 14.9<br />
5 Pod 2,216,513 12.0<br />
6 Bauri 1,091,022 5.9<br />
7 Chamar 995,756 5.4<br />
8 Jalia Kaibartta 409,303 2.2<br />
9 Hari 390,619 2.1<br />
10 Dhoba 369,808 2.0<br />
11 Sunri (excluding 317,543 1.7<br />
Saha)<br />
12 Dom 316,337 1.7<br />
13 Jhalo Malo 293,714 1.6<br />
14 Lohar 279,582 1.5<br />
15 Mal 273,641 1.5<br />
16 Kaora 263,731 1.4<br />
17 Tiyar 195,340 1.1<br />
3.North Twenty Four Pargana, South Twenty Four Pargana and Barddhaman<br />
districts account for one third <strong>of</strong> the total SC population <strong>of</strong> the state.<br />
4.Majority <strong>of</strong> SCs are living in rural areas (84.1 per cent). Individual SC wise, the<br />
highest 98 per cent rural population has been recorded among Bhogta, followed by<br />
Paliya (97.4 per cent), Koch (97.2 per cent) and Chaupal (97 per cent). Contrary to the<br />
Page 1 <strong>of</strong> 4<br />
Source: Office <strong>of</strong> the Registrar General, India
overall situation <strong>of</strong> the state, Halalkhor (90.9 per cent), Khatik (87.9 per cent), and Pasi<br />
(81 per cent) are predominantly urban by their residence.<br />
Sex Ratio<br />
5.<strong>The</strong> sex ratio <strong>of</strong> the total SC population is 949, which is higher than the national<br />
average (936) for all SCs. Of the sixteen major SCs, the sex ratio among Bagdi (978),<br />
Bauri (973), Kaora (963), Hari (963), Mal (962), Dom (959), Lohar (959), and Jalia<br />
Kaibartta (951) is above the state average for all SCs. It is lower than the state average<br />
among the remaining seven major SCs; the lowest has been among the Chamar (911).<br />
6.<strong>The</strong> child sex ratio (0-6 age group) <strong>of</strong> 958 for SCs in the state is higher than the<br />
national average for the same category (938). Jalia Kaibartta (954), Sunri (excluding<br />
Saha) (951), Tiyar (951), Hari (948), Pod (947), and Dhoba (942) have recorded lower<br />
child sex ratio as compared to the state average (958).<br />
Literacy & Educational Level<br />
7.Among all SCs, 59 per cent <strong>of</strong> the population is literate, which is higher than<br />
the aggregated national average for SCs (54.7 per cent). <strong>The</strong> gender gap in literacy<br />
among SCs is quite conspicuous with male and female literacy rates <strong>of</strong> 70.5 per cent<br />
and 46.9 per cent per cent respectively (Statement-2).<br />
8.<strong>The</strong> Sunri (excluding Saha) with 82.5 per cent literacy is on top <strong>of</strong> the list. Other<br />
SCs who have recorded literacy rate higher than the state average for SCs are Dhoba<br />
(73.9 per cent), Pod (72.1 per cent), Namasudra (71.9 per cent), Jalia Kaibartta (64.9<br />
per cent), Tiyar (62.1 per cent), and Rajbangshi (60.1 per cent). Bauri have the lowest<br />
literacy rate (37.5 per cent)<br />
SL. No.<br />
Page 2 <strong>of</strong> 4<br />
Source: Office <strong>of</strong> the Registrar General, India<br />
Statement-2: Literacy Rate among Sixteen Major SCs<br />
Name <strong>of</strong> the <strong>Scheduled</strong> Caste Literacy Rate (above 7+ years)<br />
Total Male Female<br />
1 All <strong>Scheduled</strong> <strong>Castes</strong> 59.0 70.5 46.9<br />
2 Rajbanshi 60.1 72.3 47.3<br />
3 Namasudra 71.9 80.6 62.8<br />
4 Bagdi 47.7 60.4 34.8<br />
5 Pod 72.1 83.5 59.9<br />
6 Bauri 37.5 51.8 22.7<br />
7 Chamar 47.0 58.6 34.1<br />
8 Jalia Kaibartta 64.9 74.4 54.8<br />
9 Hari 49.5 61.6 36.8<br />
10 Dhoba 73.9 83.5 63.6<br />
11 Sunri (excluding Saha) 82.5 92.7 71.4<br />
12 Dom 46.0 58.9 32.6<br />
13 Jhalo Malo 60.3 68.4 51.7<br />
14 Lohar 46.5 61.1 31.3<br />
15 Mal 39.6 51.9 26.8<br />
16 Kaora 53.0 64.9 40.6<br />
17 Tiyar 62.1 73.5 50.1
09. <strong>The</strong> gender gap in literacy has been noted among the major SCs,. It is high<br />
(29 percentage points) among Lohar and Bauri, and it is comparatively small (16<br />
percentage points) among Namasudra and Jhalo Malo.<br />
10.A total <strong>of</strong> 63.3 per cent <strong>of</strong> SCs in age group 5-14 years has been attending<br />
any educational institutions. Of the sixteen major SCs, Sunri (excluding Saha) is on top<br />
having 79.9 per cent population attending any educational institutions, whereas Bauri is<br />
at the bottom with merely 45.1 per cent.<br />
11.As regards the level <strong>of</strong> education, 11.6 per cent <strong>of</strong> total SCs in <strong>West</strong> <strong>Bengal</strong><br />
are having educational level above matriculation. <strong>The</strong> Sunri (excluding Saha) with 29.3<br />
per cent is well ahead <strong>of</strong> other SCs. On the other hand Bauri (4.7 per cent) and Bagdi<br />
(4.9 per cent) have recorded below five per cent <strong>of</strong> their total literates having this level <strong>of</strong><br />
education.<br />
Work Participation Rate (WPR)<br />
12.<strong>The</strong> percentage <strong>of</strong> SC workers to total population (WPR) is 38.8 per cent,<br />
which is lower than the aggregated figure for SCs at the national level (40.4 per cent). Of<br />
the total workers, 74 per cent have been recorded as main workers and 26 per cent as<br />
marginal workers. <strong>The</strong> female WPR has been 22.3 per cent only, which is quite low<br />
when compared with male (54.4 per cent). <strong>The</strong> overwhelming workers among males are<br />
main workers (84.8 per cent), while the ratio <strong>of</strong> main and marginal workers among<br />
female is evenly poised (Statement-3).<br />
Statement-3: Distribution <strong>of</strong> Total, Main & Marginal Workers<br />
among SCs<br />
T/M/F<br />
Percentage <strong>of</strong> Workers<br />
Total<br />
Male<br />
Female<br />
Total Workers<br />
7,153,225<br />
(38.8 %)<br />
5,148,910<br />
(54.4 %)<br />
2,004,315<br />
(22.3 %)<br />
Main<br />
Workers<br />
5,291,661<br />
(74 %)<br />
4,364,870<br />
(84.8 %)<br />
926,791<br />
(46.2 %)<br />
Marginal<br />
Workers<br />
1,861,564<br />
(26 %)<br />
784,040<br />
(15.2 %)<br />
1,077,524<br />
(53.8 %)<br />
13.<strong>The</strong> Khaira has recorded the highest WPR <strong>of</strong> 50.5 per cent. On the other<br />
hand the Pasi has recorded the lowest WPR <strong>of</strong> 29.4 per cent among the major SCs.<br />
Category <strong>of</strong> Workers<br />
14.Of the total SC main workers, 31.9 per cent has been recorded as agricultural<br />
laborers and 20.3 per cent as cultivators. Almost a third <strong>of</strong> their total main workers<br />
among Paliya (38.9 per cent), Rajbanshi (35.1 per cent), Sunri (excluding Saha) (33.3<br />
per cent), and Kadar (29.7 per cent) have been returned as cultivators. On the other<br />
Page 3 <strong>of</strong> 4<br />
Source: Office <strong>of</strong> the Registrar General, India
hand Dosadh (2.6 per cent), Turi (4.8 per cent), Dom (5.7 per cent), Kaora (5.9 per cent)<br />
are the non-cultivating SCs who have recorded less than six percent <strong>of</strong> their total main<br />
workers as cultivators.<br />
Marital Status<br />
15.As regards to marital status, 48.9 per cent <strong>of</strong> the SC population is never<br />
married, 45.9 per cent currently married, 4.8 per cent widowed, and only 0.5 per cent<br />
divorced/ separated.<br />
16.Among all SCs, 2.8 per cent females below 18 years – the minimum legal age<br />
for marriage – are ever married. <strong>The</strong> Kaur (5.1 per cent), Chamar (4.4 per cent), Dom<br />
(4.2 per cent) and Mal (3.8 per cent) have recorded high percentage <strong>of</strong> ever married<br />
females below the stipulated age for marriage.<br />
17.<strong>The</strong> ever married SC males below 21 years – the minimum legal age for their<br />
marriage – constitute 1.9 per cent <strong>of</strong> the total population <strong>of</strong> that age category. <strong>The</strong> Ghasi<br />
(3.8 per cent) has recorded the highest percentage <strong>of</strong> ever married males below the<br />
stipulated age, followed by Musahar (3.2 per cent), Dom (3.1 per cent), and Chamar (3<br />
per cent).<br />
18.It is noted that Sunri (excluding Saha) has recorded the lowest percentage <strong>of</strong><br />
ever married females (1.8 per cent) as well as males (1 per cent) below the minimum<br />
legal age.<br />
Religion<br />
19.Of the total <strong>of</strong> 18,452,555 SC populations 18,445,299 are Hindus constituting<br />
99.96 per cent <strong>of</strong> the total SCs. Of the remaining population, 4,121 persons are<br />
Buddhists and are 3,135 Sikhs.<br />
-----------------------------------------<br />
Page 4 <strong>of</strong> 4<br />
Source: Office <strong>of</strong> the Registrar General, India