IDENTIFICATION OF AIRBORNE FUNGI FROM ... - ISAH-SOC
IDENTIFICATION OF AIRBORNE FUNGI FROM ... - ISAH-SOC
IDENTIFICATION OF AIRBORNE FUNGI FROM ... - ISAH-SOC

You also want an ePaper? Increase the reach of your titles
YUMPU automatically turns print PDFs into web optimized ePapers that Google loves.
712<br />
<strong>ISAH</strong>-2007 Tartu, Estonia<br />
<strong>IDENTIFICATION</strong> <strong>OF</strong> <strong>AIRBORNE</strong> <strong>FUNGI</strong> <strong>FROM</strong> INDOOR AIR<br />
<strong>OF</strong> CHICKEN HOUSES BY RAPD-PCR<br />
Chai, T. 1 , Wang, Y.* 1.2 , Lu, G. 2 , Song, C. 3 , Sun, Y. 4 and Qi, C. 1<br />
1 College of Animal Science and Veterinary Medicine, Shandong Agricultural University,<br />
Tai’an 271018, PR. China; 2 College of Life Science, Dalian Nationalities University,<br />
Dalian 116600, China; 3 Shandong Agricultural Administration College, Jinan 250100;<br />
4 China Agricultural University, Yantai, 264670, China<br />
ABSTRACT<br />
The objectives of this study were to examine the airborne fungal concentrations, size and<br />
compositions as well as the dominant genera in chicken houses. Aerosol fungi were collected<br />
from chicken house indoor with Andersen-6 stage air sampler and cultured in RBC media.<br />
Species were identified by morphological characteristics and RAPD. The concentrations of<br />
aerosol fungi in chicken houses ranged from 1.8–3.0×10 3 CFU/m 3 air. 89 Fusarium isolates<br />
collected from the chicken houses were characterized by RAPD. Out of 30 primers, five primers<br />
reproducibly generated polymorphic patterns for fungal species of a test panel, with 74<br />
characteristic fragments. These primers were then used in RAPD assay of 91 isolates. RAPD<br />
profiles were clustered with UPGMA algorithm. This analysis helped clarify Fusarium isolates<br />
that were difficult to produce conidia for morphological identification.<br />
Keywords: chicken house; airborne fungi; RAPD; genetic distance; Fusarium<br />
INTRODUCTION<br />
[1234] .<br />
Fusarium species are common dominant mould in animal farm environment<br />
Traditionally, these species are identified by their morphological and physiological characteristics<br />
especially at vegetative stage. These methods are simple and convenient. However, a taxonomic<br />
system based on morphology is often factitious. It does not necessarily reflect evolutionary<br />
history. Morphology of the genus Fusarium is highly variable and extremely complex. In<br />
addition, it is difficult or sometimes impossible to obtain the reproductive stages. Even welltrained<br />
mycologist may not be able to diagnose one thirds of Fusarium isolates to species level [5] .<br />
Thus, Identification of Fusarium species has been considered the most difficult among fungi [6] .<br />
Application of random amplified polymorphic DNA (RAPD) technology in identification of<br />
Fusarium may be fast and accurate.<br />
In recent years, many studies have focused on fungal aerosol concentrations in hospital,<br />
residential and public environment [7, 8, 9, 10] . A literature search indicates that fungal aerosol in<br />
animal husbandry environment has not yet been considered as occupational hazard. Here we<br />
report the concentration and identification of airborne Fusarium species in poultry house with<br />
RAPD approach. This study is necessary for evaluation of occupational hazardous exposure for<br />
workers in animal husbandry environment.
<strong>ISAH</strong>-2007 Tartu, Estonia 713<br />
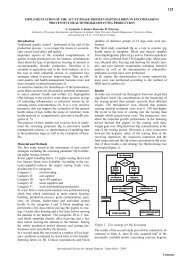
1. MATERIALS AND METHODS<br />
1.1 Sample Collection<br />
Air samples were collected between November, 2003 and December, 2005 from three chicken<br />
farms (Tai’an Manzhuang Chicken Farm, Zaozhuang Mengzhuang Township Chicken Farm and<br />
Liuling Tiekuang Chicken Farm) in Shandong Province. Collection was performed using an<br />
Anderson 6-stage air sampler [11, 24, 25] at a speed of 28.3 L/min and 50 cm above ground. Each air<br />
sample was collected in 2–4 min depending on the environment. For each farm, samples were<br />
taken three times alternated by one week. In each time three to five samples were collected.<br />
1.2 Fungal Culture and Identification<br />
Fungi were cultured with RBC media [12] in alternatively lighted incubator for 3–7 d at 25°C.<br />
Colonies were counted according to their morphology under Olympus stereoscope. Pure cultures<br />
were established and preserved. Fungal isolates were tested in SNA (saccharose nirenberg agar),<br />
PDA (potato dextrose agar) and PSA (potato sucrose agar) plates. Fusarium species were<br />
identified according to their colony characteristics and reproductive structure in reference to the<br />
systems of Booth (1971) [13] , Gerlach & Nirenberg (1982) [14] , Nelson (1983) [15] and Joffe (1986)<br />
[16] .<br />
1.3 DNA Extraction<br />
The fungal isolates were cultured at 25°C for 6–7 d in 0.5 mL liquid medium (glucose yeast<br />
medium) in 1.5 mL Eppendorf tube. Three cultures were made for each isolate. Aspergillus niger<br />
and Trichoderma viride were also cultured as controls. Genomic DNA was isolated as described<br />
[17]<br />
and DNA concentration was determined by electrophoresis in 1% agarose gel and imaged by<br />
GDS 8000 (UVP, US).<br />
1.4 RAPD-PCR<br />
1.4.1 Materials 100 bp DNA ladder, 10×PCR buffer, 10×ExTaq Buffer, dNTP (25 mmol/dm 3<br />
each), ExTaq DNA Polymerase (5U/µL) were purchased from Takara Biotechnology (Dalian)<br />
Co., Ltd. Random primers (10bp in size) were purchased from Shanghai Sangon. PCR<br />
amplification was performed with PE2400 or PE2700 thermal cycler (ABI, USA).<br />
1.4.2 RAPD Reaction Mixture The volume of each reaction was 25µl. The reaction mixture<br />
contains: (1) random primer (table 1) 0.2 µmol/dm 3 ; (2) dNTP 0.2 µmol/dm 3 ; (3) PCR buffer 2µL<br />
(10 mmol/dm 3 Tris-HCl, pH9.0, 50 mmol/dm 3 KCl, 1.5 mmol/dm 3 MgCl 2 ); (4) genomic DNA<br />
1µL (5 ng DNA); (5) Taq DNA polymerase 0.2µL (1U); and (6) highly purified water 18.8 µL.<br />
1.4.3 Thermal Cycle 1 Pre-denaturating at 94°C for 200 sec. 2 40 cycles of denaturation at<br />
94°C for 1 min, annealing at 36°C for 1 min, and extension at 72°C for 2 min. 3 Final extension<br />
at 72°C for 5 min. Reaction products were preserved at 5°C.<br />
1.4.4 RAPD Product Visualization RAPD products were mixed with loading dye (phenol blue-<br />
EDTA-glycerol). The product mixtures were separated by electrophoresis in 2% agarose gel for<br />
1–2 h at 10 V/cm. Gel images were recorded and analyzed with UVP system GDS 8000.
714<br />
<strong>ISAH</strong>-2007 Tartu, Estonia<br />
1.4.5 Screening for RAPD Primers Primers were suspended in TE buffer in a working<br />
concentration of 20 µM. They were tested against a panel of 6 Fusarium species with the<br />
condition described in section 1.4.1 through 1.4.4. The panel contains isolate No. 61<br />
(F. ventricosum), 15 (F. morniliforme), 57 (F. oxysporum), 60 (F. graminearum), 59 (F. poae)<br />
and 39 (F. equiseti). Five primers that were able to produce 4–10 bands for each of the panel<br />
species were selected for the analysis of 91 isolates. Reactions were duplicated for each isolate.<br />
1.4.6 Data Analysis The presence of a band in an isolate was represented by “1”, while the<br />
absence was represented by “0”. Distance between two samples were calculated by equation of<br />
D=1–2Nxy/Nx+Ny, where Nxy is the sum of bands in the two samples; Nx is the number of<br />
bands in sample x and Ny is the number of bands in sample y. Distance matrix was produced<br />
using unweighted pair-group method with arithmetic mean (UPGMA) algorithm and a<br />
dendrogram was generated by EPCLUST software.<br />
2. RESULTS<br />
2.1.1 Fungal Concentration Airborne fungal concentrations in closed chicken house were<br />
between 1.8~3.0×10 3 CFU/m 3 . The chicken density was 5.9~10.2 chicken/m 2 . Temperature<br />
variation was within 3°C. Humidity was 47% ~ 73%.<br />
2.1.2 Airborne Fusarium 150 isolates of airborne Fusarium were finally obtained from the three<br />
farms. Of which 89 strains were picked randomly for RAPD assay. They belong to the following<br />
species: F. moniliforme, F. moniliforme var. intermedium, F. morniliforme var. subglutinans,<br />
F. oxysporum, F. equiseti, F. solani, F. semitectum, F. graminearum, F. ventricosum, F. poae,<br />
F. avenaceum, F. nivale.<br />
2.2 Primer Screening<br />
30 primers were screened using DNA samples extracted from 6 fungal strains. Five primers (e. g.<br />
P15, P17, P19, P24 and P29) were able to produce highly polymorphic bands. The number of<br />
bands produced varied from 5 to 15. They were selected for the analysis of the 89 isolates and 2<br />
control strains.<br />
2.3 RAPD Patterns<br />
The five selected primers were used to amplify DNA from 89 isolates and 2 control strains.<br />
Reactions were performed under the same condition and with the same thermal cycler. PCR<br />
products were separated by agarose gel electrophoresis and analyzed with high resolution gel<br />
documentation equipment. PCR product sizes were obtained by comparing with the molecular<br />
weight standard. The product patterns were similar among isolates belonging to the same species<br />
while the patterns exhibit greater variation among species. Each species displayed a unique<br />
characteristic profile (Fig 1).<br />
2.4 Pattern Matrix Generation<br />
A matrix was generated according to the presence or absence of RAPD-PCR fragments in basic<br />
pairs (bp). The bands within the following molecular size (bp) are marked as presence: 1950–
<strong>ISAH</strong>-2007 Tartu, Estonia 715<br />
2250(r1), 1750–1950(r2), 1550–1750(r3), 1350–1550(r4), 1150–1350(r5), 950–1150(r6), 850–<br />
950(r7), 750–850(r8), 650–750(r9), 550–650(r10), 450–550(r11), 350–450(r12), 250–350(r13),<br />
150–250(r14), 100(r15). The presence of a band within the above range was assigned a value ‘1’,<br />
while the absence of a band was assigned a value ‘0’. 91 isolates were tested with the five<br />
primers. 73 bands were obtained. A band pattern matrix was generated (data not shown here).<br />
2.5 Genetic Distance<br />
Isolates were clustered using UPGMA to calculate genetic distance. A dendrogram was generated<br />
from the distance matrix (Fig. 2). The distances among isolates are small. When threshold<br />
distance was set at 0.62, the 91 isolates were divided into 11 groups.<br />
3. DISCUSSION<br />
3.1 Plentiful diversity of aerosol fungi was found in the three tested chicken farms. The most<br />
frequent aerosol fungi are Aspergillus, some of which are opportunistic pathogens. For example,<br />
A. fumigatus and A. terreus were recorded to infect human and animals. Animal tests have shown<br />
that some Aspergillus species (e. g. A. flavus, A. parasiticus, A. versicolor) may produce<br />
aflatoxins that induce tumor or reduce white blood cells. The other frequent fungi in the farms<br />
include Penicillium, Alternaria, Acremonium and Fusarium. Some Penicillium species may<br />
clinically infect human beings who have been affected by leukaemia or lymphoma, or infect brain<br />
or lung and produce ochratoxins. Some Alternaria species may clinically cause skin infection<br />
such as hypersensitivity, pneumonitis or asthma. Some species of Alternaria may produce<br />
mycotoxins that induce oesophageal cancer. Acremonium may cause chromomycosis or<br />
phaeohyphomycosis. They commonly infect brain or skin. It is surprisingly found that Fusarium<br />
is a very common genus in these tested chicken houses. Fusarium species are very common in<br />
agricultural environment and some well-known for producing various mycotoxins. A few<br />
Fusarium species may induce skin or cornea ulcers, even in rare case being associated with cancer<br />
[12, 18–22] . The various fungal species may show certain virulence to the animals. It is necessary to<br />
further the study of their pathogenic ability to chickens.<br />
3.2 When threshold is set at 0.62, the tested Fusarium isolates can be differentiated into species<br />
that can be identified by morphological method. However, the five RAPD primers were unable to<br />
distinguish among F. moniliforme F. moniliforme var. subglutinans and F. moniliforme var.<br />
intermedium because of their close relationship. 75% isolates of the same species were clustered<br />
into the same group. Nearly 25% isolates were not clustered to groups in which they were<br />
supposed to be. This explains the variability of Fusarium species from molecular biology point of<br />
view. Some isolates (e.g. 27 and 28) are extremely close. They might belong to the same species<br />
of different isolates. The difference in collecting sites may result in different genetic distance of<br />
the same Fusarium species, such as Dalian isolate and Tai’an isolate of F. moniliforme. Its genetic<br />
distance between airborne isolates and isolates from wheat grains is relatively far-away,<br />
suggesting that the complicated environmental factors may cause variation of Fusarium species.<br />
This result is consistent with the instability of F. moniliforme [23] .<br />
F. graminearum did not produce conidia even cultured on SNA plate, which makes<br />
identification by morphology difficult. An isolate (No. 43) which is difficult identified did not<br />
form conidia on either PDA or PSA. Its purple pigment-producing colony indicates that it is
716<br />
<strong>ISAH</strong>-2007 Tartu, Estonia<br />
Fusarium. By clustering analysis of RAPD patterns, it can be confidently assigned to F.<br />
graminearum. Using RAPD marker, some difficult isolates can be identified. It is concluded that<br />
RAPD assay could provide as an effective tool for the identification of suspected fungal isolates.<br />
ACKNOWLEDGEMENTS<br />
This study was financially supported by NSFC grant (30571381) “The spreading mode of<br />
microorganism aerosol in animal farms”<br />
REFERENCES<br />
1. [1] Wang Y L, Lu G Z, Chai T J, Shun X D,2005.Diversity and concentration of airborne fungi in<br />
chicken house. Acta Mycologica Science( Mycosystema), 24(4): 510–516<br />
2. [2] Wang Y L,2006. Detection and identification of fungal aerosol and related mycotoxins in animal<br />
raising environment. Superexcellence Doctor Dissertation of Shandong Agriculture University, 11–75<br />
3. [3] Wang Y L, Chai T J, Lu G Z, 2006.The fungal aerosol in farming environments. Journal of Domestic<br />
Animal Ecology, 26(6): 51–56 (in Chinese)<br />
4. [4] Wang Y L, Lu G Z, Chai T J, 2006.Quantificational evaluation for the potential harm of fungal<br />
aerosol in chicken house. Journal of Domestic Animal Ecology, 27(1): 66–72<br />
5. [5] O’Donnell, et al, 2004: J Clin Microbiol 42: 5109–5120<br />
6. [6] Wang G C, Zheng Z, Ye Q M, Zhang C L, 1996. Identify guide of common Fusarium.Peking<br />
Chinese Agriculture Science Press, 3–45<br />
7. [7] Gao Q Y, Chen D W, Gan M H, 1986.Comparative observation of morphologic-pathology for<br />
manual inoculability three aspergillus species in ducks. Chinese Veterinary Journal, 12(8): 5–11Hu<br />
8. [8] Q X, Xu X Z, Liu M X, et al, 1996. Research of Indoor Aerosol fungal partical in Shen-yang) Yunnan<br />
Environment Science, 15(1): 16–19<br />
9. [9] Hu Q X, Li B J, Ye B Y, et al, 1994.granularity distribution and rainfall influence of air fungi in<br />
Peking. Si-chuan Environment, 13(3): 52–55<br />
10. [10] Chen H W, 1999. Airborne microbiological survey in Jinan Tai’an and Qufu. Environment and<br />
Exploitation. 14 (4): 43–45<br />
11. [11] Andersen A. A. New sampler for collection, sizing and enumeration of viable airborne particles[J].J<br />
Bacteriol, 1958, 76: 471<br />
12. [12] Wu S X, 1998.Modern Medical Inspection Mannul. Beijing: Beijing Medical UniversityBeijing<br />
Consonancy Medical University Joint Publish, 300–326<br />
13. [13] Booth C, 1971.The Genus Fusarium[M]. CMI, Kew, England, 1–237<br />
14. [14] Gerlach W, Nirenberg H, 1982.The genus Fusarium-A pictorial atlas[M]. Mitteilungen aus der<br />
Biologischen Bundesanstalt Fuer Landund Forstwirtschaft (Berlin-Dahlem), 209: 1–405<br />
15. [15] Nelson P E, Toussoun T A, Marasas W F O, 1983. Fusarium species: An Illustrated Manual for<br />
Identification[M]. Pennsylvania State University Press, 1–193<br />
16. [16] Joffe A Z, 1986. Fusarium Species: Their Biology and Toxicology[M]. John Wiley and Sons, New<br />
York City, 1–588<br />
17. [17] Cenis J L, 1992. Rapid extraction of fungal DNA for PCR amplification[J]. Nucleic Acids Research,<br />
20: 2380<br />
18. [18] Li G Q, Cao G R,1999. Development on pathogeny and cause of avian aspergillosis [J]. Progress in<br />
Veterinary Medicine, 20(3): 12–14<br />
19. [19] Li G Q, Zhao B Y, Cao G R, 1997.Development on animal mycosis in China[J]. Progress in<br />
Veterinary Medicine, 18(3): 13–16<br />
20. [20]Carlnick B W, Gao F, Su J L(translation), 1999. Avian Disease (No.10t) [M]. Bejing: Chinese<br />
Agriculture Press, 448
<strong>ISAH</strong>-2007 Tartu, Estonia 717<br />
21. [21] Sun H L, 1987. Elementary Edition of Medicine Fungi[M]. Bejing: Chinese Science Press, 259–260<br />
22. [22] Richard J L, Cutlip R C, Thurston J R, et al. Response of turkey poults to aerosolized spores of<br />
Aspergillus fumigatus and aflatoxigenic and nonaflatoxigenic strains of Aspergillus flavus[J].Avian<br />
Dis,1981,25(5): 53–67<br />
23. [23] Zhang H, Wu J, Li J L,1995.The unstability of moniliformin production by Fusarium subglutinans.<br />
ACTA of Mycology, 14(2): 116–122, 199<br />
24. [24] Yu X H, Che F X,1998. Moden Technique of Sampling and Detection of Air-Microbes. Bejing:<br />
Military Medicine Science Press,1–10, 341–319<br />
25. [25]Che F X, Yu X H,1998.Principle and Technique Application of Sampling and Detection of Air-<br />
Microbes. Chinese Encyclopedia Press, 1,15<br />
Table 1. Oligonucleotide sequences of 30 primers for RAPD-PCR<br />
code No. Sequence code No. sequence code No. sequence<br />
P1 S23 agtcagccac P11 S22 tgccgagctg P21 S130 ggaagcttgg<br />
P2 S125 ccgaattccc P12 S24 aatcgggctg P22 S326 gtgccgttca<br />
P3 S329 caccccagtc P13 S30 gtgatcgcag P23 S324 aggctgtgct<br />
P4 S25 aggggtcttg P14 S28 gtgacgtagg P24 S129 ccaagcttcc<br />
P5 S26 ggtccctgac P15 S330 ccgacaaacc P25 S322 cctacgggga<br />
P6 S124 ggtgatcagg P16 S21 caggcccttc P26 S126 gggaattcgg<br />
P7 S27 gaaacgggtg P17 S29 gggtaacgcc P27 S328 gggtgggtaa<br />
P8 S123 cctgatcacc P18 S327 ccaggaggac P28 S325 tcccatgctg<br />
P9 S127 ccgatatccc P19 S122 gaggatccct P29 S121 acggatcctg<br />
P10 S321 tctgtgccac P20 S323 cagcaccgca P30 S128 gggatatcgg
718<br />
<strong>ISAH</strong>-2007 Tartu, Estonia
<strong>ISAH</strong>-2007 Tartu, Estonia 719
720<br />
<strong>ISAH</strong>-2007 Tartu, Estonia<br />
Figure 1. RAPD profiles for 91 strains using 5 optimized RAPD primers
<strong>ISAH</strong>-2007 Tartu, Estonia 721<br />
Figure 2. Dendrogram for 91 Fusarium strains based on RAPD pattern