Acta Materialia, 58(17) - Laboratoire d'Etude des Microstructures
Acta Materialia, 58(17) - Laboratoire d'Etude des Microstructures
Acta Materialia, 58(17) - Laboratoire d'Etude des Microstructures

Create successful ePaper yourself
Turn your PDF publications into a flip-book with our unique Google optimized e-Paper software.
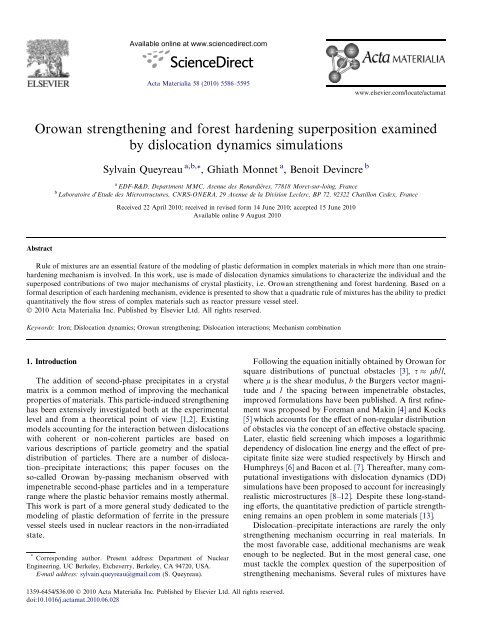
Available online at www.sciencedirect.com<br />
<strong>Acta</strong> <strong>Materialia</strong> <strong>58</strong> (2010) 5<strong>58</strong>6–5595<br />
www.elsevier.com/locate/actamat<br />
Orowan strengthening and forest hardening superposition examined<br />
by dislocation dynamics simulations<br />
Sylvain Queyreau a,b, *, Ghiath Monnet a , Benoit Devincre b<br />
a EDF-R&D, Department MMC, Avenue <strong>des</strong> Renardières, 77818 Moret-sur-loing, France<br />
b <strong>Laboratoire</strong> d’Etude <strong>des</strong> <strong>Microstructures</strong>, CNRS-ONERA, 29 Avenue de la Division Leclerc, BP 72, 92322 Chatillon Cedex, France<br />
Received 22 April 2010; received in revised form 14 June 2010; accepted 15 June 2010<br />
Available online 9 August 2010<br />
Abstract<br />
Rule of mixtures are an essential feature of the modeling of plastic deformation in complex materials in which more than one strainhardening<br />
mechanism is involved. In this work, use is made of dislocation dynamics simulations to characterize the individual and the<br />
superposed contributions of two major mechanisms of crystal plasticity, i.e. Orowan strengthening and forest hardening. Based on a<br />
formal <strong>des</strong>cription of each hardening mechanism, evidence is presented to show that a quadratic rule of mixtures has the ability to predict<br />
quantitatively the flow stress of complex materials such as reactor pressure vessel steel.<br />
Ó 2010 <strong>Acta</strong> <strong>Materialia</strong> Inc. Published by Elsevier Ltd. All rights reserved.<br />
Keywords: Iron; Dislocation dynamics; Orowan strengthening; Dislocation interactions; Mechanism combination<br />
1. Introduction<br />
The addition of second-phase precipitates in a crystal<br />
matrix is a common method of improving the mechanical<br />
properties of materials. This particle-induced strengthening<br />
has been extensively investigated both at the experimental<br />
level and from a theoretical point of view [1,2]. Existing<br />
models accounting for the interaction between dislocations<br />
with coherent or non-coherent particles are based on<br />
various <strong>des</strong>criptions of particle geometry and the spatial<br />
distribution of particles. There are a number of dislocation–precipitate<br />
interactions; this paper focuses on the<br />
so-called Orowan by-passing mechanism observed with<br />
impenetrable second-phase particles and in a temperature<br />
range where the plastic behavior remains mostly athermal.<br />
This work is part of a more general study dedicated to the<br />
modeling of plastic deformation of ferrite in the pressure<br />
vessel steels used in nuclear reactors in the non-irradiated<br />
state.<br />
* Corresponding author. Present address: Department of Nuclear<br />
Engineering, UC Berkeley, Etcheverry, Berkeley, CA 94720, USA.<br />
E-mail address: sylvain.queyreau@gmail.com (S. Queyreau).<br />
Following the equation initially obtained by Orowan for<br />
square distributions of punctual obstacles [3], s lb/l,<br />
where l is the shear modulus, b the Burgers vector magnitude<br />
and l the spacing between impenetrable obstacles,<br />
improved formulations have been published. A first refinement<br />
was proposed by Foreman and Makin [4] and Kocks<br />
[5] which accounts for the effect of non-regular distribution<br />
of obstacles via the concept of an effective obstacle spacing.<br />
Later, elastic field screening which imposes a logarithmic<br />
dependency of dislocation line energy and the effect of precipitate<br />
finite size were studied respectively by Hirsch and<br />
Humphreys [6] and Bacon et al. [7]. Thereafter, many computational<br />
investigations with dislocation dynamics (DD)<br />
simulations have been proposed to account for increasingly<br />
realistic microstructures [8–12]. Despite these long-standing<br />
efforts, the quantitative prediction of particle strengthening<br />
remains an open problem in some materials [13].<br />
Dislocation–precipitate interactions are rarely the only<br />
strengthening mechanism occurring in real materials. In<br />
the most favorable case, additional mechanisms are weak<br />
enough to be neglected. But in the most general case, one<br />
must tackle the complex question of the superposition of<br />
strengthening mechanisms. Several rules of mixtures have<br />
1359-6454/$36.00 Ó 2010 <strong>Acta</strong> <strong>Materialia</strong> Inc. Published by Elsevier Ltd. All rights reserved.<br />
doi:10.1016/j.actamat.2010.06.028
S. Queyreau et al. / <strong>Acta</strong> <strong>Materialia</strong> <strong>58</strong> (2010) 5<strong>58</strong>6–5595 5<strong>58</strong>7<br />
been proposed for this purpose [1,2,14,15]. Most of these<br />
h<br />
take the form s tot ¼ P i 1=k,<br />
s k j where j is the number of<br />
strengthening mechanisms involved and the exponent k<br />
depends on the strengthening mechanisms involved. The<br />
value of k is usually between 1 and 2.<br />
Few attempts have been made to compare experimental<br />
findings with the various rules of mixtures proposed in the<br />
literature [16–19]. Such validations are difficult since they<br />
rely on a precise measure of each separate strengthening<br />
contribution. In addition, very few simulation studies have<br />
been dedicated to a theoretical validation of the existing<br />
rule of mixtures [13,20]. Monnet [13] recently considered<br />
the case of the combination of two precipitate populations<br />
and found that usual rules of mixtures failed when used<br />
with very different precipitate size and density. To the<br />
authors’ knowledge, the combination of forest hardening<br />
(i.e. dislocation–dislocation interactions) and precipitation<br />
strengthening has never been numerically investigated.<br />
The aim of the present paper is therefore to tackle the<br />
problem of forest hardening in conjunction with particle<br />
strengthening. This study uses 3-D DD simulations. The<br />
simulated microstructure aims at replicating reactor pressure<br />
vessel (RPV) steels as closely as possible [21,22]. Plasticity<br />
in this material is a function of various strengthening<br />
contributions, i.e. solid solution, second-phase particles<br />
and large dislocation densities. Precipitates in this material<br />
are mainly non-coherent carbi<strong>des</strong> of spherical shape [23].<br />
Simulation of the solid solution contribution has been<br />
reported in a previous paper [24].<br />
In this paper, the methodology and the specifications of<br />
the DD code used in our study are briefly presented. First,<br />
Orowan strengthening is studied with the simple interaction<br />
of an infinite dislocation line interacting with a periodic<br />
row of precipitates. This mechanism is then considered in<br />
the case of more realistic 3-D microstructures. In Section 5,<br />
the combination of Orowan and forest hardening is considered.<br />
Finally, the results of a large and complex simulation<br />
are discussed in Section 6 and compared with the predictions<br />
of the law of mixtures as developed in the previous section.<br />
that relates the dislocation velocity to the effective stress<br />
on dislocation segments takes the form v = sb/B (with a<br />
viscous coefficient B = 10 4 Pa s). (iii) Alloy elements, particularly<br />
interstitials, that impede the movement of dislocations<br />
are accounted for with a friction stress s sol.sol. , acting<br />
as a threshold to dislocation motion. The value of s sol.sol.<br />
has been determined from experimental flow stress measures<br />
made in single crystals containing different amounts<br />
of carbon. Carbon is the principal interstitial. In the case<br />
of RPV steels, which have a carbon content of 100 ppm,<br />
s sol.sol. is taken as 30 MPa [24]. (iv) Use is made of isotropic<br />
elasticity, the shear modulus l equals 83.6 GPa, the Poisson<br />
coefficient m = 0.33 and the magnitude b of the Burgers<br />
vector is 2.48 10 10 m. (v) The cross-slip mechanism of<br />
screw dislocations is known to be very active in iron<br />
[27,29]. However, DD simulations which do not consider<br />
the possibility of dislocation occurring via cross-slip give<br />
much information on dislocation interactions and particle<br />
by-passing. This is why the influence of cross-slip is postponed<br />
to a forthcoming paper. Cross-slip is thus not<br />
allowed in the present study. Tests have been made to<br />
check that the results of this paper are unaffected by the latter<br />
simplification.<br />
The carbide distribution (see Fig. 1) is quite heterogeneous<br />
in the bainite of RPV steels [21], and very dense<br />
agglomerates are observed. Here, we focus on the spherical<br />
carbi<strong>des</strong> that are outside agglomerates and grain boundaries,<br />
because they represent the largest volumic fraction.<br />
Evaluations of the precipitate density have been made from<br />
Fig. 1 and other scanning electron microscopy (SEM)<br />
images [30]. They yield an average density of 3 10 19 m 3<br />
and a mean precipitate diameter of 0.1 lm. These quantities<br />
correspond approximately [2] to a surface density of 3 <br />
10 12 m 2 and a mean spacing between particles of 0.6 lm.<br />
These measures are in good agreement with previous evaluations<br />
made by transmission electron microscopy [23].<br />
2. Methodology<br />
The DD simulations are performed with the code<br />
microMegas, 1 which is not presented in detail here. Interested<br />
readers are referred to Refs. [25,26]. The specific<br />
developments made in microMegas to simulate a body-centered<br />
cubic (bcc) metal, and in particular ferrite in RPV<br />
steels, have been introduced elsewhere [24]. The main features<br />
are briefly recalled here. (i) DD simulations include<br />
only the 1/2 h1 11if110g systems that have been unambiguously<br />
identified in a-iron [27–29] and well characterized.<br />
(ii) In the athermal regime, dislocation mobility is controlled<br />
mostly by phonon drag. Hence, the mobility law<br />
1 http://zig.onera.fr/mm_home_page/.<br />
Fig. 1. Typical microstructure observed by scanning electron microscopy<br />
in the middle of the pressure vessel thickness. When the largest carbi<strong>des</strong><br />
are found in agglomerates near grain boundaries, the carbi<strong>des</strong> of interest<br />
for this study are the very numerous and smaller carbi<strong>des</strong> present inside<br />
the ferrite.
5<strong>58</strong>8 S. Queyreau et al. / <strong>Acta</strong> <strong>Materialia</strong> <strong>58</strong> (2010) 5<strong>58</strong>6–5595<br />
In the frame of this study, specific developments have<br />
been made in the microMegas code to enable complete<br />
3-D simulation of the influence of spherical carbi<strong>des</strong> precipitates.<br />
These particles correspond to regions that are<br />
perfectly impenetrable to dislocations because carbi<strong>des</strong><br />
are incoherent with the matrix. Consistently, no stress field<br />
is associated with those particles [1,12,31]. More precisely,<br />
the carbide microstructure is randomly distributed in the<br />
simulated volume and overlapping of particles is forbidden.<br />
As a wide range of simulation calculations is reported in<br />
the present work, and to avoid useless repetitions, all common<br />
features of the simulations are now <strong>des</strong>cribed. (i)<br />
First, the reference length k used to discretized the dislocation<br />
lines is adapted to the characteristic length scale K of<br />
the physical problem under investigation (or the smallest<br />
one in the case of multiple mechanisms). In the following<br />
K is, for instance, the carbide size in the case of precipitation<br />
strengthening or the mean spacing between dislocations<br />
in the case of forest hardening. In all computations<br />
k ’ K/5. (ii) Periodic boundary conditions (PBCs) are used<br />
to avoid surface effects. Hence, the simulated volume is<br />
equivalent to a small fraction of bulk material. (iii) Dimensions<br />
of the simulated volume L Vol must also be set up<br />
according to K in order to ensure statistical representativeness:<br />
L Vol P 10K. (iv) Loading is applied at constant strain<br />
rate with an amplitude function of the dislocation density.<br />
The corresponding average dislocation velocity is about<br />
1ms 1 , which is similar to experimental observations<br />
made in pure iron [32] at room temperature. Tests have<br />
shown that the simulation results remain unchanged when<br />
considering smaller strain rates.<br />
3. Orowan strengthening due to a periodic array of<br />
precipitates<br />
In a first set of simulations, configurations made of an<br />
infinite dislocation and a periodic row of particles are considered.<br />
Such calculations are made for comparison with<br />
the work by Bacon, Kocks and Scattergood (BKS) [7]<br />
and to set up important parameters such as the simulation<br />
time step. BKS defined the critical shear stress s BKS<br />
c<br />
to<br />
bypass a row as:<br />
s BKS<br />
c<br />
¼ A lb <br />
L ln D <br />
þ B<br />
r 0<br />
where A is a coefficient depending on the character of the<br />
dislocation. A = 1/2p(1 m) and A = 1/2p for screw and<br />
edge dislocations, respectively (m is Poisson’s ratio). r 0 is<br />
the line energy cut-off radius defining the elastic dislocation<br />
core size, and B is a coefficient which is equal to 0.7 and remains<br />
weak for usual values of particle density and size. In<br />
Eq. (1) BKS introduce D as (D 1 + L 1 ) 1 , a quantity<br />
which derives from the notion of harmonic average. D is<br />
useful to <strong>des</strong>cribe the two limit configurations of the Orowan<br />
strengthening problem. When L, the spacing between<br />
precipitates is low compared to D, the dislocation bows out<br />
ð1Þ<br />
between precipitates without a strong “dipolar” interaction<br />
between sections of dislocations on the opposite side of the<br />
precipitates, thus D L. Alternatively, when the precipitate<br />
diameter D is small when compared to L, the “dipolar”<br />
interactions become large and D D.<br />
As an effect of the PBCs, the location of one particle at the<br />
center of the simulated volume is enough to construct a<br />
periodic array of precipitates. Nevertheless, simulations<br />
accounting for 1, 2 and 3 aligned particles in the simulated<br />
volume were made to check that there are no artifacts associated<br />
with the use of the smallest volume of simulation. The<br />
following particle diameters were considered: 10, 31, 100,<br />
403, 500 and 1000b. For each diameter, two interparticle distances<br />
have been used: 1000 and 10,000b. The ranges of particle<br />
sizes and spacings considered here are identical to the<br />
ones used in Ref. [7] and the corresponding D/L ratios are<br />
included between 1/2 and 1/300. It can be noted that in the<br />
present study, which is looking at carbide hardening in steel,<br />
we restricted investigation to the domain D > 10b, as smaller<br />
solutions would correspond to unrealistic microstructures.<br />
Fig. 2 shows a comparison of the simulation results with<br />
prediction from Eq. (1). A very good agreement is found<br />
not only qualitatively as the dependence upon D is clearly<br />
stated, but also quantitatively as the difference between<br />
DD calculations and the BKS predictions never exceeds<br />
10%. This demonstrates the robustness of the constitutive<br />
rule we considered in the DD simulations to model the<br />
interaction between dislocation lines and carbide particles.<br />
As plastic strain continues, several Orowan dislocation<br />
loops can be stored around particles. Because of the use<br />
of PBCs with a cubic volume, each time the mobile dislocation<br />
reaches the simulation boundaries it is reintroduced in<br />
the same glide plane on the opposite side. Therefore, the<br />
same mobile dislocation can interact with the particle<br />
row many times and repeated formation of Orowan loops<br />
around the particles is simulated. Subsequently, the flow<br />
stress increases and the elastic interaction between the<br />
mobile dislocations and the stored dislocation increases.<br />
In addition, the Orowan loops accumulated in the glide<br />
Critical shear stress (µb/ L)<br />
2<br />
1.5<br />
1<br />
0.5<br />
0<br />
10 100 1000<br />
Harmonic average D (b)<br />
[BKS] screw<br />
DD screw<br />
[BKS] edge<br />
DD edge<br />
Fig. 2. Comparison of the DD results with the prediction of the BKS<br />
model for an infinite row of impenetrable particles.
S. Queyreau et al. / <strong>Acta</strong> <strong>Materialia</strong> <strong>58</strong> (2010) 5<strong>58</strong>6–5595 5<strong>58</strong>9<br />
plane reduce the interparticle distance and it becomes<br />
harder and harder for the mobile dislocation to bow-out<br />
between the particles. This phenomenon is a significant<br />
strengthening mechanism and is known as the sourceshortening<br />
effect [33,34]. In addition, the long-range stress<br />
field of the loops hugging the bypassed particles effectively<br />
decreases the applied stress, and hence contributes to strain<br />
hardening [33,34].<br />
In what follows, a second set of simulations is presented.<br />
This aims to calculate the source-shortening effect on screw<br />
or edge dislocations. For comparison with the RPV carbide<br />
microstructure, a constant mean spacing between particles<br />
of 0.6 lm and a particle diameter of 0.1 lm is considered<br />
here.<br />
The evolution of flow stress as a function of the number<br />
of Orowan loops formed around particles is given in Table<br />
1. For a periodic row of particles, a strong linear hardening<br />
is observed. As illustrated in Fig. 3 in the screw dislocation<br />
case, the critical configuration of the dislocation bow-out<br />
between particles is strongly affected by the presence of<br />
additional Orowan loops. The curvature of the dislocation<br />
increases with the increase in the loop number and thus the<br />
stress level. One may also note the elliptical shape taken by<br />
the Orowan loops in order to minimize the edge sections<br />
(except for the first Orowan loop). As first calculated by<br />
Brown [35] and in agreement with experiments [36], the<br />
shape of such dislocations held in equilibrium around smaller<br />
loops with the same sign is more circular than the one<br />
predicted by de Wit and Koehler [37] in the case of an isolated<br />
bowing loop. The main attribute observed here is that<br />
the critical shapes adopted by the dislocations by-passing<br />
particles with increasing number of Orowan loops are<br />
similar.<br />
The simulation results appear to be consistent with the<br />
concept that the accumulation of loops increases the effective<br />
radius of particles D eff (see Table 1). Hence, one can<br />
propose a simple model to calculate the flow stress evolution<br />
in the simulation. In the following developments, an<br />
initially screw dislocation geometry is considered. Equilibrium<br />
at point A, as sketched in Fig. 3d, is mainly controlled<br />
by two opposing mechanisms. The first one is the repulsive<br />
stress exerted by the pile-up of Orowan loops stored<br />
Table 1<br />
Values of the effective particle diameters, D eff , calculated from the<br />
accumulation of Orowan loops. The particle diameter is 0.1 lm. The<br />
critical resolved flow stress required to bypass the particles is in MPa and<br />
the effective diameters of the particle are in microns.<br />
n loops DD Model<br />
s c screw s c edge<br />
D eff<br />
screw s c screw D eff<br />
edge<br />
s c edge<br />
1 92.1 65 0.22 88 0.2 63<br />
2 109 75 0.26 106 0.26 75<br />
3 126 86 0.3 122 0.3 86<br />
4 143 95 0.34 139 0.34 97<br />
5 163 111 0.36 155 0.36 108<br />
6 – 126 – – 0.38 120<br />
around the particles. This contribution is roughly estimated<br />
with a form proposed by Friedel [38] in the case of<br />
a pile-up of n + 1 straight infinite dislocations: s pile-up<br />
=(n + 1)lb/(2pKr), where r is the distance between A<br />
and the particle center, K is a constant function of the dislocation<br />
character (K =1 m for a pile-up made of edges<br />
as in the present example) and n is the number of loops circumventing<br />
the particles. The pile-up is thus composed of<br />
n + 1 dislocations as the mobile dislocation is in fact the<br />
last one. The second stress contribution is the applied stress<br />
pushing the last dislocation against the Orowan loops. At<br />
the critical configuration, assuming the applied stress is<br />
correctly defined with the BKS equation (Eq. (1)), one<br />
expects:<br />
<br />
lb<br />
s c ¼ A<br />
ðL 0 D eff Þ<br />
<br />
Deff<br />
ln<br />
r 0<br />
<br />
þ B<br />
with<br />
h<br />
D eff ¼ L 0 D i eff 1 1<br />
þðD eff Þ 1<br />
ð3Þ<br />
and L 0 the center-to-center interparticle distance. During<br />
plastic deformation, the increasing applied stress makes<br />
the point A move toward the center O of the particle and<br />
reduces the distance r. The critical configuration is reached<br />
when r cannot be reduced without leading to the release of<br />
the dislocation line—in other words when js pile-up j > js BKS<br />
c<br />
j.<br />
The values predicted by Eq. (2) are compared to the results<br />
of the DD simulation in Table 1. As expected, the effective<br />
diameter increases with the number of Orowan loops. It<br />
can be noted that predicted D eff are the same for an initially<br />
edge or screw dislocation at a given number of loops.<br />
Good agreement is found between Eq. (2) and the simulated<br />
stress computation.<br />
4. Random distribution of carbi<strong>des</strong><br />
The strengthening induced by a random distribution of<br />
carbi<strong>des</strong> is now considered. With this in mind, a carbide distribution<br />
is introduced in simulations with a density of<br />
3 10 19 m 3 , as observed in ferrite of RPV steels. The spherical<br />
particles are assumed to have a constant diameter of<br />
0.1 lm. Around 300 particles are introduced in a periodic<br />
volume of 2 2 2 lm of size. The initial dislocation<br />
microstructure is composed of 20 dislocation segments of<br />
2 lm of length belonging to a single slip system 1/2<br />
½1 11Šð110Þ. This dislocation density, 10 13 m 2 , is in agreement<br />
with TEM observations in RPV steels [39]. The initial<br />
segments are randomly distributed in space and in character.<br />
When isolating the dynamics of one dislocation line in its<br />
glide plane from the 3-D simulation volume, its propagation<br />
through the carbide microstructure looks very similar to the<br />
results of previous DD simulations made in 2-D [4,8,13].<br />
Because of the heterogeneous aspect of the particle distribution,<br />
the movement of dislocations is easy in soft regions,<br />
where particles are distant from each other, whereas in<br />
hard regions, where carbi<strong>des</strong> are closer, the dislocation<br />
<br />
ð2Þ
5590 S. Queyreau et al. / <strong>Acta</strong> <strong>Materialia</strong> <strong>58</strong> (2010) 5<strong>58</strong>6–5595<br />
Fig. 3. Critical shapes of a screw dislocation interacting with a periodic row of particles respectively (a) free of loop, (b) with one Orowan loop, (c)<br />
circumvented by four Orowan loops, and (d) sketch of the quasi-static equilibrium obtained between the curved mobile dislocation and the repulsive<br />
Orowan loops stored around the particles. For the sake of clarity, a single particle is drawn.<br />
progression is difficult and island loops are sometimes<br />
formed around groups of particles. In Fig. 4, a thin foil<br />
extracted from the 3-D simulated volume emphasizes new<br />
features induced by dislocation–dislocation interactions<br />
out of their glide plane. As highlighted in Fig. 4 inset, dipoles<br />
and multipoles are formed during plastic deformation and<br />
those dipolar configurations are not randomly localized<br />
but stay preferentially between the closest particles.<br />
As in the simple case of a periodic array of precipitates,<br />
significant dislocation storage is found as a result of Orowan<br />
loop and island loop formation. This important dislocation<br />
storage justifies the large strain hardening observed<br />
in the simulation. As illustrated in Fig. 5a, plastic flow<br />
starts at a relatively high applied stress around 70 MPa,<br />
and with increasing strain the flow stress continuously<br />
increases up to 78 MPa at c = 1%. This strain hardening<br />
results from the long-range elastic field associated with<br />
Orowan loops, the source-shortening effect and the dipolar<br />
interactions. The last contribution is relatively weak at<br />
small plastic strain.<br />
In Fig. 5a, comparison is made between stress–strain<br />
curves obtained with and without carbi<strong>des</strong>. This is to<br />
differentiate the contribution of carbi<strong>des</strong> and of dipolar<br />
interactions. Without carbi<strong>des</strong>, the flow stress is as high<br />
Fig. 4. Simulated microstructure resulting from the interaction between a single slip system with a random distribution of carbi<strong>des</strong>. s = 75 MPa and<br />
c = 1%. The thin foils extracted from the simulated volume have a thickness of 0.2 lm and are parallel to the dislocation glide plane. The enlargement (A)<br />
shows the formation of dipoles and multipoles aligned along the smallest carbide spacing.
S. Queyreau et al. / <strong>Acta</strong> <strong>Materialia</strong> <strong>58</strong> (2010) 5<strong>58</strong>6–5595 5591<br />
Fig. 5. Comparison between different simulations with and without a random distribution of carbi<strong>des</strong> and two initial dislocation densities, 10 11 (thin<br />
curves) and 10 13 m 2 (thick curves). (a) Stress–plastic strain curves. (b) Dislocation density evolution as a function of the plastic strain.<br />
as 15 MPa when deducting the constant alloy friction contribution.<br />
To determine the contribution of the carbide<br />
interactions alone without any uncertainty, a second pair<br />
of simulations was performed with a lower initial dislocation<br />
density of 10 11 m 2 . The dipolar interactions in this<br />
case are negligible and no hardening is reproduced with<br />
the simulation in the absence of a carbide distribution<br />
(see Fig. 5a). Finally, the comparison between the flow<br />
stresses with and without particles leads to a particle contribution<br />
of 38 ± 1 MPa. It is worth noting the influence<br />
of the random nature of the particle distribution, which<br />
reduces the flow stresses. Indeed, for a regular distribution<br />
of carbi<strong>des</strong>, the BKS equation gives 44 and 69 MPa for<br />
screw and edge mobile dislocations, respectively.<br />
Some quantitative aspects of the simulation discussed in<br />
this section <strong>des</strong>erve further investigation. The number of<br />
particles bypassed with a mobile dislocation is simply<br />
n c = AN p , where N p is the particle density per surface area<br />
and A is the area swept by dislocations. The Orowan relation<br />
establishes the link between the shear strain c and A such that<br />
c = Ab/V and V is the simulated volume. Combining n c and c<br />
equations yields the number of particles bypassed for a given<br />
shear strain n c = cN p V/b. Numerical application at c = 1%,<br />
leads to the value of 1000 dislocation–particle interactions.<br />
This number is certainly large enough [13] to compare the<br />
results of DD simulations with the predictions of the continuous<br />
model. To assist this comparison, two additional simulations<br />
were performed with different particle densities:<br />
3 10 11 m 2 and 3 10 13 m 2 .<br />
Foreman and Makin [4] and Kocks [5] proposed very<br />
similar expressions for the flow stress s rand<br />
p<br />
¼ K lb (‘p’ stands<br />
L<br />
for particles), where K is a factor of the order of 0.8,<br />
accounting for the particle distribution heterogeneity.<br />
Hirsch and Humphreys [6] proposed an alternative formulation<br />
including a logarithmic term and accounting for the<br />
effect of self-interactions between dislocation line sections<br />
on each side of the particles:<br />
s rand<br />
p<br />
¼ 0:8 lb lnðD=bÞ<br />
ð4Þ<br />
2p L ð1 mÞ 1=2<br />
In Eq. (4), the term (1 m) 1/2 is introduced as an average<br />
of the difference in energy between screw and edge characters.<br />
The model proposed later by Bacon et al. [7] (BKS)<br />
makes use of the Friedel’s approximation for a distribution<br />
of weak obstacles. These authors assume that the by-passing<br />
of an impenetrable “strong” obstacle of finite size is<br />
equivalent to the interaction with a weaker point obstacle,<br />
due to the self-interactions on each side of the precipitates.<br />
It yields:<br />
<br />
s rand<br />
p<br />
¼ lnðD=bÞþ0:7 3=2<br />
lb lnðl=bÞ<br />
lnðL=bÞ l 2p<br />
where D is the harmonic average (cf. Section 3).<br />
The predictions of the various models are compared<br />
in Table 2. For carbide densities of 3 10 11 and 3 <br />
10 12 m 2 , the differences with the simulation results are<br />
low (
5592 S. Queyreau et al. / <strong>Acta</strong> <strong>Materialia</strong> <strong>58</strong> (2010) 5<strong>58</strong>6–5595<br />
Starting from the simulations with the largest particle<br />
density, it is possible to determine with good accuracy<br />
the dislocation storage rate associated with the formation<br />
of Orowan loops. In single slip condition and without particles,<br />
the dislocation density increases with the plastic<br />
deformation mostly as a result of dislocation multiplication.<br />
With a particle distribution, dislocation storage is<br />
much larger and comes mainly from the formation of Orowan<br />
loops. In both cases, the increase of dislocation density<br />
is linear (see Fig. 5) and a constant storage rate is found in<br />
the simulations. The storage of dislocations induced by<br />
particles is 7.2 10 15 m 2 which compares with a single<br />
slip multiplication rate of 4.2 10 15 in a crystal free of<br />
particles. It is reasonable to assume that the two storage<br />
mechanisms, i.e. the Orowan loop accumulation and the<br />
dislocation line multiplication, are not coupled. Thus,<br />
the total dislocation accumulation rate should simply be<br />
the sum of the rates for each mechanism.<br />
To examine this assumption, a simple predictive model<br />
is developed for the Orowan loops storage mechanism.<br />
We first consider a dislocation line which sweeps an area<br />
A in a volume V. During its flight, the dislocation bypasses<br />
n = N p A particles, with N p the particle density per unit<br />
area. It is assumed that Orowan loops have a circular shape<br />
with a perimeter 2pr eff , where r eff is the particle effective<br />
radius seen by the dislocations. At small strain, r eff<br />
accounts for the fact that particles are on average cut at<br />
planes different from the particle hemisphere. Simple calculations<br />
give r eff = pr/4 [2], and the increment in dislocation<br />
density Dq =2pr eff N p A/V. For the same area swept, the<br />
shear strain increment is Dc = Ab/V. Hence:<br />
Dq<br />
Dc ¼ rp2 N p<br />
2b<br />
One may note that only the size and the density of particles<br />
appear in Eq. (6) and not the dislocation density.<br />
Numerical application with a radius r = 0.05 lm and a<br />
density N p =3 10 12 m 2 leads to a dislocation storage<br />
rate of 3 10 15 m 2 in good agreement with the results<br />
found in the simulation based on the difference between<br />
the two curves of Fig. 5b.<br />
5. Orowan and forest strengthening superposition<br />
The results of more general simulations, including a combination<br />
of Orowan strengthening and forest hardening, are<br />
now presented. These simulations aim to characterize quantitatively<br />
the strain hardening imposed by the microstructure<br />
reproducing RPV steel. In this section, we take advantage of<br />
the possibilities offered by DD simulations to consider different<br />
dislocation–dislocation reactions by changing the slip<br />
systems considered in the initial dislocation density. Such<br />
simulations, in which a single primary slip system interacts<br />
with some selected forest systems have already been used<br />
to study forest hardening in pure fcc and bcc metals<br />
[24,40]. More precisely, such model simulations of latent<br />
hardening were used to determine the interaction coefficients<br />
ð6Þ<br />
a ij , which measure the mean interaction strength between<br />
two slip systems in a Taylor-like equation:<br />
qffiffiffiffiffiffiffiffiffiffiffiffiffiffiffiffiffiffiffi<br />
X<br />
s i f ¼ lb va<br />
ij<br />
q j<br />
ð7Þ<br />
where q j is the density of the systems j interacting with a<br />
system i, and v is a parameter accounting for the logarithmic<br />
deviation of coefficients a ij with dislocation density increase<br />
[24,40].<br />
The simulation protocol used in this section is similar to<br />
the one used in Ref. [24]. The initial primary dislocation<br />
density (the mobile system) is 10 13 m 2 whereas the forest<br />
density (the unloaded systems) is 2 10 13 m 2 . The forest<br />
density is made of two equivalent slip systems, i.e. having<br />
the same type of reaction with the dislocations in the primary<br />
slip system. Note that the dislocation densities we<br />
consider in the present study are much larger than what<br />
is currently used in DD simulations. However, rescaling<br />
operations to compare our results with previous computations<br />
is straightforward [40]. The simulated volume has a<br />
size of 2 lm. Forest segments are initially 5 lm long. The<br />
primary dislocation density is still composed of 20 sources<br />
of length 2 lm.<br />
For reasons of symmetry in the bcc structure, only six<br />
different types of dislocation–dislocation reactions exist<br />
between the 1/2 h1 11if110g slip systems [41]. Among<br />
such reactions, only four reactions imply non-coplanar<br />
contact reaction. They are the most important ones as they<br />
form strong forest obstacles anchoring mobile dislocations<br />
[38,42]. The first three reactions are related to the process<br />
of junction formation: (i) a junction in the mixed 54.7°<br />
direction that is called “symmetric” as the angles between<br />
the Burgers vectors of interacting dislocations with the<br />
junction direction are identical; (ii) a mixed junction that<br />
is “asymmetric”; and (iii) a junction in the edge direction.<br />
The fourth reaction is associated with the intersection of<br />
two slip systems having identical Burgers vectors but in different<br />
gliding planes. The reaction product is a null Burgers<br />
vector, and leads to the vanishing of the intersecting sections.<br />
For this reason, it is called (iv) collinear annihilation.<br />
One of the main results of previous investigations dedicated<br />
to forest strengthening in bcc structures [24,41] is certainly<br />
the hierarchy between these reactions (see Table 3).<br />
As in other structures [40,43], the collinear annihilation is<br />
by far the strongest reaction. The symmetrical mixed junction<br />
is stronger than the other two, which are of approximately<br />
the same strength.<br />
The microstructures extracted from simulations accounting<br />
simultaneously for the forest interactions and particles<br />
are shown in Fig. 6 for each type of slip system interactions.<br />
Table 3<br />
DD measures of the flow stresses (in MPa) associated with different slip<br />
system interactions using the classification based on the dislocation<br />
reaction proposed in Ref. [41].<br />
Dipolar Colli. annihil. Sym. mixed J. Asym. mixed J. Edge J.<br />
15 61 27 21 22
S. Queyreau et al. / <strong>Acta</strong> <strong>Materialia</strong> <strong>58</strong> (2010) 5<strong>58</strong>6–5595 5593<br />
On one hand, the strengthening hierarchy is preserved<br />
<strong>des</strong>pite the presence of particles. With the collinear annihilation<br />
(Fig. 6a), primary dislocations are cut into many small<br />
segments—the signature of a large number of annihilations.<br />
Much collinear debris is formed in the shape of small loops.<br />
Primary dislocations are strongly bowed-out and this contrasts<br />
with the other interactions leading to junctions, where<br />
segments are less curved (Fig. 6b and d). Among junctions,<br />
symmetrical mixed junctions are relatively more numerous<br />
and longer than the other junctions, and primary dislocations<br />
are slightly more curved.<br />
On the other hand, specific observations can be made<br />
related to the presence of carbi<strong>des</strong>. First, in all the microstructures<br />
of Fig. 6, the primary dislocations are more curved<br />
than the equivalent ones obtained without carbi<strong>des</strong> [24] as<br />
the flow stress is larger, resulting from precipitate strengthening<br />
(see Fig. 7). Hence, forest junctions are 30% smaller<br />
than in simulations without precipitates. The mean length<br />
of junctions is 0:31q 1=2<br />
f<br />
for symmetrical mixed junctions,<br />
and 0:12q 1=2<br />
f<br />
for the two other types of junctions. Indeed,<br />
the existence of carbi<strong>des</strong> limits the junction zipping process.<br />
Moreover, dynamic effects are observed in the simulations.<br />
For instance, dislocations have to form very narrow angles<br />
around the carbi<strong>des</strong> to bypass them. The release of dislocation<br />
lines, once Orowan loops are formed, generally induces<br />
a <strong>des</strong>truction of neighboring junctions, hence initiating a<br />
plastic avalanche as <strong>des</strong>cribed in Ref. [44].<br />
Simulation results obtained in this section are now compared<br />
with the flow stress predictions made with different<br />
rules of mixtures and making use of the simulated flow<br />
Fig. 7. Stress–strain curves for latent hardening simulations with (continuous<br />
line) and without a carbide microstructure (dashed line). The two<br />
types of forest reaction considered are respectively the collinear annihilation<br />
(thick lines) and the asymmetrical mixed junction (thin line).<br />
stress obtained in the previous sections for Orowan<br />
strengthening and forest hardening individually. Existing<br />
solutions of rules of mixtures can be classified with the generic<br />
form s k tot ¼ sk 1 þ sk 2<br />
. From the seminal work of Brown<br />
and Ham [1] we know that the linear solution (k = 1) gives<br />
good results in the case of few strong obstacles dispersed in<br />
many weak obstacles. For instance, this solution is well<br />
adapted to the combination of dislocation interactions with<br />
solid-solution strengthening. It was also proposed to apply<br />
this solution, with slight modification, to the strengthening<br />
associated with the plastic zone formed around underformable<br />
particles in a plastically deformed metal matrix [45].<br />
Fig. 6. Simulated microstructure obtained under loading at c = 0.25% for the different simulations of latent hardening. The thin foils have a thickness of<br />
0.06 lm and belong to the primary slip plane. Junctions correspond to thick straight segments, and carbi<strong>des</strong> are in grey. The simulations involve<br />
respectively (a) collinear annihilations, (b) symmetrical mixed junctions, (c) asymmetrical mixed junctions and (d) edge junctions.
5594 S. Queyreau et al. / <strong>Acta</strong> <strong>Materialia</strong> <strong>58</strong> (2010) 5<strong>58</strong>6–5595<br />
Table 4<br />
Comparison of the prediction of usual rule of mixtures prediction with DD simulation results when combining forest and carbide strengthening. The<br />
different forest reactions considered are dipolar interaction, collinear annihilation, mixed asymmetric junction, edge junction and mixed symmetric<br />
junction with three increasing particle densities. The flow stress values for the DD simulation are taken at c = 0.25% and are given in MPa.<br />
Rules of mixtures k =1 k = 3/2 k = 2 Monnet DD<br />
Dipol. + Carb. 53 44 40 27 40 ± 1<br />
Colli. A. + Carb. 99 80 77 70 78 ± 3<br />
Asym. J. + Carb. <strong>58</strong> 47 44 32 48 ± 2<br />
Edge J. + Carb. 60 48 45 34 48 ± 2<br />
Sym. J. + Carb. (3 10 11 m 2 ) 39 31 30 28 35 ± 3<br />
Sym. J. + Carb. (3 10 12 m 2 ) 65 52 48 38 52 ± 3<br />
Sym. J. + Carb. (3 10 13 m 2 ) 130 110 107 97 118 ± 4<br />
The quadratic form (k = 2) first proposed by Koppenaal<br />
and Kuhlmann-Wilsdorf [46] assumes that the obstacle<br />
families have very similar strength. When the obstacles<br />
have identical planar densities, this yields the form proposed<br />
by Labush [47] with k = 3/2. More recently, Monnet [13]<br />
proposed a generalized rule of mixtures, in which the<br />
strength of obstacles is balanced by their concentration. It<br />
qffiffiffiffiffiffiffiffiffiffiffiffiffiffiffiffiffi<br />
follows s ¼ðs 1 l 2 þ s 2 l 1 Þ= l 2 1 þ <br />
l2 2<br />
, where l is the average<br />
spacing between the obstacles of each obstacle family.<br />
Comparison between these different rules of mixtures and<br />
the simulation results are reported in Table 4. It should be<br />
noted that the linear rule and the solution proposed by Monnet<br />
[13] give poor evaluation of the flow stress. Conversely,<br />
the rules with k = 3/2 and k = 2 lead to rather good prediction<br />
with all tested combinations. Such agreement with all<br />
the simulations is remarkable since the specific strength of<br />
the two hardening mechanisms tested in the simulation are<br />
very different. First, the range of particle densities explored<br />
lies within two orders of magnitude. Secondly, the difference<br />
between the flow stress induced by dipolar interactions and<br />
collinear annihilations is significant, i.e. 46 MPa. The two<br />
rules of mixtures with k = 3/2 and k = 2 are numerically difficult<br />
to distinguish and one can easily check that this is<br />
because the two forms give very similar predictions for a<br />
wide range of stresses [0, 1000 MPa]. As a result, their difference<br />
never exceeds 12%. Considering that the quadratic law<br />
has already proved its reliability in the case of multiple dislocation–dislocation<br />
interactions [48], the rule of mixtures<br />
form with k = 2 is preferred in the final section of this paper.<br />
a plateau at a stress level around 100 MPa is reached. Note<br />
that the primary dislocation density at c = 1% is increased<br />
by a factor 12. However, no strain hardening can be precisely<br />
calculated from this curve because of the presence<br />
of quite large stress fluctuations. Plastic deformation proceeds<br />
by bursts and the simulated reference volume is too<br />
small to smear out plastic avalanches.<br />
Considering the results reported in previous sections, the<br />
total flow stress s in the present single slip simulation<br />
should be calculated with:<br />
qffiffiffiffiffiffiffiffiffiffiffiffiffiffi<br />
s ¼ s i ¼ s sol:sol: þ s 2 p þ s2 f<br />
ð8Þ<br />
where s i is the critical stress on the active slip system i, s p is<br />
the particle strengthening contribution calculated from Eq.<br />
(5) and s f is the forest hardening contribution calculated<br />
from Eq. (7).<br />
For the purpose of validating Eq. (8), it is worth noting<br />
that only the carbi<strong>des</strong> and the slip system densities need to<br />
be defined. As the latter quantities are explicit variables of<br />
DD simulations, one can immediately test the prediction of<br />
Eq. (8) by monitoring the slip system densities during computation,<br />
and compare these with the simulated stress–<br />
strain curves reported in Fig. 8. Clearly, the quadratic rule<br />
6. Validation of the quadratic mixture law<br />
In this final section, the robustness of the quadratic rule<br />
of mixtures is tested with the most complex computation<br />
we have used to simulate plasticity of RPV steel. A tensile<br />
test simulation is made with the loading axis at the center<br />
of the standard triangle, [1511], hence imposing a single<br />
slip condition. The initial dislocation microstructure contains<br />
the 12 1/2 h1 11if110g slip systems. The total dislocation<br />
density is initially 10 14 m 2 and the carbide size and<br />
density are respectively of 0.1 lm and 3 10 12 m 2 .<br />
The corresponding stress–strain curve is reproduced in<br />
Fig. 8. The flow stress increases up to c = 0.25 %, where<br />
Fig. 8. Comparison of the simulated flow stress with the prediction of a<br />
quadratic rule of mixtures accounting for Orowan and forest hardening.<br />
The tensile test simulated corresponds to single slip condition and<br />
accounts for carbi<strong>des</strong> and dislocations microstructures consistent with<br />
observations made in RPV steel.
S. Queyreau et al. / <strong>Acta</strong> <strong>Materialia</strong> <strong>58</strong> (2010) 5<strong>58</strong>6–5595 5595<br />
of mixtures does not apply in the first stages of the plastic<br />
deformation. In this domain, the simulated flow stress initially<br />
increases very fast since the simulated dislocation distribution<br />
is not yet a realistic 3-D interconnected network<br />
of dislocations. Indeed, a statistically well-defined dislocation<br />
microstructure (with, for instance, a stabilized average<br />
segment length between junctions) takes about c = 0.25%<br />
to form in the present simulation. From that strain, the<br />
agreement between Eq. (8) and the simulated stress–strain<br />
curve is extremely good. This clearly shows that a quadratic<br />
rule of mixtures has the capacity to account for<br />
the composition of Orowan strengthening and forest hardening<br />
in materials with a microstructure like RPV steel.<br />
7. Conclusion<br />
DD simulations have been used to investigate the combination<br />
of Orowan and forest hardening in the case of a<br />
complex material of great technological interest. Use is<br />
made of realistic dislocation and particle microstructures<br />
accounting for the 3-D details of the ferrite when deformed<br />
at room temperature. The main results of this work can be<br />
summarized as follows:<br />
– The reliability of the simulation treatment of impenetrable<br />
carbi<strong>des</strong> in the absence of forest interactions is<br />
proved via the study of simple configurations for which<br />
analytical models exist. A significant linear hardening is<br />
observed when Orowan loops are stored within a single<br />
glide plane. A simple model is proposed which correctly<br />
<strong>des</strong>cribes the hardening rate observed in that simulation.<br />
– The strengthening associated with a random distribution<br />
of carbi<strong>des</strong> is investigated and compared to existing<br />
models. A geometrical model is proposed to <strong>des</strong>cribe<br />
the dislocation storage associated with the formation<br />
of Orowan loops. Among all the models proposed for<br />
Orowan strengthening, the formulation reported by<br />
Bacon, Kocks and Scattergood [7] gives the best prediction<br />
of the simulation results. The latter equation is recognized<br />
as a reliable solution for RPV steel.<br />
– Consistent with the results of a previous study on forest<br />
hardening in a-iron [24], the realism of the Taylor-like<br />
equation proposed in Ref. [40] for fcc crystals is validated<br />
again for the very large densities of dislocations<br />
observed in RPV steel.<br />
– The combination of the Orowan strengthening and forest<br />
hardening has been studied with the help of latent hardening<br />
simulations. For this purpose, very different configurations<br />
in terms of relative densities and strengths of<br />
obstacles are considered. A quadratic rule of mixtures is<br />
shown to give a good prediction of the total strain hardening<br />
found with obstacles as different as impenetrable<br />
carbi<strong>des</strong>, non-contact dipolar interactions, dislocation<br />
contact reactions such as junction formations and collinear<br />
annihilations. Lastly, this rule of mixtures (Eq. (8)) is<br />
recognized as a reliable solution for RPV steel with a complex<br />
tensile test simulation in single slip condition, where<br />
all possible dislocation–dislocation and dislocation–<br />
particle interactions are accounted for.<br />
References<br />
[1] Brown LM, Ham RK. In: Kelly A, Nicholson RB, editors.<br />
Strengthening methods in solids. Barking: Applied Science Publishers;<br />
1971.<br />
[2] Nembach E. Particle strengthening of metals and alloys. New<br />
York: Wiley; 1996.<br />
[3] E. Orowan, Symposium on internal stresses. In: Metals and alloys.<br />
London: Institute of Metals; 1948.<br />
[4] Foreman AJE, Makin MJ. Can J Phys 1967;45:511.<br />
[5] Kocks UF. Can J Phys 1967;45:737.<br />
[6] Hirsch PB, Humphreys FJ. In: Argon AS, editor. The physics of<br />
strength and plasticity. Cambridge (MA): MIT Press; 1969.<br />
[7] Bacon DJ, Kocks UF, Scattergood RO. Philos Mag 1973;28:1241.<br />
[8] Mohles V. Mater Sci Eng 2001;A309–310:265.<br />
[9] Mohles V. Philos Mag 2001;A81:971.<br />
[10] Mohles V. Philos Mag Lett 2003;83:9.<br />
[11] Mohles V. Mater Sci Eng 2004;A365:144.<br />
[12] Shin CS, Fivel MC, Verdier M, Robertson C. Mater Sci Eng<br />
2005;A400–401:166.<br />
[13] Monnet G. Philos Mag 2006;86:5927.<br />
[14] Kocks UF, Argon AS, Ashby MF. Prog Mater Sci 1975;19:1.<br />
[15] Ardell AJ. Metall Trans 1985;16A:2131.<br />
[16] Nembach E, Martin M. <strong>Acta</strong> Metall 1980;28:1069.<br />
[<strong>17</strong>] Buttner N, Fusenig KD, Nembach E. <strong>Acta</strong> Metall 1987;35:845.<br />
[18] Nembach E, Chow CK. Mater Sci Eng 1978;36:271.<br />
[19] Reppich B, Kuhlein W, Meyer G, Puppel D, Schulz M, Schumann G.<br />
Mater Sci Eng 1986;83:45.<br />
[20] Zhu AW, Csontos A, Starke Jr EA. <strong>Acta</strong> Mater 1999;47:<strong>17</strong>13.<br />
[21] Karlik M, Nebdal I, Siegl J. Mater Sci Eng 2003;A357:423.<br />
[22] Nohava J, Hausild P, Karlik M, Bompard P. Mater Charact<br />
2003;49:211.<br />
[23] Hausild P. PhD thesis, Ecole Centrale Paris; 2002.<br />
[24] Queyreau S, Monnet G, Devincre B. Int J Plast 2009;25:361.<br />
[25] Devincre B, Kubin LP, Lemarchand C, Madec R. Mater Sci Eng A<br />
2001;309–310:211.<br />
[26] Monnet G, Devincre B, Kubin LP. <strong>Acta</strong> Mater 2004;52:43<strong>17</strong>.<br />
[27] Taoka T, Takeuchi S, Furubayashi EJ. Phys Soc Jpn 1964;19:701.<br />
[28] Keh AS. Philos Mag Ser 8 1964;12:9.<br />
[29] Franciosi P. <strong>Acta</strong> Metall 1983;31:1331.<br />
[30] Monnet G. Personal communication.<br />
[31] Shin CS, Fivel MC, Verdier M, Oh KH. Philos Mag 2003;83:369.<br />
[32] Urabe N, Weerman J. Mater Sci Eng 1975;18:41.<br />
[33] Brown LM, Stobbs WM. Philos Mag 1971;23:1185.<br />
[34] Atkinson JD, Brown LM, Stobbs WM. Philos Mag 1974;30:1247.<br />
[35] Brown LM. Philos Mag Lett 2001;81:6<strong>17</strong>.<br />
[36] Humphreys FJ, Hatherly M. In: Recrystallization and related<br />
annealing phenomena. Oxford: Pergamon Press; 2004. p. 238.<br />
[37] de Wit G, Koehler JS. Phys Rev 1959;116:1113.<br />
[38] Friedel J. In: Dislocations. Oxford: Pergamon Press; 1964.<br />
[39] Robertson CF, Obrtlik K, Marini B. J Nucl Mater 2007;366:<strong>58</strong>.<br />
[40] Devincre B, Kubin L, Hoc T. Scripta Mater 2006;54:741.<br />
[41] Madec R, Kubin L. Scripta Mater 2008;56:767.<br />
[42] Saada G. <strong>Acta</strong> Metall 1960;8:841.<br />
[43] Durinck J, Devincre B, Kubin LP, Cordier P. Am Mineral<br />
2007;92:1346.<br />
[44] Devincre B, Hoc T, Kubin LP. Science 2008;320:<strong>17</strong>45.<br />
[45] Brown LM, Stobbs WM. Philos Mag 1976;34:351.<br />
[46] Koppenaal TJ, Kuhlmann-Wilsdorf D. Appl Phys Lett 1964;<br />
4:59.<br />
[47] Labusch R. Phys Stat Solidi 1970;41:659.<br />
[48] Franciosi P, Berveiller M, Zaoui A. <strong>Acta</strong> Metall 1981;28:273.