Acta Materialia, 58(17) - Laboratoire d'Etude des Microstructures
Acta Materialia, 58(17) - Laboratoire d'Etude des Microstructures
Acta Materialia, 58(17) - Laboratoire d'Etude des Microstructures

You also want an ePaper? Increase the reach of your titles
YUMPU automatically turns print PDFs into web optimized ePapers that Google loves.
Available online at www.sciencedirect.com<br />
<strong>Acta</strong> <strong>Materialia</strong> <strong>58</strong> (2010) 5<strong>58</strong>6–5595<br />
www.elsevier.com/locate/actamat<br />
Orowan strengthening and forest hardening superposition examined<br />
by dislocation dynamics simulations<br />
Sylvain Queyreau a,b, *, Ghiath Monnet a , Benoit Devincre b<br />
a EDF-R&D, Department MMC, Avenue <strong>des</strong> Renardières, 77818 Moret-sur-loing, France<br />
b <strong>Laboratoire</strong> d’Etude <strong>des</strong> <strong>Microstructures</strong>, CNRS-ONERA, 29 Avenue de la Division Leclerc, BP 72, 92322 Chatillon Cedex, France<br />
Received 22 April 2010; received in revised form 14 June 2010; accepted 15 June 2010<br />
Available online 9 August 2010<br />
Abstract<br />
Rule of mixtures are an essential feature of the modeling of plastic deformation in complex materials in which more than one strainhardening<br />
mechanism is involved. In this work, use is made of dislocation dynamics simulations to characterize the individual and the<br />
superposed contributions of two major mechanisms of crystal plasticity, i.e. Orowan strengthening and forest hardening. Based on a<br />
formal <strong>des</strong>cription of each hardening mechanism, evidence is presented to show that a quadratic rule of mixtures has the ability to predict<br />
quantitatively the flow stress of complex materials such as reactor pressure vessel steel.<br />
Ó 2010 <strong>Acta</strong> <strong>Materialia</strong> Inc. Published by Elsevier Ltd. All rights reserved.<br />
Keywords: Iron; Dislocation dynamics; Orowan strengthening; Dislocation interactions; Mechanism combination<br />
1. Introduction<br />
The addition of second-phase precipitates in a crystal<br />
matrix is a common method of improving the mechanical<br />
properties of materials. This particle-induced strengthening<br />
has been extensively investigated both at the experimental<br />
level and from a theoretical point of view [1,2]. Existing<br />
models accounting for the interaction between dislocations<br />
with coherent or non-coherent particles are based on<br />
various <strong>des</strong>criptions of particle geometry and the spatial<br />
distribution of particles. There are a number of dislocation–precipitate<br />
interactions; this paper focuses on the<br />
so-called Orowan by-passing mechanism observed with<br />
impenetrable second-phase particles and in a temperature<br />
range where the plastic behavior remains mostly athermal.<br />
This work is part of a more general study dedicated to the<br />
modeling of plastic deformation of ferrite in the pressure<br />
vessel steels used in nuclear reactors in the non-irradiated<br />
state.<br />
* Corresponding author. Present address: Department of Nuclear<br />
Engineering, UC Berkeley, Etcheverry, Berkeley, CA 94720, USA.<br />
E-mail address: sylvain.queyreau@gmail.com (S. Queyreau).<br />
Following the equation initially obtained by Orowan for<br />
square distributions of punctual obstacles [3], s lb/l,<br />
where l is the shear modulus, b the Burgers vector magnitude<br />
and l the spacing between impenetrable obstacles,<br />
improved formulations have been published. A first refinement<br />
was proposed by Foreman and Makin [4] and Kocks<br />
[5] which accounts for the effect of non-regular distribution<br />
of obstacles via the concept of an effective obstacle spacing.<br />
Later, elastic field screening which imposes a logarithmic<br />
dependency of dislocation line energy and the effect of precipitate<br />
finite size were studied respectively by Hirsch and<br />
Humphreys [6] and Bacon et al. [7]. Thereafter, many computational<br />
investigations with dislocation dynamics (DD)<br />
simulations have been proposed to account for increasingly<br />
realistic microstructures [8–12]. Despite these long-standing<br />
efforts, the quantitative prediction of particle strengthening<br />
remains an open problem in some materials [13].<br />
Dislocation–precipitate interactions are rarely the only<br />
strengthening mechanism occurring in real materials. In<br />
the most favorable case, additional mechanisms are weak<br />
enough to be neglected. But in the most general case, one<br />
must tackle the complex question of the superposition of<br />
strengthening mechanisms. Several rules of mixtures have<br />
1359-6454/$36.00 Ó 2010 <strong>Acta</strong> <strong>Materialia</strong> Inc. Published by Elsevier Ltd. All rights reserved.<br />
doi:10.1016/j.actamat.2010.06.028
S. Queyreau et al. / <strong>Acta</strong> <strong>Materialia</strong> <strong>58</strong> (2010) 5<strong>58</strong>6–5595 5<strong>58</strong>7<br />
been proposed for this purpose [1,2,14,15]. Most of these<br />
h<br />
take the form s tot ¼ P i 1=k,<br />
s k j where j is the number of<br />
strengthening mechanisms involved and the exponent k<br />
depends on the strengthening mechanisms involved. The<br />
value of k is usually between 1 and 2.<br />
Few attempts have been made to compare experimental<br />
findings with the various rules of mixtures proposed in the<br />
literature [16–19]. Such validations are difficult since they<br />
rely on a precise measure of each separate strengthening<br />
contribution. In addition, very few simulation studies have<br />
been dedicated to a theoretical validation of the existing<br />
rule of mixtures [13,20]. Monnet [13] recently considered<br />
the case of the combination of two precipitate populations<br />
and found that usual rules of mixtures failed when used<br />
with very different precipitate size and density. To the<br />
authors’ knowledge, the combination of forest hardening<br />
(i.e. dislocation–dislocation interactions) and precipitation<br />
strengthening has never been numerically investigated.<br />
The aim of the present paper is therefore to tackle the<br />
problem of forest hardening in conjunction with particle<br />
strengthening. This study uses 3-D DD simulations. The<br />
simulated microstructure aims at replicating reactor pressure<br />
vessel (RPV) steels as closely as possible [21,22]. Plasticity<br />
in this material is a function of various strengthening<br />
contributions, i.e. solid solution, second-phase particles<br />
and large dislocation densities. Precipitates in this material<br />
are mainly non-coherent carbi<strong>des</strong> of spherical shape [23].<br />
Simulation of the solid solution contribution has been<br />
reported in a previous paper [24].<br />
In this paper, the methodology and the specifications of<br />
the DD code used in our study are briefly presented. First,<br />
Orowan strengthening is studied with the simple interaction<br />
of an infinite dislocation line interacting with a periodic<br />
row of precipitates. This mechanism is then considered in<br />
the case of more realistic 3-D microstructures. In Section 5,<br />
the combination of Orowan and forest hardening is considered.<br />
Finally, the results of a large and complex simulation<br />
are discussed in Section 6 and compared with the predictions<br />
of the law of mixtures as developed in the previous section.<br />
that relates the dislocation velocity to the effective stress<br />
on dislocation segments takes the form v = sb/B (with a<br />
viscous coefficient B = 10 4 Pa s). (iii) Alloy elements, particularly<br />
interstitials, that impede the movement of dislocations<br />
are accounted for with a friction stress s sol.sol. , acting<br />
as a threshold to dislocation motion. The value of s sol.sol.<br />
has been determined from experimental flow stress measures<br />
made in single crystals containing different amounts<br />
of carbon. Carbon is the principal interstitial. In the case<br />
of RPV steels, which have a carbon content of 100 ppm,<br />
s sol.sol. is taken as 30 MPa [24]. (iv) Use is made of isotropic<br />
elasticity, the shear modulus l equals 83.6 GPa, the Poisson<br />
coefficient m = 0.33 and the magnitude b of the Burgers<br />
vector is 2.48 10 10 m. (v) The cross-slip mechanism of<br />
screw dislocations is known to be very active in iron<br />
[27,29]. However, DD simulations which do not consider<br />
the possibility of dislocation occurring via cross-slip give<br />
much information on dislocation interactions and particle<br />
by-passing. This is why the influence of cross-slip is postponed<br />
to a forthcoming paper. Cross-slip is thus not<br />
allowed in the present study. Tests have been made to<br />
check that the results of this paper are unaffected by the latter<br />
simplification.<br />
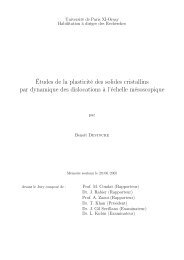
The carbide distribution (see Fig. 1) is quite heterogeneous<br />
in the bainite of RPV steels [21], and very dense<br />
agglomerates are observed. Here, we focus on the spherical<br />
carbi<strong>des</strong> that are outside agglomerates and grain boundaries,<br />
because they represent the largest volumic fraction.<br />
Evaluations of the precipitate density have been made from<br />
Fig. 1 and other scanning electron microscopy (SEM)<br />
images [30]. They yield an average density of 3 10 19 m 3<br />
and a mean precipitate diameter of 0.1 lm. These quantities<br />
correspond approximately [2] to a surface density of 3 <br />
10 12 m 2 and a mean spacing between particles of 0.6 lm.<br />
These measures are in good agreement with previous evaluations<br />
made by transmission electron microscopy [23].<br />
2. Methodology<br />
The DD simulations are performed with the code<br />
microMegas, 1 which is not presented in detail here. Interested<br />
readers are referred to Refs. [25,26]. The specific<br />
developments made in microMegas to simulate a body-centered<br />
cubic (bcc) metal, and in particular ferrite in RPV<br />
steels, have been introduced elsewhere [24]. The main features<br />
are briefly recalled here. (i) DD simulations include<br />
only the 1/2 h1 11if110g systems that have been unambiguously<br />
identified in a-iron [27–29] and well characterized.<br />
(ii) In the athermal regime, dislocation mobility is controlled<br />
mostly by phonon drag. Hence, the mobility law<br />
1 http://zig.onera.fr/mm_home_page/.<br />
Fig. 1. Typical microstructure observed by scanning electron microscopy<br />
in the middle of the pressure vessel thickness. When the largest carbi<strong>des</strong><br />
are found in agglomerates near grain boundaries, the carbi<strong>des</strong> of interest<br />
for this study are the very numerous and smaller carbi<strong>des</strong> present inside<br />
the ferrite.
5<strong>58</strong>8 S. Queyreau et al. / <strong>Acta</strong> <strong>Materialia</strong> <strong>58</strong> (2010) 5<strong>58</strong>6–5595<br />
In the frame of this study, specific developments have<br />
been made in the microMegas code to enable complete<br />
3-D simulation of the influence of spherical carbi<strong>des</strong> precipitates.<br />
These particles correspond to regions that are<br />
perfectly impenetrable to dislocations because carbi<strong>des</strong><br />
are incoherent with the matrix. Consistently, no stress field<br />
is associated with those particles [1,12,31]. More precisely,<br />
the carbide microstructure is randomly distributed in the<br />
simulated volume and overlapping of particles is forbidden.<br />
As a wide range of simulation calculations is reported in<br />
the present work, and to avoid useless repetitions, all common<br />
features of the simulations are now <strong>des</strong>cribed. (i)<br />
First, the reference length k used to discretized the dislocation<br />
lines is adapted to the characteristic length scale K of<br />
the physical problem under investigation (or the smallest<br />
one in the case of multiple mechanisms). In the following<br />
K is, for instance, the carbide size in the case of precipitation<br />
strengthening or the mean spacing between dislocations<br />
in the case of forest hardening. In all computations<br />
k ’ K/5. (ii) Periodic boundary conditions (PBCs) are used<br />
to avoid surface effects. Hence, the simulated volume is<br />
equivalent to a small fraction of bulk material. (iii) Dimensions<br />
of the simulated volume L Vol must also be set up<br />
according to K in order to ensure statistical representativeness:<br />
L Vol P 10K. (iv) Loading is applied at constant strain<br />
rate with an amplitude function of the dislocation density.<br />
The corresponding average dislocation velocity is about<br />
1ms 1 , which is similar to experimental observations<br />
made in pure iron [32] at room temperature. Tests have<br />
shown that the simulation results remain unchanged when<br />
considering smaller strain rates.<br />
3. Orowan strengthening due to a periodic array of<br />
precipitates<br />
In a first set of simulations, configurations made of an<br />
infinite dislocation and a periodic row of particles are considered.<br />
Such calculations are made for comparison with<br />
the work by Bacon, Kocks and Scattergood (BKS) [7]<br />
and to set up important parameters such as the simulation<br />
time step. BKS defined the critical shear stress s BKS<br />
c<br />
to<br />
bypass a row as:<br />
s BKS<br />
c<br />
¼ A lb <br />
L ln D <br />
þ B<br />
r 0<br />
where A is a coefficient depending on the character of the<br />
dislocation. A = 1/2p(1 m) and A = 1/2p for screw and<br />
edge dislocations, respectively (m is Poisson’s ratio). r 0 is<br />
the line energy cut-off radius defining the elastic dislocation<br />
core size, and B is a coefficient which is equal to 0.7 and remains<br />
weak for usual values of particle density and size. In<br />
Eq. (1) BKS introduce D as (D 1 + L 1 ) 1 , a quantity<br />
which derives from the notion of harmonic average. D is<br />
useful to <strong>des</strong>cribe the two limit configurations of the Orowan<br />
strengthening problem. When L, the spacing between<br />
precipitates is low compared to D, the dislocation bows out<br />
ð1Þ<br />
between precipitates without a strong “dipolar” interaction<br />
between sections of dislocations on the opposite side of the<br />
precipitates, thus D L. Alternatively, when the precipitate<br />
diameter D is small when compared to L, the “dipolar”<br />
interactions become large and D D.<br />
As an effect of the PBCs, the location of one particle at the<br />
center of the simulated volume is enough to construct a<br />
periodic array of precipitates. Nevertheless, simulations<br />
accounting for 1, 2 and 3 aligned particles in the simulated<br />
volume were made to check that there are no artifacts associated<br />
with the use of the smallest volume of simulation. The<br />
following particle diameters were considered: 10, 31, 100,<br />
403, 500 and 1000b. For each diameter, two interparticle distances<br />
have been used: 1000 and 10,000b. The ranges of particle<br />
sizes and spacings considered here are identical to the<br />
ones used in Ref. [7] and the corresponding D/L ratios are<br />
included between 1/2 and 1/300. It can be noted that in the<br />
present study, which is looking at carbide hardening in steel,<br />
we restricted investigation to the domain D > 10b, as smaller<br />
solutions would correspond to unrealistic microstructures.<br />
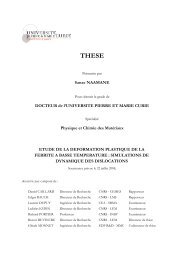
Fig. 2 shows a comparison of the simulation results with<br />
prediction from Eq. (1). A very good agreement is found<br />
not only qualitatively as the dependence upon D is clearly<br />
stated, but also quantitatively as the difference between<br />
DD calculations and the BKS predictions never exceeds<br />
10%. This demonstrates the robustness of the constitutive<br />
rule we considered in the DD simulations to model the<br />
interaction between dislocation lines and carbide particles.<br />
As plastic strain continues, several Orowan dislocation<br />
loops can be stored around particles. Because of the use<br />
of PBCs with a cubic volume, each time the mobile dislocation<br />
reaches the simulation boundaries it is reintroduced in<br />
the same glide plane on the opposite side. Therefore, the<br />
same mobile dislocation can interact with the particle<br />
row many times and repeated formation of Orowan loops<br />
around the particles is simulated. Subsequently, the flow<br />
stress increases and the elastic interaction between the<br />
mobile dislocations and the stored dislocation increases.<br />
In addition, the Orowan loops accumulated in the glide<br />
Critical shear stress (µb/ L)<br />
2<br />
1.5<br />
1<br />
0.5<br />
0<br />
10 100 1000<br />
Harmonic average D (b)<br />
[BKS] screw<br />
DD screw<br />
[BKS] edge<br />
DD edge<br />
Fig. 2. Comparison of the DD results with the prediction of the BKS<br />
model for an infinite row of impenetrable particles.
S. Queyreau et al. / <strong>Acta</strong> <strong>Materialia</strong> <strong>58</strong> (2010) 5<strong>58</strong>6–5595 5<strong>58</strong>9<br />
plane reduce the interparticle distance and it becomes<br />
harder and harder for the mobile dislocation to bow-out<br />
between the particles. This phenomenon is a significant<br />
strengthening mechanism and is known as the sourceshortening<br />
effect [33,34]. In addition, the long-range stress<br />
field of the loops hugging the bypassed particles effectively<br />
decreases the applied stress, and hence contributes to strain<br />
hardening [33,34].<br />
In what follows, a second set of simulations is presented.<br />
This aims to calculate the source-shortening effect on screw<br />
or edge dislocations. For comparison with the RPV carbide<br />
microstructure, a constant mean spacing between particles<br />
of 0.6 lm and a particle diameter of 0.1 lm is considered<br />
here.<br />
The evolution of flow stress as a function of the number<br />
of Orowan loops formed around particles is given in Table<br />
1. For a periodic row of particles, a strong linear hardening<br />
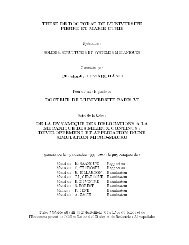
is observed. As illustrated in Fig. 3 in the screw dislocation<br />
case, the critical configuration of the dislocation bow-out<br />
between particles is strongly affected by the presence of<br />
additional Orowan loops. The curvature of the dislocation<br />
increases with the increase in the loop number and thus the<br />
stress level. One may also note the elliptical shape taken by<br />
the Orowan loops in order to minimize the edge sections<br />
(except for the first Orowan loop). As first calculated by<br />
Brown [35] and in agreement with experiments [36], the<br />
shape of such dislocations held in equilibrium around smaller<br />
loops with the same sign is more circular than the one<br />
predicted by de Wit and Koehler [37] in the case of an isolated<br />
bowing loop. The main attribute observed here is that<br />
the critical shapes adopted by the dislocations by-passing<br />
particles with increasing number of Orowan loops are<br />
similar.<br />
The simulation results appear to be consistent with the<br />
concept that the accumulation of loops increases the effective<br />
radius of particles D eff (see Table 1). Hence, one can<br />
propose a simple model to calculate the flow stress evolution<br />
in the simulation. In the following developments, an<br />
initially screw dislocation geometry is considered. Equilibrium<br />
at point A, as sketched in Fig. 3d, is mainly controlled<br />
by two opposing mechanisms. The first one is the repulsive<br />
stress exerted by the pile-up of Orowan loops stored<br />
Table 1<br />
Values of the effective particle diameters, D eff , calculated from the<br />
accumulation of Orowan loops. The particle diameter is 0.1 lm. The<br />
critical resolved flow stress required to bypass the particles is in MPa and<br />
the effective diameters of the particle are in microns.<br />
n loops DD Model<br />
s c screw s c edge<br />
D eff<br />
screw s c screw D eff<br />
edge<br />
s c edge<br />
1 92.1 65 0.22 88 0.2 63<br />
2 109 75 0.26 106 0.26 75<br />
3 126 86 0.3 122 0.3 86<br />
4 143 95 0.34 139 0.34 97<br />
5 163 111 0.36 155 0.36 108<br />
6 – 126 – – 0.38 120<br />
around the particles. This contribution is roughly estimated<br />
with a form proposed by Friedel [38] in the case of<br />
a pile-up of n + 1 straight infinite dislocations: s pile-up<br />
=(n + 1)lb/(2pKr), where r is the distance between A<br />
and the particle center, K is a constant function of the dislocation<br />
character (K =1 m for a pile-up made of edges<br />
as in the present example) and n is the number of loops circumventing<br />
the particles. The pile-up is thus composed of<br />
n + 1 dislocations as the mobile dislocation is in fact the<br />
last one. The second stress contribution is the applied stress<br />
pushing the last dislocation against the Orowan loops. At<br />
the critical configuration, assuming the applied stress is<br />
correctly defined with the BKS equation (Eq. (1)), one<br />
expects:<br />
<br />
lb<br />
s c ¼ A<br />
ðL 0 D eff Þ<br />
<br />
Deff<br />
ln<br />
r 0<br />
<br />
þ B<br />
with<br />
h<br />
D eff ¼ L 0 D i eff 1 1<br />
þðD eff Þ 1<br />
ð3Þ<br />
and L 0 the center-to-center interparticle distance. During<br />
plastic deformation, the increasing applied stress makes<br />
the point A move toward the center O of the particle and<br />
reduces the distance r. The critical configuration is reached<br />
when r cannot be reduced without leading to the release of<br />
the dislocation line—in other words when js pile-up j > js BKS<br />
c<br />
j.<br />
The values predicted by Eq. (2) are compared to the results<br />
of the DD simulation in Table 1. As expected, the effective<br />
diameter increases with the number of Orowan loops. It<br />
can be noted that predicted D eff are the same for an initially<br />
edge or screw dislocation at a given number of loops.<br />
Good agreement is found between Eq. (2) and the simulated<br />
stress computation.<br />
4. Random distribution of carbi<strong>des</strong><br />
The strengthening induced by a random distribution of<br />
carbi<strong>des</strong> is now considered. With this in mind, a carbide distribution<br />
is introduced in simulations with a density of<br />
3 10 19 m 3 , as observed in ferrite of RPV steels. The spherical<br />
particles are assumed to have a constant diameter of<br />
0.1 lm. Around 300 particles are introduced in a periodic<br />
volume of 2 2 2 lm of size. The initial dislocation<br />
microstructure is composed of 20 dislocation segments of<br />
2 lm of length belonging to a single slip system 1/2<br />
½1 11Šð110Þ. This dislocation density, 10 13 m 2 , is in agreement<br />
with TEM observations in RPV steels [39]. The initial<br />
segments are randomly distributed in space and in character.<br />
When isolating the dynamics of one dislocation line in its<br />
glide plane from the 3-D simulation volume, its propagation<br />
through the carbide microstructure looks very similar to the<br />
results of previous DD simulations made in 2-D [4,8,13].<br />
Because of the heterogeneous aspect of the particle distribution,<br />
the movement of dislocations is easy in soft regions,<br />
where particles are distant from each other, whereas in<br />
hard regions, where carbi<strong>des</strong> are closer, the dislocation<br />
<br />
ð2Þ
5590 S. Queyreau et al. / <strong>Acta</strong> <strong>Materialia</strong> <strong>58</strong> (2010) 5<strong>58</strong>6–5595<br />
Fig. 3. Critical shapes of a screw dislocation interacting with a periodic row of particles respectively (a) free of loop, (b) with one Orowan loop, (c)<br />
circumvented by four Orowan loops, and (d) sketch of the quasi-static equilibrium obtained between the curved mobile dislocation and the repulsive<br />
Orowan loops stored around the particles. For the sake of clarity, a single particle is drawn.<br />
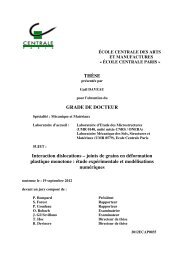
progression is difficult and island loops are sometimes<br />
formed around groups of particles. In Fig. 4, a thin foil<br />
extracted from the 3-D simulated volume emphasizes new<br />
features induced by dislocation–dislocation interactions<br />
out of their glide plane. As highlighted in Fig. 4 inset, dipoles<br />
and multipoles are formed during plastic deformation and<br />
those dipolar configurations are not randomly localized<br />
but stay preferentially between the closest particles.<br />
As in the simple case of a periodic array of precipitates,<br />
significant dislocation storage is found as a result of Orowan<br />
loop and island loop formation. This important dislocation<br />
storage justifies the large strain hardening observed<br />
in the simulation. As illustrated in Fig. 5a, plastic flow<br />
starts at a relatively high applied stress around 70 MPa,<br />
and with increasing strain the flow stress continuously<br />
increases up to 78 MPa at c = 1%. This strain hardening<br />
results from the long-range elastic field associated with<br />
Orowan loops, the source-shortening effect and the dipolar<br />
interactions. The last contribution is relatively weak at<br />
small plastic strain.<br />
In Fig. 5a, comparison is made between stress–strain<br />
curves obtained with and without carbi<strong>des</strong>. This is to<br />
differentiate the contribution of carbi<strong>des</strong> and of dipolar<br />
interactions. Without carbi<strong>des</strong>, the flow stress is as high<br />
Fig. 4. Simulated microstructure resulting from the interaction between a single slip system with a random distribution of carbi<strong>des</strong>. s = 75 MPa and<br />
c = 1%. The thin foils extracted from the simulated volume have a thickness of 0.2 lm and are parallel to the dislocation glide plane. The enlargement (A)<br />
shows the formation of dipoles and multipoles aligned along the smallest carbide spacing.
S. Queyreau et al. / <strong>Acta</strong> <strong>Materialia</strong> <strong>58</strong> (2010) 5<strong>58</strong>6–5595 5591<br />
Fig. 5. Comparison between different simulations with and without a random distribution of carbi<strong>des</strong> and two initial dislocation densities, 10 11 (thin<br />
curves) and 10 13 m 2 (thick curves). (a) Stress–plastic strain curves. (b) Dislocation density evolution as a function of the plastic strain.<br />
as 15 MPa when deducting the constant alloy friction contribution.<br />
To determine the contribution of the carbide<br />
interactions alone without any uncertainty, a second pair<br />
of simulations was performed with a lower initial dislocation<br />
density of 10 11 m 2 . The dipolar interactions in this<br />
case are negligible and no hardening is reproduced with<br />
the simulation in the absence of a carbide distribution<br />
(see Fig. 5a). Finally, the comparison between the flow<br />
stresses with and without particles leads to a particle contribution<br />
of 38 ± 1 MPa. It is worth noting the influence<br />
of the random nature of the particle distribution, which<br />
reduces the flow stresses. Indeed, for a regular distribution<br />
of carbi<strong>des</strong>, the BKS equation gives 44 and 69 MPa for<br />
screw and edge mobile dislocations, respectively.<br />
Some quantitative aspects of the simulation discussed in<br />
this section <strong>des</strong>erve further investigation. The number of<br />
particles bypassed with a mobile dislocation is simply<br />
n c = AN p , where N p is the particle density per surface area<br />
and A is the area swept by dislocations. The Orowan relation<br />
establishes the link between the shear strain c and A such that<br />
c = Ab/V and V is the simulated volume. Combining n c and c<br />
equations yields the number of particles bypassed for a given<br />
shear strain n c = cN p V/b. Numerical application at c = 1%,<br />
leads to the value of 1000 dislocation–particle interactions.<br />
This number is certainly large enough [13] to compare the<br />
results of DD simulations with the predictions of the continuous<br />
model. To assist this comparison, two additional simulations<br />
were performed with different particle densities:<br />
3 10 11 m 2 and 3 10 13 m 2 .<br />
Foreman and Makin [4] and Kocks [5] proposed very<br />
similar expressions for the flow stress s rand<br />
p<br />
¼ K lb (‘p’ stands<br />
L<br />
for particles), where K is a factor of the order of 0.8,<br />
accounting for the particle distribution heterogeneity.<br />
Hirsch and Humphreys [6] proposed an alternative formulation<br />
including a logarithmic term and accounting for the<br />
effect of self-interactions between dislocation line sections<br />
on each side of the particles:<br />
s rand<br />
p<br />
¼ 0:8 lb lnðD=bÞ<br />
ð4Þ<br />
2p L ð1 mÞ 1=2<br />
In Eq. (4), the term (1 m) 1/2 is introduced as an average<br />
of the difference in energy between screw and edge characters.<br />
The model proposed later by Bacon et al. [7] (BKS)<br />
makes use of the Friedel’s approximation for a distribution<br />
of weak obstacles. These authors assume that the by-passing<br />
of an impenetrable “strong” obstacle of finite size is<br />
equivalent to the interaction with a weaker point obstacle,<br />
due to the self-interactions on each side of the precipitates.<br />
It yields:<br />
<br />
s rand<br />
p<br />
¼ lnðD=bÞþ0:7 3=2<br />
lb lnðl=bÞ<br />
lnðL=bÞ l 2p<br />
where D is the harmonic average (cf. Section 3).<br />
The predictions of the various models are compared<br />
in Table 2. For carbide densities of 3 10 11 and 3 <br />
10 12 m 2 , the differences with the simulation results are<br />
low (
5592 S. Queyreau et al. / <strong>Acta</strong> <strong>Materialia</strong> <strong>58</strong> (2010) 5<strong>58</strong>6–5595<br />
Starting from the simulations with the largest particle<br />
density, it is possible to determine with good accuracy<br />
the dislocation storage rate associated with the formation<br />
of Orowan loops. In single slip condition and without particles,<br />
the dislocation density increases with the plastic<br />
deformation mostly as a result of dislocation multiplication.<br />
With a particle distribution, dislocation storage is<br />
much larger and comes mainly from the formation of Orowan<br />
loops. In both cases, the increase of dislocation density<br />
is linear (see Fig. 5) and a constant storage rate is found in<br />
the simulations. The storage of dislocations induced by<br />
particles is 7.2 10 15 m 2 which compares with a single<br />
slip multiplication rate of 4.2 10 15 in a crystal free of<br />
particles. It is reasonable to assume that the two storage<br />
mechanisms, i.e. the Orowan loop accumulation and the<br />
dislocation line multiplication, are not coupled. Thus,<br />
the total dislocation accumulation rate should simply be<br />
the sum of the rates for each mechanism.<br />
To examine this assumption, a simple predictive model<br />
is developed for the Orowan loops storage mechanism.<br />
We first consider a dislocation line which sweeps an area<br />
A in a volume V. During its flight, the dislocation bypasses<br />
n = N p A particles, with N p the particle density per unit<br />
area. It is assumed that Orowan loops have a circular shape<br />
with a perimeter 2pr eff , where r eff is the particle effective<br />
radius seen by the dislocations. At small strain, r eff<br />
accounts for the fact that particles are on average cut at<br />
planes different from the particle hemisphere. Simple calculations<br />
give r eff = pr/4 [2], and the increment in dislocation<br />
density Dq =2pr eff N p A/V. For the same area swept, the<br />
shear strain increment is Dc = Ab/V. Hence:<br />
Dq<br />
Dc ¼ rp2 N p<br />
2b<br />
One may note that only the size and the density of particles<br />
appear in Eq. (6) and not the dislocation density.<br />
Numerical application with a radius r = 0.05 lm and a<br />
density N p =3 10 12 m 2 leads to a dislocation storage<br />
rate of 3 10 15 m 2 in good agreement with the results<br />
found in the simulation based on the difference between<br />
the two curves of Fig. 5b.<br />
5. Orowan and forest strengthening superposition<br />
The results of more general simulations, including a combination<br />
of Orowan strengthening and forest hardening, are<br />
now presented. These simulations aim to characterize quantitatively<br />
the strain hardening imposed by the microstructure<br />
reproducing RPV steel. In this section, we take advantage of<br />
the possibilities offered by DD simulations to consider different<br />
dislocation–dislocation reactions by changing the slip<br />
systems considered in the initial dislocation density. Such<br />
simulations, in which a single primary slip system interacts<br />
with some selected forest systems have already been used<br />
to study forest hardening in pure fcc and bcc metals<br />
[24,40]. More precisely, such model simulations of latent<br />
hardening were used to determine the interaction coefficients<br />
ð6Þ<br />
a ij , which measure the mean interaction strength between<br />
two slip systems in a Taylor-like equation:<br />
qffiffiffiffiffiffiffiffiffiffiffiffiffiffiffiffiffiffiffi<br />
X<br />
s i f ¼ lb va<br />
ij<br />
q j<br />
ð7Þ<br />
where q j is the density of the systems j interacting with a<br />
system i, and v is a parameter accounting for the logarithmic<br />
deviation of coefficients a ij with dislocation density increase<br />
[24,40].<br />
The simulation protocol used in this section is similar to<br />
the one used in Ref. [24]. The initial primary dislocation<br />
density (the mobile system) is 10 13 m 2 whereas the forest<br />
density (the unloaded systems) is 2 10 13 m 2 . The forest<br />
density is made of two equivalent slip systems, i.e. having<br />
the same type of reaction with the dislocations in the primary<br />
slip system. Note that the dislocation densities we<br />
consider in the present study are much larger than what<br />
is currently used in DD simulations. However, rescaling<br />
operations to compare our results with previous computations<br />
is straightforward [40]. The simulated volume has a<br />
size of 2 lm. Forest segments are initially 5 lm long. The<br />
primary dislocation density is still composed of 20 sources<br />
of length 2 lm.<br />
For reasons of symmetry in the bcc structure, only six<br />
different types of dislocation–dislocation reactions exist<br />
between the 1/2 h1 11if110g slip systems [41]. Among<br />
such reactions, only four reactions imply non-coplanar<br />
contact reaction. They are the most important ones as they<br />
form strong forest obstacles anchoring mobile dislocations<br />
[38,42]. The first three reactions are related to the process<br />
of junction formation: (i) a junction in the mixed 54.7°<br />
direction that is called “symmetric” as the angles between<br />
the Burgers vectors of interacting dislocations with the<br />
junction direction are identical; (ii) a mixed junction that<br />
is “asymmetric”; and (iii) a junction in the edge direction.<br />
The fourth reaction is associated with the intersection of<br />
two slip systems having identical Burgers vectors but in different<br />
gliding planes. The reaction product is a null Burgers<br />
vector, and leads to the vanishing of the intersecting sections.<br />
For this reason, it is called (iv) collinear annihilation.<br />
One of the main results of previous investigations dedicated<br />
to forest strengthening in bcc structures [24,41] is certainly<br />
the hierarchy between these reactions (see Table 3).<br />
As in other structures [40,43], the collinear annihilation is<br />
by far the strongest reaction. The symmetrical mixed junction<br />
is stronger than the other two, which are of approximately<br />
the same strength.<br />
The microstructures extracted from simulations accounting<br />
simultaneously for the forest interactions and particles<br />
are shown in Fig. 6 for each type of slip system interactions.<br />
Table 3<br />
DD measures of the flow stresses (in MPa) associated with different slip<br />
system interactions using the classification based on the dislocation<br />
reaction proposed in Ref. [41].<br />
Dipolar Colli. annihil. Sym. mixed J. Asym. mixed J. Edge J.<br />
15 61 27 21 22
S. Queyreau et al. / <strong>Acta</strong> <strong>Materialia</strong> <strong>58</strong> (2010) 5<strong>58</strong>6–5595 5593<br />
On one hand, the strengthening hierarchy is preserved<br />
<strong>des</strong>pite the presence of particles. With the collinear annihilation<br />
(Fig. 6a), primary dislocations are cut into many small<br />
segments—the signature of a large number of annihilations.<br />
Much collinear debris is formed in the shape of small loops.<br />
Primary dislocations are strongly bowed-out and this contrasts<br />
with the other interactions leading to junctions, where<br />
segments are less curved (Fig. 6b and d). Among junctions,<br />
symmetrical mixed junctions are relatively more numerous<br />
and longer than the other junctions, and primary dislocations<br />
are slightly more curved.<br />
On the other hand, specific observations can be made<br />
related to the presence of carbi<strong>des</strong>. First, in all the microstructures<br />
of Fig. 6, the primary dislocations are more curved<br />
than the equivalent ones obtained without carbi<strong>des</strong> [24] as<br />
the flow stress is larger, resulting from precipitate strengthening<br />
(see Fig. 7). Hence, forest junctions are 30% smaller<br />
than in simulations without precipitates. The mean length<br />
of junctions is 0:31q 1=2<br />
f<br />
for symmetrical mixed junctions,<br />
and 0:12q 1=2<br />
f<br />
for the two other types of junctions. Indeed,<br />
the existence of carbi<strong>des</strong> limits the junction zipping process.<br />
Moreover, dynamic effects are observed in the simulations.<br />
For instance, dislocations have to form very narrow angles<br />
around the carbi<strong>des</strong> to bypass them. The release of dislocation<br />
lines, once Orowan loops are formed, generally induces<br />
a <strong>des</strong>truction of neighboring junctions, hence initiating a<br />
plastic avalanche as <strong>des</strong>cribed in Ref. [44].<br />
Simulation results obtained in this section are now compared<br />
with the flow stress predictions made with different<br />
rules of mixtures and making use of the simulated flow<br />
Fig. 7. Stress–strain curves for latent hardening simulations with (continuous<br />
line) and without a carbide microstructure (dashed line). The two<br />
types of forest reaction considered are respectively the collinear annihilation<br />
(thick lines) and the asymmetrical mixed junction (thin line).<br />
stress obtained in the previous sections for Orowan<br />
strengthening and forest hardening individually. Existing<br />
solutions of rules of mixtures can be classified with the generic<br />
form s k tot ¼ sk 1 þ sk 2<br />
. From the seminal work of Brown<br />
and Ham [1] we know that the linear solution (k = 1) gives<br />
good results in the case of few strong obstacles dispersed in<br />
many weak obstacles. For instance, this solution is well<br />
adapted to the combination of dislocation interactions with<br />
solid-solution strengthening. It was also proposed to apply<br />
this solution, with slight modification, to the strengthening<br />
associated with the plastic zone formed around underformable<br />
particles in a plastically deformed metal matrix [45].<br />
Fig. 6. Simulated microstructure obtained under loading at c = 0.25% for the different simulations of latent hardening. The thin foils have a thickness of<br />
0.06 lm and belong to the primary slip plane. Junctions correspond to thick straight segments, and carbi<strong>des</strong> are in grey. The simulations involve<br />
respectively (a) collinear annihilations, (b) symmetrical mixed junctions, (c) asymmetrical mixed junctions and (d) edge junctions.
5594 S. Queyreau et al. / <strong>Acta</strong> <strong>Materialia</strong> <strong>58</strong> (2010) 5<strong>58</strong>6–5595<br />
Table 4<br />
Comparison of the prediction of usual rule of mixtures prediction with DD simulation results when combining forest and carbide strengthening. The<br />
different forest reactions considered are dipolar interaction, collinear annihilation, mixed asymmetric junction, edge junction and mixed symmetric<br />
junction with three increasing particle densities. The flow stress values for the DD simulation are taken at c = 0.25% and are given in MPa.<br />
Rules of mixtures k =1 k = 3/2 k = 2 Monnet DD<br />
Dipol. + Carb. 53 44 40 27 40 ± 1<br />
Colli. A. + Carb. 99 80 77 70 78 ± 3<br />
Asym. J. + Carb. <strong>58</strong> 47 44 32 48 ± 2<br />
Edge J. + Carb. 60 48 45 34 48 ± 2<br />
Sym. J. + Carb. (3 10 11 m 2 ) 39 31 30 28 35 ± 3<br />
Sym. J. + Carb. (3 10 12 m 2 ) 65 52 48 38 52 ± 3<br />
Sym. J. + Carb. (3 10 13 m 2 ) 130 110 107 97 118 ± 4<br />
The quadratic form (k = 2) first proposed by Koppenaal<br />
and Kuhlmann-Wilsdorf [46] assumes that the obstacle<br />
families have very similar strength. When the obstacles<br />
have identical planar densities, this yields the form proposed<br />
by Labush [47] with k = 3/2. More recently, Monnet [13]<br />
proposed a generalized rule of mixtures, in which the<br />
strength of obstacles is balanced by their concentration. It<br />
qffiffiffiffiffiffiffiffiffiffiffiffiffiffiffiffiffi<br />
follows s ¼ðs 1 l 2 þ s 2 l 1 Þ= l 2 1 þ <br />
l2 2<br />
, where l is the average<br />
spacing between the obstacles of each obstacle family.<br />
Comparison between these different rules of mixtures and<br />
the simulation results are reported in Table 4. It should be<br />
noted that the linear rule and the solution proposed by Monnet<br />
[13] give poor evaluation of the flow stress. Conversely,<br />
the rules with k = 3/2 and k = 2 lead to rather good prediction<br />
with all tested combinations. Such agreement with all<br />
the simulations is remarkable since the specific strength of<br />
the two hardening mechanisms tested in the simulation are<br />
very different. First, the range of particle densities explored<br />
lies within two orders of magnitude. Secondly, the difference<br />
between the flow stress induced by dipolar interactions and<br />
collinear annihilations is significant, i.e. 46 MPa. The two<br />
rules of mixtures with k = 3/2 and k = 2 are numerically difficult<br />
to distinguish and one can easily check that this is<br />
because the two forms give very similar predictions for a<br />
wide range of stresses [0, 1000 MPa]. As a result, their difference<br />
never exceeds 12%. Considering that the quadratic law<br />
has already proved its reliability in the case of multiple dislocation–dislocation<br />
interactions [48], the rule of mixtures<br />
form with k = 2 is preferred in the final section of this paper.<br />
a plateau at a stress level around 100 MPa is reached. Note<br />
that the primary dislocation density at c = 1% is increased<br />
by a factor 12. However, no strain hardening can be precisely<br />
calculated from this curve because of the presence<br />
of quite large stress fluctuations. Plastic deformation proceeds<br />
by bursts and the simulated reference volume is too<br />
small to smear out plastic avalanches.<br />
Considering the results reported in previous sections, the<br />
total flow stress s in the present single slip simulation<br />
should be calculated with:<br />
qffiffiffiffiffiffiffiffiffiffiffiffiffiffi<br />
s ¼ s i ¼ s sol:sol: þ s 2 p þ s2 f<br />
ð8Þ<br />
where s i is the critical stress on the active slip system i, s p is<br />
the particle strengthening contribution calculated from Eq.<br />
(5) and s f is the forest hardening contribution calculated<br />
from Eq. (7).<br />
For the purpose of validating Eq. (8), it is worth noting<br />
that only the carbi<strong>des</strong> and the slip system densities need to<br />
be defined. As the latter quantities are explicit variables of<br />
DD simulations, one can immediately test the prediction of<br />
Eq. (8) by monitoring the slip system densities during computation,<br />
and compare these with the simulated stress–<br />
strain curves reported in Fig. 8. Clearly, the quadratic rule<br />
6. Validation of the quadratic mixture law<br />
In this final section, the robustness of the quadratic rule<br />
of mixtures is tested with the most complex computation<br />
we have used to simulate plasticity of RPV steel. A tensile<br />
test simulation is made with the loading axis at the center<br />
of the standard triangle, [1511], hence imposing a single<br />
slip condition. The initial dislocation microstructure contains<br />
the 12 1/2 h1 11if110g slip systems. The total dislocation<br />
density is initially 10 14 m 2 and the carbide size and<br />
density are respectively of 0.1 lm and 3 10 12 m 2 .<br />
The corresponding stress–strain curve is reproduced in<br />
Fig. 8. The flow stress increases up to c = 0.25 %, where<br />
Fig. 8. Comparison of the simulated flow stress with the prediction of a<br />
quadratic rule of mixtures accounting for Orowan and forest hardening.<br />
The tensile test simulated corresponds to single slip condition and<br />
accounts for carbi<strong>des</strong> and dislocations microstructures consistent with<br />
observations made in RPV steel.
S. Queyreau et al. / <strong>Acta</strong> <strong>Materialia</strong> <strong>58</strong> (2010) 5<strong>58</strong>6–5595 5595<br />
of mixtures does not apply in the first stages of the plastic<br />
deformation. In this domain, the simulated flow stress initially<br />
increases very fast since the simulated dislocation distribution<br />
is not yet a realistic 3-D interconnected network<br />
of dislocations. Indeed, a statistically well-defined dislocation<br />
microstructure (with, for instance, a stabilized average<br />
segment length between junctions) takes about c = 0.25%<br />
to form in the present simulation. From that strain, the<br />
agreement between Eq. (8) and the simulated stress–strain<br />
curve is extremely good. This clearly shows that a quadratic<br />
rule of mixtures has the capacity to account for<br />
the composition of Orowan strengthening and forest hardening<br />
in materials with a microstructure like RPV steel.<br />
7. Conclusion<br />
DD simulations have been used to investigate the combination<br />
of Orowan and forest hardening in the case of a<br />
complex material of great technological interest. Use is<br />
made of realistic dislocation and particle microstructures<br />
accounting for the 3-D details of the ferrite when deformed<br />
at room temperature. The main results of this work can be<br />
summarized as follows:<br />
– The reliability of the simulation treatment of impenetrable<br />
carbi<strong>des</strong> in the absence of forest interactions is<br />
proved via the study of simple configurations for which<br />
analytical models exist. A significant linear hardening is<br />
observed when Orowan loops are stored within a single<br />
glide plane. A simple model is proposed which correctly<br />
<strong>des</strong>cribes the hardening rate observed in that simulation.<br />
– The strengthening associated with a random distribution<br />
of carbi<strong>des</strong> is investigated and compared to existing<br />
models. A geometrical model is proposed to <strong>des</strong>cribe<br />
the dislocation storage associated with the formation<br />
of Orowan loops. Among all the models proposed for<br />
Orowan strengthening, the formulation reported by<br />
Bacon, Kocks and Scattergood [7] gives the best prediction<br />
of the simulation results. The latter equation is recognized<br />
as a reliable solution for RPV steel.<br />
– Consistent with the results of a previous study on forest<br />
hardening in a-iron [24], the realism of the Taylor-like<br />
equation proposed in Ref. [40] for fcc crystals is validated<br />
again for the very large densities of dislocations<br />
observed in RPV steel.<br />
– The combination of the Orowan strengthening and forest<br />
hardening has been studied with the help of latent hardening<br />
simulations. For this purpose, very different configurations<br />
in terms of relative densities and strengths of<br />
obstacles are considered. A quadratic rule of mixtures is<br />
shown to give a good prediction of the total strain hardening<br />
found with obstacles as different as impenetrable<br />
carbi<strong>des</strong>, non-contact dipolar interactions, dislocation<br />
contact reactions such as junction formations and collinear<br />
annihilations. Lastly, this rule of mixtures (Eq. (8)) is<br />
recognized as a reliable solution for RPV steel with a complex<br />
tensile test simulation in single slip condition, where<br />
all possible dislocation–dislocation and dislocation–<br />
particle interactions are accounted for.<br />
References<br />
[1] Brown LM, Ham RK. In: Kelly A, Nicholson RB, editors.<br />
Strengthening methods in solids. Barking: Applied Science Publishers;<br />
1971.<br />
[2] Nembach E. Particle strengthening of metals and alloys. New<br />
York: Wiley; 1996.<br />
[3] E. Orowan, Symposium on internal stresses. In: Metals and alloys.<br />
London: Institute of Metals; 1948.<br />
[4] Foreman AJE, Makin MJ. Can J Phys 1967;45:511.<br />
[5] Kocks UF. Can J Phys 1967;45:737.<br />
[6] Hirsch PB, Humphreys FJ. In: Argon AS, editor. The physics of<br />
strength and plasticity. Cambridge (MA): MIT Press; 1969.<br />
[7] Bacon DJ, Kocks UF, Scattergood RO. Philos Mag 1973;28:1241.<br />
[8] Mohles V. Mater Sci Eng 2001;A309–310:265.<br />
[9] Mohles V. Philos Mag 2001;A81:971.<br />
[10] Mohles V. Philos Mag Lett 2003;83:9.<br />
[11] Mohles V. Mater Sci Eng 2004;A365:144.<br />
[12] Shin CS, Fivel MC, Verdier M, Robertson C. Mater Sci Eng<br />
2005;A400–401:166.<br />
[13] Monnet G. Philos Mag 2006;86:5927.<br />
[14] Kocks UF, Argon AS, Ashby MF. Prog Mater Sci 1975;19:1.<br />
[15] Ardell AJ. Metall Trans 1985;16A:2131.<br />
[16] Nembach E, Martin M. <strong>Acta</strong> Metall 1980;28:1069.<br />
[<strong>17</strong>] Buttner N, Fusenig KD, Nembach E. <strong>Acta</strong> Metall 1987;35:845.<br />
[18] Nembach E, Chow CK. Mater Sci Eng 1978;36:271.<br />
[19] Reppich B, Kuhlein W, Meyer G, Puppel D, Schulz M, Schumann G.<br />
Mater Sci Eng 1986;83:45.<br />
[20] Zhu AW, Csontos A, Starke Jr EA. <strong>Acta</strong> Mater 1999;47:<strong>17</strong>13.<br />
[21] Karlik M, Nebdal I, Siegl J. Mater Sci Eng 2003;A357:423.<br />
[22] Nohava J, Hausild P, Karlik M, Bompard P. Mater Charact<br />
2003;49:211.<br />
[23] Hausild P. PhD thesis, Ecole Centrale Paris; 2002.<br />
[24] Queyreau S, Monnet G, Devincre B. Int J Plast 2009;25:361.<br />
[25] Devincre B, Kubin LP, Lemarchand C, Madec R. Mater Sci Eng A<br />
2001;309–310:211.<br />
[26] Monnet G, Devincre B, Kubin LP. <strong>Acta</strong> Mater 2004;52:43<strong>17</strong>.<br />
[27] Taoka T, Takeuchi S, Furubayashi EJ. Phys Soc Jpn 1964;19:701.<br />
[28] Keh AS. Philos Mag Ser 8 1964;12:9.<br />
[29] Franciosi P. <strong>Acta</strong> Metall 1983;31:1331.<br />
[30] Monnet G. Personal communication.<br />
[31] Shin CS, Fivel MC, Verdier M, Oh KH. Philos Mag 2003;83:369.<br />
[32] Urabe N, Weerman J. Mater Sci Eng 1975;18:41.<br />
[33] Brown LM, Stobbs WM. Philos Mag 1971;23:1185.<br />
[34] Atkinson JD, Brown LM, Stobbs WM. Philos Mag 1974;30:1247.<br />
[35] Brown LM. Philos Mag Lett 2001;81:6<strong>17</strong>.<br />
[36] Humphreys FJ, Hatherly M. In: Recrystallization and related<br />
annealing phenomena. Oxford: Pergamon Press; 2004. p. 238.<br />
[37] de Wit G, Koehler JS. Phys Rev 1959;116:1113.<br />
[38] Friedel J. In: Dislocations. Oxford: Pergamon Press; 1964.<br />
[39] Robertson CF, Obrtlik K, Marini B. J Nucl Mater 2007;366:<strong>58</strong>.<br />
[40] Devincre B, Kubin L, Hoc T. Scripta Mater 2006;54:741.<br />
[41] Madec R, Kubin L. Scripta Mater 2008;56:767.<br />
[42] Saada G. <strong>Acta</strong> Metall 1960;8:841.<br />
[43] Durinck J, Devincre B, Kubin LP, Cordier P. Am Mineral<br />
2007;92:1346.<br />
[44] Devincre B, Hoc T, Kubin LP. Science 2008;320:<strong>17</strong>45.<br />
[45] Brown LM, Stobbs WM. Philos Mag 1976;34:351.<br />
[46] Koppenaal TJ, Kuhlmann-Wilsdorf D. Appl Phys Lett 1964;<br />
4:59.<br />
[47] Labusch R. Phys Stat Solidi 1970;41:659.<br />
[48] Franciosi P, Berveiller M, Zaoui A. <strong>Acta</strong> Metall 1981;28:273.