PFR - Aerospace Engineering Sciences Senior Design Projects ...
PFR - Aerospace Engineering Sciences Senior Design Projects ...
PFR - Aerospace Engineering Sciences Senior Design Projects ...

Create successful ePaper yourself
Turn your PDF publications into a flip-book with our unique Google optimized e-Paper software.
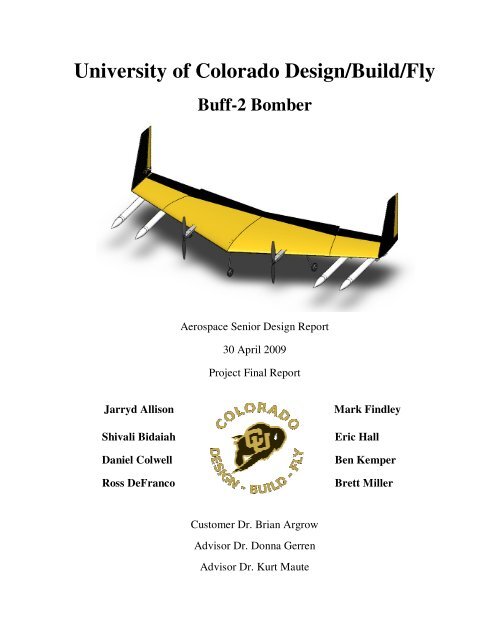
University of Colorado <strong>Design</strong>/Build/Fly<br />
Buff-2 Bomber<br />
<strong>Aerospace</strong> <strong>Senior</strong> <strong>Design</strong> Report<br />
30 April 2009<br />
Project Final Report<br />
Jarryd Allison<br />
Shivali Bidaiah<br />
Daniel Colwell<br />
Ross DeFranco<br />
Mark Findley<br />
Eric Hall<br />
Ben Kemper<br />
Brett Miller<br />
Customer Dr. Brian Argrow<br />
Advisor Dr. Donna Gerren<br />
Advisor Dr. Kurt Maute
Project Final Report – CUDBF April 30 th , 2009<br />
ASEN 4028: <strong>Aerospace</strong> <strong>Senior</strong> <strong>Projects</strong><br />
Table of Contents<br />
List of Figures ..................................................................................................................... vi<br />
List of Tables ........................................................................................................................x<br />
List of Acronyms................................................................................................................. xi<br />
List of Symbols ................................................................................................................. xiii<br />
1.0 Project Objectives and Requirements ............................................................................. 16<br />
1.1 Background ............................................................................................................... 16<br />
1.2 Project Goal ............................................................................................................... 16<br />
1.3 Project Objectives ...................................................................................................... 16<br />
2.0 System Architecture ...................................................................................................... 18<br />
2.1 Overview of Systems ................................................................................................. 18<br />
2.2 Competition Missions Concept of Operations ............................................................ 19<br />
2.2.1 Ground Mission: Assembly ................................................................................. 20<br />
2.2.2 Flight Mission 1: Ferry Flight ............................................................................. 20<br />
2.2.3 Flight Mission 2: Surveillance Flight................................................................... 21<br />
2.2.4 Flight Mission 3: Store Release/Asymmetric Loads ............................................ 21<br />
2.3 Mechanical and Electrical <strong>Design</strong> Requirements ........................................................ 22<br />
2.4 Overall System .......................................................................................................... 22<br />
2.4.1 Solid Model and Mass Breakdown ...................................................................... 22<br />
2.4.2 Electrical System Schematics .............................................................................. 24<br />
3.0 Development and Assessment of System <strong>Design</strong> Alternatives ....................................... 25<br />
3.1 Mission Sensitivity Analysis ...................................................................................... 25<br />
3.2 Aircraft Configuration ............................................................................................... 27<br />
3.2.1 (System Option #1) Flying Wing......................................................................... 27<br />
3.2.2 (System Option #2) Canard ................................................................................. 27<br />
3.2.3 (System Option #3) Conventional ....................................................................... 27<br />
3.3 Comparison of System Options .................................................................................. 27<br />
4.0 System <strong>Design</strong>-To Specifications .................................................................................. 30<br />
4.1 Aerodynamics <strong>Design</strong>-To Specifications ................................................................... 30<br />
4.2 Missions <strong>Design</strong>-To Specifications ............................................................................ 30<br />
5.0 Development and Assessment of Subsystem <strong>Design</strong> Alternatives .................................. 31<br />
5.1 Aerodynamics Subsystem <strong>Design</strong> Alternatives .......................................................... 31<br />
5.1.1 Aircraft Geometry ............................................................................................... 31<br />
5.1.2 Airfoil Selection .................................................................................................. 32<br />
5.2 Missions Subsystem <strong>Design</strong> Alternatives ................................................................... 34<br />
5.2.1 Wing Store Release Mechanism .......................................................................... 34<br />
5.2.2 Centerline Store .................................................................................................. 37<br />
5.2.3 Container ............................................................................................................ 39<br />
5.3 Propulsion Subsystem <strong>Design</strong> Alternatives ................................................................ 39<br />
5.4 Structures Subsystem <strong>Design</strong> Alternatives ................................................................. 42<br />
i
Project Final Report – CUDBF April 30 th , 2009<br />
ASEN 4028: <strong>Aerospace</strong> <strong>Senior</strong> <strong>Projects</strong><br />
5.4.1 Wing Construction .............................................................................................. 42<br />
5.4.2 Wing Span Reduction Method and Joint Location ............................................... 44<br />
5.4.3 Landing Gear Configuration ............................................................................... 45<br />
5.4.4 Main Landing Gear Material ............................................................................... 47<br />
6.0 Subsystem <strong>Design</strong>-To Specifications ............................................................................. 48<br />
6.1 Aerodynamics <strong>Design</strong>-To Specifications ................................................................... 48<br />
6.2 Missions <strong>Design</strong>-To Specifications ............................................................................ 48<br />
6.2.1 Wing Mounted Store ........................................................................................... 48<br />
6.2.2 Centerline Store .................................................................................................. 49<br />
6.2.3 Container ............................................................................................................ 49<br />
6.3 Propulsion <strong>Design</strong>-To Specifications ......................................................................... 49<br />
6.4 Structures <strong>Design</strong>-To Specifications .......................................................................... 50<br />
6.4.1 Aircraft Wing Requirements ............................................................................... 50<br />
6.4.2 Landing Gear Requirements................................................................................ 50<br />
6.5 Avionics <strong>Design</strong>-To Specifications ............................................................................ 51<br />
6.5.1 Transmitter ......................................................................................................... 51<br />
6.5.2 Telemetry System ............................................................................................... 51<br />
6.5.3 Microcontroller System ...................................................................................... 51<br />
7.0 Project Feasibility and Risk Assessment ........................................................................ 52<br />
7.1 Project Feasibility ...................................................................................................... 52<br />
7.1.1 Weight Budget and Feasibility ............................................................................ 52<br />
7.1.2 Cost Feasibility ................................................................................................... 52<br />
7.1.3 Aerodynamic Feasibility ..................................................................................... 52<br />
7.1.4 Propulsion Feasibility ......................................................................................... 54<br />
7.1.5 Payload Feasibility.............................................................................................. 56<br />
7.1.6 Assembly Feasibility........................................................................................... 56<br />
7.2 Risk Assessment ........................................................................................................ 57<br />
7.2.1 Aerodynamics ..................................................................................................... 57<br />
7.2.2 Avionics ............................................................................................................. 58<br />
7.2.3 Propulsion .......................................................................................................... 58<br />
7.2.4 Structures............................................................................................................ 58<br />
7.2.5 Missions ............................................................................................................. 58<br />
7.2.6 Microcontroller ................................................................................................... 58<br />
8.0 Mechanical <strong>Design</strong> Elements ......................................................................................... 60<br />
8.1 Aerodynamics Mechanical <strong>Design</strong> Elements ............................................................. 60<br />
8.1.1 Aircraft Geometry ............................................................................................... 60<br />
8.1.2 Airfoil Selection and Aerodynamic Twist ........................................................... 61<br />
8.1.3 Aircraft Incidence Angle ..................................................................................... 62<br />
8.1.4 Control Surface Sizing ........................................................................................ 62<br />
8.1.5 Stability Analysis ................................................................................................ 64<br />
8.1.6 Drag Analysis ..................................................................................................... 72<br />
8.2 Missions Mechanical <strong>Design</strong> Elements ...................................................................... 76<br />
8.2.1 Wing Store <strong>Design</strong> Element ................................................................................ 76<br />
ii
Project Final Report – CUDBF April 30 th , 2009<br />
ASEN 4028: <strong>Aerospace</strong> <strong>Senior</strong> <strong>Projects</strong><br />
8.2.3 Box <strong>Design</strong> ......................................................................................................... 79<br />
8.3 Propulsion Mechanical <strong>Design</strong> Elements ................................................................... 80<br />
8.3.1 Motor Selection .................................................................................................. 80<br />
8.3.2 Propeller ............................................................................................................. 81<br />
8.4 Structures Mechanical <strong>Design</strong> Elements .................................................................... 82<br />
8.4.1 Wing Bending Model .......................................................................................... 82<br />
8.4.2 Wing Material Selection...................................................................................... 84<br />
8.4.3 Wing Stress Analysis .......................................................................................... 86<br />
8.4.4 Folding Wing System .......................................................................................... 88<br />
8.4.5 Landing Gear Positioning and Stability ............................................................... 89<br />
8.4.6 Longitudinal and Lateral Ground Stability: ......................................................... 90<br />
8.4.7 Main Gear Loading Analysis ............................................................................... 92<br />
8.4.8 Nose Gear Selection ............................................................................................ 95<br />
8.4.9 Motor Mount....................................................................................................... 96<br />
8.4.10 Motor Mount Loading Analysis ........................................................................ 97<br />
9.0 Electrical <strong>Design</strong> Elements .......................................................................................... 100<br />
9.1 Propulsion Electrical <strong>Design</strong> Elements ..................................................................... 100<br />
9.1.1 Propulsion Electrical Overview ......................................................................... 100<br />
9.1.2 Propulsion Batteries .......................................................................................... 100<br />
9.1.3 Electronic Speed Controller .............................................................................. 102<br />
9.1.4 Wire Gauge ....................................................................................................... 103<br />
9.1.5 Fuse .................................................................................................................. 104<br />
9.2 Avionics Electrical <strong>Design</strong> Elements ....................................................................... 104<br />
9.2.1 Avionics Electrical Overview ............................................................................ 104<br />
9.2.2 Payload Release Microcontroller ....................................................................... 105<br />
9.2.3 Transmitter/Receiver Selection ......................................................................... 108<br />
9.2.4 Servo Selection ................................................................................................. 108<br />
9.2.5 Eagle Tree Telemetry Capabilities .................................................................... 109<br />
10.0 Software <strong>Design</strong> Elements ......................................................................................... 112<br />
10.1 Aerodynamic <strong>Design</strong> Software............................................................................... 112<br />
10.2 Avionics Microcontroller Software ........................................................................ 113<br />
11.0 Integration Plan ......................................................................................................... 115<br />
11.1 Aircraft Overview .................................................................................................. 115<br />
11.2 Wing Sub-Assembly .............................................................................................. 116<br />
11.2.1 Wing Assembly............................................................................................... 116<br />
11.2.2 Vertical Tail Assembly.................................................................................... 116<br />
11.3 Structures Sub-Assembly ....................................................................................... 117<br />
11.3.1 Folding Wingtip Assembly.............................................................................. 118<br />
11.3.2 Landing Gear Assembly .................................................................................. 118<br />
11.4.1 Motor Mount Assembly .................................................................................. 120<br />
11.4.2 Battery Assembly ............................................................................................ 120<br />
11.5 Release Mechanism Sub- Assembly ....................................................................... 121<br />
11.6 Avionics Sub- Assembly ........................................................................................ 123<br />
iii
Project Final Report – CUDBF April 30 th , 2009<br />
ASEN 4028: <strong>Aerospace</strong> <strong>Senior</strong> <strong>Projects</strong><br />
11.6.1 Receiver Assembly ......................................................................................... 123<br />
11.6.2 Servo Assembly .............................................................................................. 123<br />
11.7 Aircraft Assembly ................................................................................................. 123<br />
12.0 Fabrication and Integration ........................................................................................ 124<br />
12.1 Interior Sub-Assembly ........................................................................................... 124<br />
12.2 Exterior Sub-Assembly .......................................................................................... 125<br />
12.3 Wingtip Sub-Assembly .......................................................................................... 126<br />
12.4 Main Wing Sub-Assembly ..................................................................................... 127<br />
12.4 Full System Assembly ........................................................................................... 128<br />
13.0 Verification and Validation ....................................................................................... 130<br />
13.1 Subsystem Verification and Validation .................................................................. 130<br />
13.1.1 Missions Subsystem Verification and Validation ............................................ 130<br />
13.1.2 Propulsion Subsystem Verification and Validation .......................................... 131<br />
13.1.3 Structures Subsystem Verification and Validation ........................................... 133<br />
13.1.4 Avionics Subsystem Verification and Validation ............................................ 137<br />
13.2 System Verification and Validation ....................................................................... 138<br />
13.2.1Wingtip Lift Test ............................................................................................. 138<br />
13.2.2 System Flight Testing ..................................................................................... 138<br />
13.2.3 System Requirements Not Tested or Verified .................................................. 153<br />
14.0 Project Management Plan .......................................................................................... 154<br />
14.1 Organizational Responsibilities.............................................................................. 154<br />
14.2 Work Breakdown Structure ................................................................................... 155<br />
14.3 Construction and Testing Schedule Analysis.......................................................... 155<br />
14.3.1 Buff-2A Construction and Testing Schedule ................................................... 156<br />
14.3.2 Buff-2B Construction and Testing Schedule ................................................... 156<br />
14.3.3 Buff-2C Construction and Testing Schedule ................................................... 156<br />
14.4 Project Budget Analysis......................................................................................... 156<br />
13.4.1 Wing Budget ................................................................................................... 157<br />
13.4.2 Propulsion Budget .......................................................................................... 157<br />
13.4.3 Avionics Budget ............................................................................................. 157<br />
13.4.4 Missions Budget ............................................................................................. 158<br />
13.4.5 Travel Budget ................................................................................................. 158<br />
14.5 Specialized Facilities and Resources ...................................................................... 159<br />
14.5.1 RECUV Fabrication Lab ................................................................................. 159<br />
14.5.2 Boulder Aeromodeling Society Airfield .......................................................... 160<br />
14.5.3 AES Machine and Electronics Shop ................................................................ 160<br />
15.0 Lessons Learned ........................................................................................................ 161<br />
15.1 Manufacturing Lessons Learned ............................................................................ 161<br />
15.2 Testing Lessons Learned ....................................................................................... 161<br />
15.3 General Lessons Learned ....................................................................................... 161<br />
16.0 Acknowledgements ................................................................................................... 162<br />
iv
Project Final Report – CUDBF April 30 th , 2009<br />
ASEN 4028: <strong>Aerospace</strong> <strong>Senior</strong> <strong>Projects</strong><br />
16.1 Professional Advisors ............................................................................................ 162<br />
16.2 Graduate Advisors ................................................................................................. 162<br />
16.3 Undergraduate Assistants ....................................................................................... 162<br />
16.4 Student Assistance ................................................................................................. 162<br />
16.5 Experienced RC Advisors ...................................................................................... 162<br />
16.6 Sponsors ................................................................................................................ 162<br />
17.0 References ............................................................................................................... 163<br />
18.0 Appendix: .................................................................................................................. 165<br />
Appendix A: Mission Sensitivity Code .......................................................................... 165<br />
Appendix B: Geometry for AVL Code ......................................................................... 165<br />
Appendix C: Wing Geometry Optimization Code .......................................................... 172<br />
Appendix D: Fit in the Box Code................................................................................... 174<br />
Appendix E: Weights of Competition Aircraft ............................................................... 175<br />
Appendix F: Performance Constraint Plot ...................................................................... 176<br />
Appendix G: Stability Analysis Code ........................................................................... 177<br />
Centerline Store ......................................................................................................... 177<br />
Four Stores ................................................................................................................ 179<br />
Two Stores on same wingtip ...................................................................................... 182<br />
Appendix H: Lift Distribution Code............................................................................... 185<br />
Appendix I: Landing Gear Analysis Code ..................................................................... 186<br />
Appendix J: Wing Loading Whiffle Tree Test .............................................................. 189<br />
Appendix K: PIC Code ................................................................................................. 190<br />
v
Project Final Report – CUDBF April 30 th , 2009<br />
ASEN 4028: <strong>Aerospace</strong> <strong>Senior</strong> <strong>Projects</strong><br />
List of Figures<br />
Figure 1: Centerline Store Payload (Bottle) ......................................................................... 18<br />
Figure 2: Wing Mounted Store (Rocket) .............................................................................. 19<br />
Figure 3: Flight Mission Lap Overview ............................................................................... 20<br />
Figure 4: Flight Mission 1 Profile ........................................................................................ 20<br />
Figure 5: Flight Mission 2 Profile ........................................................................................ 21<br />
Figure 6: Flight Mission 3 Profile ........................................................................................ 22<br />
Figure 7: Project Requirement Breakdown .......................................................................... 22<br />
Figure 8: Transparent Aircraft Overview ............................................................................. 23<br />
Figure 9: Aircraft Three-View ............................................................................................. 23<br />
Figure 10: Overall Aircraft Mass Budget ............................................................................. 24<br />
Figure 11: Aircraft Electrical Schematic .............................................................................. 24<br />
Figure 12: Determining Wing Geometry ............................................................................. 32<br />
Figure 13: Moment Coefficient and Lift Coefficient as a Function of Angle of Attack ........ 33<br />
Figure 14: Drag Polars for the Top Three Airfoils ............................................................... 33<br />
Figure 15: FBD and Summary of Equations Calculating Centripetal Force on Wing Stores . 34<br />
Figure 16: Preliminary <strong>Design</strong> of Magnetic Release Mechanism ......................................... 35<br />
Figure 17: Preliminary Drawing of Tab-Spring Payload System .......................................... 36<br />
Figure 18: Preliminary Drawing of Sliding Trigger Payload System (Left: Loaded; Right:<br />
Released) ............................................................................................................................ 37<br />
Figure 19: Metallic Wrap Centerline Store Release Mechanism .......................................... 38<br />
Figure 20: Isogrid Box ........................................................................................................ 39<br />
Figure 21: Single Motor Aircraft ......................................................................................... 40<br />
Figure 22: Dual In-Line Pusher Puller Motors ..................................................................... 40<br />
Figure 23: Dual Rear Mounted Motors ................................................................................ 41<br />
Figure 24: Dual Front Mounted Motors ............................................................................... 42<br />
Figure 25: Wing Construction Method <strong>Design</strong> Options ....................................................... 43<br />
Figure 26: Wing Span Reduction <strong>Design</strong> Options ................................................................ 44<br />
Figure 27: Wing Fold Joint Location <strong>Design</strong> Options .......................................................... 45<br />
Figure 28: Landing Gear Configuration Options .................................................................. 46<br />
Figure 29: Main Gear Material Comparisons ....................................................................... 47<br />
Figure 30: Performance Constraint Plot ............................................................................... 53<br />
Figure 31: Static Thrust Stand ............................................................................................. 55<br />
Figure 32: Assembly Feasibility .......................................................................................... 57<br />
Figure 33: Aircraft Geometry .............................................................................................. 60<br />
Figure 34: The Tip Airfoil (HS520) ..................................................................................... 62<br />
Figure 35: Location of the Fold on the Wing ....................................................................... 63<br />
Figure 36: Control Surfaces on the Aircraft ......................................................................... 63<br />
Figure 37: Longitudinal Stability Modes for the Bottle on the Airplane ............................... 65<br />
Figure 38: Longitudinal Stability Modes for Four Rockets on the Airplane ......................... 66<br />
vi
Project Final Report – CUDBF April 30 th , 2009<br />
ASEN 4028: <strong>Aerospace</strong> <strong>Senior</strong> <strong>Projects</strong><br />
Figure 39: Longitudinal Stability Modes for Two Rockets on the Airplane .......................... 67<br />
Figure 40: Lateral Stability Modes for the Bottle on the Airplane ........................................ 69<br />
Figure 41: Lateral Stability Modes for Four Rockets on the Airplane ................................... 70<br />
Figure 42: Lateral Stability Modes for Two Rockets on the Airplane ................................... 71<br />
Figure 43: Velocity Magnitude around the Aircraft with the Bottle ...................................... 73<br />
Figure 44: Streamlines around the Aircraft with the Bottle .................................................. 74<br />
Figure 45: Velocity Magnitude around the Aircraft with the Rockets ................................... 74<br />
Figure 46: Streamlines around the Aircraft with the Rockets ............................................... 75<br />
Figure 47: Store Center of Gravity and Resulting Moment at Mechanism ............................ 76<br />
Figure 48: Wing Store Overview Detailing the Store Release Process ................................. 77<br />
Figure 49: Left: Store-Fixed Metal Tab; Right: Tru-Fire Trigger Assembly ......................... 78<br />
Figure 50: Isometric view of Centerline Store and Release Mechanism ............................... 79<br />
Figure 51: Box Isogrid Structure ......................................................................................... 79<br />
Figure 52: Box Drop Test Analysis Using COSMOSWorks ................................................ 80<br />
Figure 53: Neu Motor and Gearbox ..................................................................................... 81<br />
Figure 54: 14 x 7 APC-E Propeller ...................................................................................... 82<br />
Figure 55: Thin-Walled Ellipse............................................................................................ 84<br />
Figure 56: Balsa Ashby Chart .............................................................................................. 85<br />
Figure 57: Composites Ashby Chart .................................................................................... 85<br />
Figure 58: Wing Displacement Distribution ......................................................................... 87<br />
Figure 59: Von Mises Stress Distribution ............................................................................ 87<br />
Figure 60: Wingtip Hinge <strong>Design</strong> ........................................................................................ 88<br />
Figure 61: Integral Hinge .................................................................................................... 88<br />
Figure 62: Balsa Mounting Block ........................................................................................ 89<br />
Figure 63: Landing Gear Placement ..................................................................................... 90<br />
Figure 64: Longitudinal Stability ......................................................................................... 90<br />
Figure 65: Lateral Stability Angle Definition ....................................................................... 91<br />
Figure 66: Main Gear with Applied Loads .......................................................................... 92<br />
Figure 67: Beam Deflection Analysis .................................................................................. 93<br />
Figure 68: Beam Buckling Case .......................................................................................... 93<br />
Figure 69: Two View of the Landing Gear Structure ........................................................... 94<br />
Figure 70: COTS Nose Gear Assembly ............................................................................... 95<br />
Figure 71: Motor and Motor Pylon System .......................................................................... 96<br />
Figure 72: Motor Mount System Integrated into the Wing ................................................... 97<br />
Figure 73: Stress Analysis on Motor and Pylon Assembly ................................................... 98<br />
Figure 74: Maximum Stress on Motor and Pylon Assembly ................................................ 98<br />
Figure 75: Motor Pylon Strain and Deflection ..................................................................... 99<br />
Figure 76: Motor Mount Maximum Stresses ........................................................................ 99<br />
Figure 77: Propulsion Electrical Block Diagram ................................................................ 100<br />
Figure 78: Battery Pack Overview ..................................................................................... 102<br />
vii
Project Final Report – CUDBF April 30 th , 2009<br />
ASEN 4028: <strong>Aerospace</strong> <strong>Senior</strong> <strong>Projects</strong><br />
Figure 79: Speed Controller .............................................................................................. 103<br />
Figure 80: 40 Amp Fuse .................................................................................................... 104<br />
Figure 81: Overall Avionics Diagram ................................................................................ 105<br />
Figure 82: USB Development Board ................................................................................. 105<br />
Figure 83: Wiring Diagram .............................................................................................. 106<br />
Figure 84: Completed Circuit Board .................................................................................. 107<br />
Figure 85: Circuit Board Schematic................................................................................... 107<br />
Figure 86: Transmitter and Receiver.................................................................................. 108<br />
Figure 87: Capabilities of Data Recorder (Seagull Pro Telemetry System) ........................ 110<br />
Figure 88: Airfoil Selection Flow Diagram........................................................................ 112<br />
Figure 89: Wing Geometry Determination Flow Diagram ................................................. 113<br />
Figure 90: Stability Determination Flow Diagram ............................................................. 113<br />
Figure 91: Drag Calculation Flow Diagram ....................................................................... 113<br />
Figure 92: Logic to arming microcontroller ...................................................................... 114<br />
Figure 93: Flowchart for releasing payloads ..................................................................... 114<br />
Figure 94: Assembly Flow Diagram .................................................................................. 115<br />
Figure 95: Main Wing Assembly ...................................................................................... 116<br />
Figure 96: Vertical Assembly ........................................................................................... 117<br />
Figure 97: Wing Sub-Assembly ....................................................................................... 117<br />
Figure 98: Folding Wingtip Assembly .............................................................................. 118<br />
Figure 99: Nose Gear Assembly ....................................................................................... 119<br />
Figure 100: Bottom View of Right Main Landing Gear .................................................... 119<br />
Figure 101: Motor Mount Assembly................................................................................. 120<br />
Figure 102: Battery Assembly .......................................................................................... 121<br />
Figure 103: Wing Store Release Mechanism .................................................................... 122<br />
Figure 104: Centerline Store Release Mechanism ............................................................. 122<br />
Figure 105: Aircraft Assembly .......................................................................................... 123<br />
Figure 106: Interior Landing Gear and Joiner Plate Assembly ........................................... 124<br />
Figure 107: Exterior Vertical and Main Gear Assembly .................................................... 125<br />
Figure 108: Wingtip Interior Sub-Assembly ...................................................................... 126<br />
Figure 109: Main Joined Wing Assembly .......................................................................... 127<br />
Figure 110: Full System Assembly .................................................................................... 128<br />
Figure 111: Inspect of the Isogrid Box Structural Corner after Drop Test .......................... 131<br />
Figure 112: Competition Battery Packs ............................................................................. 132<br />
Figure 113: Battery Voltage and Power Over Time ........................................................... 133<br />
Figure 114: Test Wing with Mounting Apparatus Top View ............................................. 134<br />
Figure 115: Test Wing with Mounting Apparatus Root View ............................................ 134<br />
Figure 116: Whiffle Tree Final <strong>Design</strong> .............................................................................. 135<br />
Figure 117: COSMOSWorks FEM Model of Tip Displacement ........................................ 135<br />
Figure 118: Whiffle Tree During Loading ......................................................................... 136<br />
viii
Project Final Report – CUDBF April 30 th , 2009<br />
ASEN 4028: <strong>Aerospace</strong> <strong>Senior</strong> <strong>Projects</strong><br />
Figure 119: Wing Post-Failure ........................................................................................... 136<br />
Figure 120: Wing Tip and Hinge location Displacement vs. Loading Plot with FEM Model<br />
Predicted Displacement ..................................................................................................... 137<br />
Figure 121: PIC testing ..................................................................................................... 138<br />
Figure 122: Pictures of Buff-2A flight test #1 .................................................................... 139<br />
Figure 123: Nose gear failures from flight test #2 and #4 ................................................... 140<br />
Figure 124: Buff-2A motor failure during flight test #3 ..................................................... 140<br />
Figure 125: Elevator servo travel experienced on flight test #5 .......................................... 141<br />
Figure 126: Indicated airspeed versus time on flight test #6 ............................................... 142<br />
Figure 127: Actual versus predicted amp draw on flight test #6 ......................................... 143<br />
Figure 128: Competition lap flown on flight test #7 ........................................................... 144<br />
Figure 129: Flight pictures from flight test #8 .................................................................... 144<br />
Figure 130: Actual versus predicted amp draw on flight test #8 ......................................... 145<br />
Figure 131: Asymmetric loading for flight test #9.............................................................. 145<br />
Figure 132: Flight test checklist ......................................................................................... 146<br />
Figure 133: Frayed wire on NiMH battery pack ................................................................. 147<br />
Figure 134: Buff-2B airborne during flight test #12 ........................................................... 148<br />
Figure 135: Battery amp draw and voltage versus time on flight test #15 ........................... 149<br />
Figure 136: Battery power draw versus time on flight test #15 ........................................... 149<br />
Figure 137: Buff-2B carrying empty water bottle payload ................................................. 150<br />
Figure 138: Power draw for full water bottle payload flight ............................................... 151<br />
Figure 139: Buff-2C after takeoff on mission #1 at DBF competition ................................ 152<br />
Figure 140: Project Organizational Responsibilities ........................................................... 154<br />
Figure 141: Work Breakdown Structure ............................................................................ 155<br />
Figure 142: Predicted (Black) and Actual (Blue) Schedule ................................................ 156<br />
Figure 143: Project Budget Breakdown ............................................................................. 158<br />
Figure 144: Costs over Project Life Cycle ......................................................................... 159<br />
ix
Project Final Report – CUDBF April 30 th , 2009<br />
ASEN 4028: <strong>Aerospace</strong> <strong>Senior</strong> <strong>Projects</strong><br />
List of Tables<br />
Table 1: Top Level Project Requirements ............................................................................ 17<br />
Table 2: Mission Score Sensitivity Results .......................................................................... 26<br />
Table 3: Aircraft Configuration Trade Comparison ............................................................. 29<br />
Table 4: Missions to be Completed by the Aircraft .............................................................. 30<br />
Table 5: Characteristics of the Top Three Airfoils Analyzed ............................................... 34<br />
Table 6: Characteristics of Aircraft Geometry ..................................................................... 61<br />
Table 7: Longitudinal Stability for the Bottle on the Airplane.............................................. 65<br />
Table 8: Longitudinal Stability for Four Rockets on the Airplane ........................................ 67<br />
Table 9: Longitudinal Stability for Two Rockets on the Airplane ........................................ 68<br />
Table 10: Lateral Stability for the Bottle on the Airplane ..................................................... 69<br />
Table 11: Lateral Stability for Four Rockets on the Airplane ............................................... 70<br />
Table 12: Lateral Stability for Two Rockets on the Airplane ............................................... 71<br />
Table 13: Drag Prediction on the Payload Calculated by Hand and in PowerFLOW ............ 72<br />
Table 14: Predicted System Drag for Flight Missions from PowerFLOW ............................ 75<br />
Table 15: Motor Selection ................................................................................................... 80<br />
Table 16: Propeller Options ................................................................................................. 82<br />
Table 17: Wing Skin Material Comparison.......................................................................... 86<br />
Table 18: Calculating the Load on Each Strut ...................................................................... 92<br />
Table 19: Battery Options ................................................................................................. 101<br />
Table 20: NiMH Battery Selection .................................................................................... 101<br />
Table 21: Speed Controllers Options ................................................................................. 103<br />
Table 22: Determination of output from multiplexer ......................................................... 106<br />
Table 23: Servo Selection for Control Surfaces ................................................................. 109<br />
Table 24: Servo Selection for External Stores and Nose Gear ............................................ 109<br />
Table 25: Static Thrust Test Results .................................................................................. 132<br />
Table 26: Project Budget Breakdown ................................................................................ 159<br />
x
Project Final Report – CUDBF April 30 th , 2009<br />
ASEN 4028: <strong>Aerospace</strong> <strong>Senior</strong> <strong>Projects</strong><br />
List of Acronyms<br />
AD: Analog Digital<br />
AES: <strong>Aerospace</strong> <strong>Engineering</strong> <strong>Sciences</strong><br />
AGL: Above ground level<br />
AIAA: American Institute of Aeronautics and Astronautics<br />
AMA: Academy of Model Aeronautics<br />
AVL: Athena Vortex Lattice<br />
AWG: American Wire Gauge<br />
BAS: Boulder Aeromodeling Society<br />
BOTE: Back of the envelope<br />
CCP: Compare, Capture, Pulse width modulation<br />
CDR: Critical <strong>Design</strong> Review<br />
CFO: Chief Financial Officer<br />
CFRP: Carbon Fiber Reinforced Polymer<br />
CG: Center of Gravity<br />
COTS: Commercial off the shelf<br />
CUDBF: University of Colorado <strong>Design</strong>/Build/Fly<br />
DBF: <strong>Design</strong>/Build/Fly<br />
EEF: <strong>Engineering</strong> Excellence Fund<br />
EEF: <strong>Engineering</strong> Excellence Fund<br />
ENTJ: Extraversion-iNtuitive-Thinking-Judging<br />
EPS: Expanded polystyrene<br />
ESC: Electronic speed controller<br />
ESC: Electronic Speed Controller<br />
ESTJ: Extroversion-Sensing-Thinking-Judging<br />
FBD: Free Body Diagram<br />
FEM: Finite element method<br />
GFRP: Glass Fiber Reinforced Polymer<br />
GHz: Gigahertz<br />
GPS: Global Positioning System<br />
GPS: Global Positioning System<br />
INFJ: Introversion-iNtuitive-Feeling-Judging<br />
INFP: Introversion-iNtuitive-Feeling-Perceiving<br />
INTJ: Introversion-iNtuitive-Thinking-Judging<br />
ITLL: Integrated Teaching and Learning Laboratory<br />
ITLL: Integrated Teaching Learning Laboratory<br />
LBM: Lattice-Boltzmann Method<br />
LiPo: Lithium Polymer<br />
NACA: National Advisory Committee for Aeronautics<br />
NiCad: Nickel cadmium<br />
xi
Project Final Report – CUDBF April 30 th , 2009<br />
ASEN 4028: <strong>Aerospace</strong> <strong>Senior</strong> <strong>Projects</strong><br />
NiMH: Nickel metal hydride<br />
PL: Payload<br />
PRJ: Project<br />
PWM: Pulse Width Modulation<br />
RAC: Rated Aircraft Cost<br />
RC: Remote Control<br />
RECUV: Research and <strong>Engineering</strong> Center for Unmanned Vehicles<br />
RFI: Radio Frequency Interference<br />
RPM: Revolutions per Minute<br />
SCF: System Complexity Factor<br />
SYS: System<br />
TO: Takeoff<br />
TOG: Takeoff Ground Distance<br />
UAS: Unmanned aerial system<br />
UIUC: University of Illinois Urbana-Champaign<br />
USB: Universal Serial Bus<br />
VI: Visual Interface<br />
WAAS: Wide Area Augmentation System<br />
xii
Project Final Report – CUDBF April 30 th , 2009<br />
ASEN 4028: <strong>Aerospace</strong> <strong>Senior</strong> <strong>Projects</strong><br />
List of Symbols<br />
%W m : Weight Distribution Percent (Main Gear)<br />
%W n : Weight Distribution Percent (Nose Gear)<br />
A/C: Aircraft<br />
a: Semi-minor axis (Structures)<br />
Amps: Ampere<br />
AR: Aspect Ratio<br />
b: Semi-major axis (Structures)<br />
b: Span (Aerodynamics)<br />
C d0 : Coefficient of (Parasitic) Drag<br />
C L : Coefficient of Lift<br />
c root : Root Chord<br />
c tip : Tip Chord<br />
D: Drag Force<br />
E: Empty (Aerodynamics)<br />
e: Oswald Efficiency Factor<br />
E: Young’s Modulus<br />
f: Flight (Missions)<br />
ft: Feet<br />
g: Acceleration due to Gravity<br />
g: g-loading<br />
g: gram (Propulsions)<br />
I: Current (Propulsion)<br />
i: Imaginary Number<br />
in: Inch<br />
I zz : Area Moment of Inertia<br />
k: Spring Constant<br />
ksi: kilo-pounds per Square Inch<br />
L: Length of Strut<br />
L: Lift Force<br />
L: Liter<br />
L: Loading (Missions)<br />
lb: Pound Force<br />
l m : Distance between CG and Main Gear<br />
l n : Distance between CG and Nose Gear<br />
M: Moment<br />
mah: milli-Ampere-Hours<br />
mΩ: milli-Ohm<br />
n s : Number of Struts<br />
oz: Ounce<br />
xiii
Project Final Report – CUDBF April 30 th , 2009<br />
ASEN 4028: <strong>Aerospace</strong> <strong>Senior</strong> <strong>Projects</strong><br />
oz-in: ounce inch<br />
P(y): Lift Distribution<br />
P: Load Applied to Free tip of the Beam<br />
P: Power (Propulsion)<br />
P CR : Critical Applied Load<br />
P m : Main Gear Strut Loading<br />
P N : Impact Load Normal to the Runway<br />
P n : Nose Gear Strut Loading<br />
P s : Frictional Load applied due to Rolling Friction<br />
psi: Pounds per Square Inch<br />
q: Dynamic Pressure<br />
R: Radius<br />
rad: Radians<br />
Re: Reynolds Number<br />
s: Seconds<br />
S: Wing Area (Aerodynamics)<br />
sec: Seconds<br />
S TO : Takeoff Distance<br />
S TOG : Takeoff Distance<br />
S v : Winglet Area<br />
t: thickness (Structures)<br />
T: Thrust<br />
t: Time<br />
TX: Transmitter<br />
V: Shear Force (Structures)<br />
V: Velocity<br />
V: Voltage (Propulsions)<br />
V CR : Cruise Velocity<br />
W: Watts (Propulsions)<br />
W: Weight<br />
X: Span Location<br />
X cg : x CG location<br />
Y = distance along span<br />
Y cg : y CG location<br />
Z cg : z CG location<br />
α: Angle of Attack<br />
λ: Taper Ratio<br />
Λ c/4 : Quarter Chord Sweep<br />
Λ LE : Leading Edge Sweep<br />
Λ TE : Trailing Edge Sweep<br />
xiv
Project Final Report – CUDBF April 30 th , 2009<br />
ASEN 4028: <strong>Aerospace</strong> <strong>Senior</strong> <strong>Projects</strong><br />
λ v : Winglet Taper Ratio<br />
µ r : Coefficient of Friction<br />
ξ: Damping Ratio<br />
π: The Ratio of Circumference of a Circle to the Diameter<br />
ρ: Density<br />
ψ: Lateral Tip-over Angle<br />
ω n : Natural Frequency<br />
= Displacement<br />
’ = Displacement Slope<br />
xv
Project Final Report – CUDBF April 30 th , 2009<br />
ASEN 4028: <strong>Aerospace</strong> <strong>Senior</strong> <strong>Projects</strong><br />
1.0 Project Objectives and Requirements<br />
Author: Daniel Colwell<br />
1.1 Background<br />
The annual AIAA <strong>Design</strong>/Build/Fly competition, sponsored by Cessna Aircraft Company and<br />
Raytheon Missile Systems, provides the opportunity to design an unmanned aerial system<br />
(UAS). The inter-university competition also provides teams an opportunity to represent their<br />
school on the international level. The 2008-2009 competition rules require each team to design<br />
an aircraft capable of completing a simulated surveillance and attack mission. The aircraft will<br />
carry multiple payloads including a 4 liter simulated fuel tank to provide an extended endurance<br />
required for surveillance as well as 4 wing stores to model attack capabilities. Teams must also<br />
store the UAS in a lightweight, low volume container and be able to quickly assemble the<br />
aircraft to simulate a situation where time and space are limited.<br />
Dr. Brian Argrow, director of the Research and <strong>Engineering</strong> Center for Unmanned Vehicles<br />
(RECUV), has been the customer for CUDBF for the past 7 years. As a club, CUDBF has<br />
served as a means for aerospace engineering students to vertically integrate students from all<br />
levels of the curriculum to learn the design process. The CUDBF organization has improved<br />
each year and is now ready to compete for the first place position. Dr. Argrow’s main goal is for<br />
CUDBF to compete in the 2008-2009 <strong>Design</strong>/Build/Fly Competition, learn the practical concepts<br />
of aircraft design, and integrate underclassmen in order to ensure the future success and survival<br />
of the program.<br />
1.2 Project Goal<br />
The goal of CUDBF is to compete in the annual AIAA <strong>Design</strong>/Build/ Fly Competition and<br />
increase the potential for success for future teams. The team will achieve this goal by following<br />
all rules [1] assigned by the DBF director to pass technical inspection in competition. The team’s<br />
aircraft will be capable of completing all flight missions. Finally, the team will ensure future<br />
success by vertically integrating underclassmen into the design and fabrication process.<br />
1.3 Project Objectives<br />
The objective of this project is to design, build, test, and verify a remotely controlled aircraft<br />
capable of entering into the <strong>Design</strong>/Build/Fly competition. To accomplish this objective, the<br />
aircraft will be a fixed wing design with performance characteristics capable of completing all of<br />
the competition flight missions with a minimum range of 9,200 feet. The aircraft shall be able to<br />
accommodate all mission payloads, including the ability to detach each store independently and<br />
in any order. Deconstructed, the aircraft shall be able to be stored in at most two 4’x 2’x 2’<br />
boxes and weigh no more than 55 pounds. The aircraft shall be capable of achieving a maximum<br />
take-off distance of 100 feet with an electric propulsion system powered by either NiMH or<br />
16
Project Final Report – CUDBF April 30 th , 2009<br />
ASEN 4028: <strong>Aerospace</strong> <strong>Senior</strong> <strong>Projects</strong><br />
NiCad battery cells. Finally, a competition requirement of at least 4 underclassmen will be<br />
involved in the aircraft design process. Table 1 below shows a tabulated form of these top level<br />
project requirements.<br />
Table 1: Top Level Project Requirements<br />
Requirement Description Parent<br />
Requirement<br />
0.PRJ.1 The aircraft shall be designed to pass technical inspection by fulfilling<br />
<strong>Design</strong>/Build/Fly rules<br />
Customer<br />
0.PRJ.2 All payloads shall be integrated into the aircraft Customer<br />
0.PRJ.3 A mechanism shall be designed to release store payloads individually Customer<br />
0.PRJ.4 The aircraft shall fit disassembled into at most 2 containers no bigger Customer<br />
than 2’x2’x4’<br />
0.PRJ.5 The aircraft shall weigh no more than 55 lb AMA<br />
0.PRJ.6 The aircraft shall have a minimum range of 9,200 feet Customer<br />
0.PRJ.7 The CUDBF team will incorporate at least 4 underclassmen in design<br />
activities<br />
Customer<br />
Objectives also include learning how to effectively interact and communicate with a team in<br />
order to achieve a common goal. Students will also learn about engineering design processes<br />
and manufacturing while also stressing systems integration between subsystems. These lessons<br />
learned during this project will provide valuable experience upon entering industry.<br />
17
Project Final Report – CUDBF April 30 th , 2009<br />
ASEN 4028: <strong>Aerospace</strong> <strong>Senior</strong> <strong>Projects</strong><br />
2.0 System Architecture<br />
Author: Eric Hall<br />
Co-Author: Dan Colwell<br />
2.1 Overview of Systems<br />
The CUDBF aircraft will be a high performance aircraft capable of completing all competition<br />
missions in an optimized manner. In order to close the design envelope, the overall system and<br />
subsystems will approach each design with an iterative process attempting to design a system<br />
with higher efficiency.<br />
The competition requires two payloads to be flown in three separate flights. Each payload must<br />
be capable of being remotely released from the aircraft from the pilot’s transmitter. The first two<br />
mission flights require a 4 liter water bottle to be flown in configurations where the bottle is<br />
either flown empty or filled with water. The specific bottle is McMaster-Carr part 4322T6 and<br />
weighs 0.75 pounds empty. Filled with water, the total payload weight is 9.05 pounds. The<br />
bottle dimensions are 5.875 inches diameter and 11.25 inches length. The bottle can be observed<br />
below in Figure 1 [2] .<br />
Figure 1: Centerline Store Payload (Bottle)<br />
The payloads required for the third flight mission are four wing-mounted rockets. The specific<br />
rockets are Estes Patriot Rockets #2056. Each rocket is 21 inches in length and must be ballasted<br />
to 1.5 pounds. Two rockets must be on each wing half with the inboard rocket 24 inches from<br />
aircraft centerline and outboard rocket 30 inches from centerline. An Estes Patriot Rocket can be<br />
observed in Figure 2 [3] .<br />
18
Project Final Report – CUDBF April 30 th , 2009<br />
ASEN 4028: <strong>Aerospace</strong> <strong>Senior</strong> <strong>Projects</strong><br />
Figure 2: Wing Mounted Store (Rocket)<br />
Before the aircraft can be flown at competition, officials from DBF will conduct a complete<br />
technical inspection of the aircraft to ensure the aircraft meets the design requirements and is<br />
safe to fly. The aircraft, transmitter, and all payloads will be loaded into the team’s boxes. The<br />
boxes will be measured to ensure that the maximum dimensions of the box are 2’x2’x4’ and then<br />
weighed. This weight becomes the rated aircraft cost (RAC) as seen in Equation 1.<br />
= + + + <br />
Equation 1: Rated Aircraft Cost<br />
The battery packs of the propulsion system will be weighed to ensure that no pack weighs more<br />
than 4 pounds and then will be visually inspected to verify that either NiMH or NiCad battery<br />
cells are being used. The propulsion electronic lines will be inspected to verify a 40-amp rated<br />
fuse is installed between the battery packs and the motors. The aircraft will then be loaded with<br />
the heaviest payload (full bottle) and will be lifted by the wingtips to ensure structural stability.<br />
The transmitter and receiver system will be activated on the aircraft to properly show adequate<br />
control of the aircraft’s control surfaces. Then the transmitter will be deactivated to show proper<br />
fail-safe procedure of the aircraft. The required fail-safe protocol is zero throttle, up elevator,<br />
right rudder, and right aileron.<br />
2.2 Competition Missions Concept of Operations<br />
The concept of operations consists of a ground assembly mission and three flight missions. The<br />
ground assembly mission must be completed before any flight missions can be attempted.<br />
During flight missions, the aircraft must adhere to the flight plan shown in Figure 3. The aircraft<br />
will take off from the starting line in under 100 feet, fly 500 feet downwind and make a 180<br />
degree turn. The upwind leg of the flight must be at least 1,000 feet and have a 360 degree loop<br />
before turning downwind back towards the starting line.<br />
19
Project Final Report – CUDBF April 30 th , 2009<br />
ASEN 4028: <strong>Aerospace</strong> <strong>Senior</strong> <strong>Projects</strong><br />
Figure 3: Flight Mission Lap Overview<br />
2.2.1 Ground Mission: Assembly<br />
The ground mission begins with the aircraft, payloads, and transmitter fully restrained in the box.<br />
The box will be rotated on all sides to demonstrate restraint contents and will then be dropped<br />
from a height of 6 inches to show structural integrity. The team will then be timed on<br />
transitioning the stored aircraft to flight readiness with all payloads. The timed assembly factors<br />
into the Safety Complexity Factor (SCF) in Equation 2 below.<br />
=<br />
<br />
<br />
Equation 2: Ground Mission Score<br />
2.2.2 Flight Mission 1: Ferry Flight<br />
The ferry flight begins with the aircraft placed on the runway with the empty centerline store<br />
attached. The aircraft will take-off, fly two laps, and land. This mission profile can be observed<br />
in Figure 4 below.<br />
Figure 4: Flight Mission 1 Profile<br />
The total flight time of the aircraft will be recorded and factored into the mission score. The<br />
time begins when the aircraft throttles up for take-off and ends when the aircraft passes over the<br />
starting line in the air. The mission score can be observed in Equation 3.<br />
20
Project Final Report – CUDBF April 30 th , 2009<br />
ASEN 4028: <strong>Aerospace</strong> <strong>Senior</strong> <strong>Projects</strong><br />
1 =<br />
<br />
<br />
Equation 3: Flight Mission 1 Score<br />
2.2.3 Flight Mission 2: Surveillance Flight<br />
The surveillance flight begins with the aircraft placed on the runway with the full centerline store<br />
attached. The aircraft will take-off, fly four laps, and land. The mission profile can be seen<br />
below in Figure 5.<br />
Figure 5: Flight Mission 2 Profile<br />
The mission score for this flight is equal only to the aircraft SCF. Equation 4 below shows the<br />
flight mission score.<br />
2 = <br />
Equation 4: Flight Mission 2 Score<br />
2.2.4 Flight Mission 3: Store Release/Asymmetric Loads<br />
The store release flight begins with the aircraft on the runway with no payload attached and the<br />
rocket stores in the box. The time required to load the rocket stores to the aircraft will be used<br />
within the flight mission score. This relation can be seen in Equation 5 below.<br />
3 =<br />
<br />
<br />
Equation 5: Flight Mission 3 Score<br />
The aircraft will take-off; fly one lap, then land. On the ground, the aircraft will taxi to a<br />
specified area and drop a store specified by the DBF officials. The aircraft will again take-off<br />
and repeat this process, finishing the mission by landing successfully after the fourth lap. This<br />
mission profile can be observed in Figure 6.<br />
21
Project Final Report – CUDBF April 30 th , 2009<br />
ASEN 4028: <strong>Aerospace</strong> <strong>Senior</strong> <strong>Projects</strong><br />
Figure 6: Flight Mission 3 Profile<br />
2.3 Mechanical and Electrical <strong>Design</strong> Requirements<br />
The flow-down of requirements within the project have been delegated between the five primary<br />
sub-teams. Based on the needs of the project the primary sub-teams selected have been<br />
aerodynamics, propulsion, structures, missions, and avionics. Figure 7 below schematically<br />
illustrates the major requirements to be fulfilled by each sub-team. These requirements will be<br />
highlighted in detail in each subsystem’s design-to specifications.<br />
Figure 7: Project Requirement Breakdown<br />
2.4 Overall System<br />
2.4.1 Solid Model and Mass Breakdown<br />
The overall design of the CUDBF aircraft can be observed in Figure 8 and Figure 9 below.<br />
Figure 8 shows the aircraft transparent view in order to clearly show each subsystem and<br />
component integration and placement in the aircraft. Figure 9 below shows a classic three-view<br />
of the CUDBF aircraft with important dimensions highlighted. The integration and installation<br />
of each component will be highlighted later in this report.<br />
22
Project Final Report – CUDBF April 30 th , 2009<br />
ASEN 4028: <strong>Aerospace</strong> <strong>Senior</strong> <strong>Projects</strong><br />
Figure 8: Transparent Aircraft Overview<br />
Figure 9: Aircraft Three-View<br />
The overall breakdown of the weights of the aircraft has been divided into individual<br />
subsystems. The total weight of the aircraft was 7.5 lbs. A visual weight breakdown can be<br />
observed in Figure 10.<br />
23
Project Final Report – CUDBF April 30 th , 2009<br />
ASEN 4028: <strong>Aerospace</strong> <strong>Senior</strong> <strong>Projects</strong><br />
Propulsion,<br />
2.025<br />
Aircraft,<br />
4.225<br />
Missions,<br />
0.65<br />
Avionics, 0.6<br />
Figure 10: Overall Aircraft Mass Budget<br />
2.4.2 Electrical System Schematics<br />
For competition flights, the aircraft electrical system is comprised primarily of the transmitter,<br />
receiver, microcontroller, and propulsion system. During test flights, a telemetry system will<br />
also be integrated in order to gather data. The transmitter will be controlled by the pilot at all<br />
times and will communicate with the receiver onboard the aircraft. The receiver, powered by a<br />
devoted receiver battery, powers and controls all onboard servos. A microcontroller on the<br />
aircraft controls the payload release servos. A devoted propulsion battery will control the power<br />
to the propulsion motors. When integrated, the telemetry system will be powered by the receiver<br />
battery.<br />
Figure 11: Aircraft Electrical Schematic<br />
24
Project Final Report – CUDBF April 30 th , 2009<br />
ASEN 4028: <strong>Aerospace</strong> <strong>Senior</strong> <strong>Projects</strong><br />
3.0 Development and Assessment of System <strong>Design</strong> Alternatives<br />
Author: Shivali Bidaiah<br />
Co-Author: Ben Kemper<br />
3.1 Mission Sensitivity Analysis<br />
In this design problem, an aircraft configuration had to be chosen to accomplish the mission<br />
goals and objectives. The missions and the scoring for each mission are described in the Concept<br />
of Operations, Section 2.2. A mission score sensitivity analysis was performed for each flight<br />
mission to determine the factors needed to weigh the system alternatives. This can be found in<br />
Table 2. The sensitivity parameters were the assembly time, load time, system weight and flight<br />
time.<br />
The assembly time is the time required to assemble the aircraft from the box to a flight ready<br />
state. This factor can vary based on the type of aircraft configuration chosen. The assembly time<br />
involves opening the storage container, removing the aircraft, stores, transmitter, and any<br />
required tools, assembling the aircraft, attaching the stores, returning any used tools to the<br />
container, and closing the container.<br />
The load time is the time required to load the payloads onto the aircraft i.e. time to load each of<br />
the four wing stores and centerline store. This time is independent of the aircraft configuration<br />
since the time required to load the payload onto the aircraft is dependent on the ground crew. As<br />
a result, this was not included as a factor in determining the aircraft configuration.<br />
The system weight is the combined weight of all stores, the aircraft, transmitter, containers, and<br />
assembly tools. System weight depends on the aircraft configuration, so it was considered to<br />
select the aircraft configuration. The aircraft flight time is the time for the aircraft to complete<br />
two laps. This is not included in the aircraft configuration choice. This is because the aircraft is<br />
required to meet a certain flight speed and therefore a flight time independent of configuration.<br />
The flight time is built into the performance sizing of the aircraft.<br />
From the four sensitivity parameters and the accompanying equations based on competition<br />
score, a set of four partial derivatives were created, one from each parameter. By combining the<br />
score weighting of each mission, an equation for the total flight score was created (Equation 6).<br />
A maximum mission score was assigned to each mission. The scores were 50, 75, and 100 for<br />
missions 1, 2, and 3 respectively. This is how performance at competition will be weighted. The<br />
total flight score will consist of the sum of the three individual flight scores.<br />
Equation 6: Total Flight Score<br />
25
Project Final Report – CUDBF April 30 th , 2009<br />
ASEN 4028: <strong>Aerospace</strong> <strong>Senior</strong> <strong>Projects</strong><br />
From this equation, it was possible to determine a parameter’s influence on the total flight score<br />
by creating nominal values for each of the parameters and taking the partial derivative with<br />
respect to that particular design parameter. These nominal values are based on heuristics and are<br />
listed as follows:<br />
• 6 lb aircraft<br />
• 10 lb container<br />
• 2 lb transmitter<br />
• 14 lb payload<br />
• 10 sec load time<br />
• 30 sec assembly time<br />
• 120 sec flight time<br />
An example of this partial derivative of the flight score with respect to aircraft weight is shown<br />
in the following equation.<br />
Equation 7: Partial Derivative of the Flight Score with Respect to Aircraft Weight<br />
It was determined from the mission score sensitivity analysis that the assembly time of the<br />
aircraft was most sensitive to the overall score, followed by the load time, the aircraft weight and<br />
lastly the flight time. The results of the analysis can be seen in Table 2, and allowed the design<br />
to focus on maximizing the factors that most affect total overall score.<br />
Table 2: Mission Score Sensitivity Results<br />
Parameter Assembly Time Load Time Aircraft Weight Flight Time<br />
Percent Change -7.50 % -3.67 % -1.88 % -0.0488 %<br />
Order of Importance 1 st 2 nd 3 rd 4 th<br />
It is important to note that the drag of the aircraft was not counted for as a separate factor simply<br />
because the aircraft drag and weight are so closely related. More drag implies more thrust is<br />
needed for the aircraft to complete its mission. More thrust entails more batteries which in turn<br />
increase the overall system weight.<br />
26
Project Final Report – CUDBF April 30 th , 2009<br />
ASEN 4028: <strong>Aerospace</strong> <strong>Senior</strong> <strong>Projects</strong><br />
3.2 Aircraft Configuration<br />
For this mission, the payload cannot be contained within the airplane. Because of this all<br />
configurations that have a fuselage were not considered as possible design solutions simply<br />
because a fuselage is unneeded and unused weight and space. Additionally, configurations that<br />
have multi-wing designs were eliminated since they add weight and are unnecessary for this<br />
mission. Possible design alternatives were thus narrowed down to three configurations: flying<br />
wing, conventional without a fuselage, and canard without a fuselage. The canard and<br />
conventional designs without a fuselage indicate that a boom replaces the fuselage which<br />
connect the nose and tail sections.<br />
3.2.1 (System Option #1) Flying Wing<br />
Pros: The absence of a tail provides a lighter airframe than other configurations. The lack of<br />
excess control surfaces creates less drag. Due to the absence of a tail, the aircraft is<br />
easier to compact and requires less pieces to construct (increases ground mission score).<br />
Cons: A large effort must be put into the aerodynamic design in order to make this aircraft stable.<br />
Longitudinally, the aircraft can easily become unstable. Although some sources exist,<br />
less literature is available on designing a flying wing aircraft.<br />
3.2.2 (System Option #2) Canard<br />
Pros: The canard surface at the front of the aircraft provides positive lift, decreasing the lift<br />
required by the wing. The canard increases lifting efficiency as opposed to decreasing.<br />
The presence of a canard decreases the time required to design the aircraft to be<br />
longitudinally stable.<br />
Cons: The canard construction increases the weight of the aircraft. This added weight makes the<br />
canard’s wing slightly bigger than the flying wing. The canard surface creates more<br />
pieces for the aircraft assembly time.<br />
3.2.3 (System Option #3) Conventional<br />
Pros: The conventional aircraft requires the least amount of design time and experience to<br />
design. The tail provides longitudinal stability.<br />
Cons: The tail introduces two negative factors: weight and negative lift. The excess weight from<br />
the tail requires a bigger wing to compensate; increasing the weight. The tail’s negative<br />
lift also increases the size of the wing. This leads to decreased efficiency compared to<br />
the other designs. The tail creates more pieces for the aircraft assembly time.<br />
3.3 Comparison of System Options<br />
To increase the project’s overall competition score, the aircraft must be lightweight, have low<br />
drag, and be assembled from the aircraft container as quickly as possible. The aircraft’s weight<br />
and wing area were estimated and aspect ratios were used to determine the drag effects on the<br />
27
Project Final Report – CUDBF April 30 th , 2009<br />
ASEN 4028: <strong>Aerospace</strong> <strong>Senior</strong> <strong>Projects</strong><br />
aircraft. Finally the assembly time was estimated based on the numbers of steps required for<br />
assembly.<br />
The comparison between aircraft configurations began by defining the effects the additional<br />
surfaces have on the aircraft. The lift required by the wing and tail must equal the weight of the<br />
aircraft. The tail lift force from similar sized DBF aircraft is approximately 0.73 pounds 4 . For<br />
the canard, the surface provides positive lift while the conventional tail provides negative lift.<br />
The weight of the aircraft was estimated using 6 pounds for wing and avionics weight, 8 pounds<br />
for payload weight and 0.75 pounds for tail boom construction weight. The wing area was<br />
calculated by the lift required by the wing. Since the canard and conventional both required<br />
bigger wing areas than the flying wing and because the flying wing’s weight was only wing<br />
weight (no tail), it was decided that the canard and conventional aircraft weights needed to be<br />
increased. The weights of these configurations were increased and new wing areas were<br />
computed. This process was iterated until the weights and wing surface areas converged.<br />
Based on a minimum wing span of 5 feet, the aspect ratio was calculated. The aspect ratio is<br />
inversely proportional to the aircraft’s drag. Therefore, the flying wing and canard were both<br />
predicted to have similar drag characteristics while the conventional has the most drag.<br />
The assembly time of the aircraft was determined from the number of motions required to move<br />
the aircraft from the aircraft container to a flight ready condition. Since each aircraft must have a<br />
minimum wing span of 5 feet and the maximum box dimension is 4 feet, the wing cannot be a<br />
single piece. Three options are present: two separate wing halves joined by a spar, two wing<br />
halves folded by a hinge on the centerline, or folding wingtips. The folding wingtip design<br />
presents the best option due to the importance of the structural integrity of the aircraft’s center.<br />
Each configuration must have the folding wing tips, but the canard and conventional also have<br />
the large tail structure. This would also require some sort of attachment or folding mechanism.<br />
Additionally, servo connections to the control surfaces would introduce complexity which would<br />
increase the assembly time. The canard and conventional would therefore have similar assembly<br />
times, while the flying wing would have a lower assembly time due to its absence of a tail.<br />
The initial calculations performed for this design selection showed that the flying wing was the<br />
best suited configuration to optimize the overall competition score as seen in Table 3.<br />
.<br />
28
Project Final Report – CUDBF April 30 th , 2009<br />
ASEN 4028: <strong>Aerospace</strong> <strong>Senior</strong> <strong>Projects</strong><br />
Table 3: Aircraft Configuration Trade Comparison<br />
Factor<br />
Factor<br />
Weight<br />
Flying Wing Canard Conventional<br />
Illustration<br />
Aircraft<br />
Weight<br />
Assembly<br />
Time<br />
20% 10 (15 lb) 9.49 (15.8 lb) 9.03 (16.6 lb)<br />
80% 10 (2 Joints) 6.67 (3 Joints) 6.67 (3 Joints)<br />
Final Score 100% 10 7.24 7.14<br />
Once the flying wing was selected, much concern was expressed in the inherent instability<br />
associated with the design of such an aircraft. Much analysis and design must be placed into this<br />
aircraft such that it is controllable in flight. However, this concern was mitigated with extensive<br />
analysis outlined in the following sections of this report.<br />
29
Project Final Report – CUDBF April 30 th , 2009<br />
ASEN 4028: <strong>Aerospace</strong> <strong>Senior</strong> <strong>Projects</strong><br />
4.0 System <strong>Design</strong>-To Specifications<br />
Author: Jarryd Allison<br />
Co-Author: Ben Kemper<br />
4.1 Aerodynamics <strong>Design</strong>-To Specifications<br />
The aerodynamics subsystem was delegated the responsibility of the initial configuration of the<br />
aircraft. The Buff-2 Bomber was designed to be a fixed wing aircraft that could also be folded in<br />
order to fit within the 2ft x 2ft x 4ft storage containers. A flying wing was selected due to its<br />
small number of surface extremities (limited to 2 wings) that can be folded and deployed<br />
quickly. The aerodynamics team also selected the configuration that would meet the maximum<br />
100 ft takeoff requirement while still being able to carry all wing stores along with the external<br />
bottle/tank full of water. The subsystem also worked on reducing the overall weight of the plane,<br />
which favors the lightweight design of the flying wing. These requirements dictated the main<br />
tasks of the aerodynamics subsystem throughout the design process.<br />
4.2 Missions <strong>Design</strong>-To Specifications<br />
The Missions subsystem was then tasked with meeting the system requirements relative to<br />
holding the wing mounted and centerline stores along with storing the aircraft in the container.<br />
The aircraft must be able to fly three missions completely, seen below in Table 4.<br />
Table 4: Missions to be Completed by the Aircraft<br />
Mission Mission Specifications Scoring<br />
1 Empty 4L tank, 2 laps Equation 3<br />
2 Full 4L tank, 4 laps Equation 4<br />
3 Timed rocket loading, four laps, drop store<br />
at completion of each lap<br />
Equation 5<br />
The importance of the aircraft being quickly deployable with mounted stores that can easily<br />
attach to the aircraft must be stressed, as assembly time plays a role in each mission score<br />
calculation. In order to be successful, the aircraft must complete each mission with no stores<br />
being released while airborne. This presents quite a design problem for the Missions<br />
subsystems. Each store must release on command, yet must not fall off during flight. Free-play<br />
must also be minimized so as to not affect the aircraft performance.<br />
30
Project Final Report – CUDBF April 30 th , 2009<br />
ASEN 4028: <strong>Aerospace</strong> <strong>Senior</strong> <strong>Projects</strong><br />
5.0 Development and Assessment of Subsystem <strong>Design</strong> Alternatives<br />
Author: Ross DeFranco<br />
Co-Author: Mark Findley<br />
5.1 Aerodynamics Subsystem <strong>Design</strong> Alternatives<br />
5.1.1 Aircraft Geometry<br />
The only known variable in terms of aircraft geometry was the wingspan, which was determined<br />
by payload placement requirements to be no less than 5ft. The aircraft geometry affects the<br />
stability of the aircraft, and therefore, the best sweep and taper were chosen. Additionally, the<br />
geometry of the aircraft was also driven by the requirement to fit in a 2ft x 2ft x 4ft box.<br />
Athena Vortex Lattice (AVL) [5] was used in conjunction with MATLAB [6] and the program<br />
AutoIT [7] to generate different geometry configurations, outlined further in Section 10.1. The<br />
static margin for every combination of leading edge sweep angle (between 0 and 25 degrees) and<br />
taper ratio (between 0 and 1.0) was analyzed in increments of 5 degrees and 0.1, respectively.<br />
MATLAB was used to generate geometry files compatible with AVL for every combination.<br />
This analysis helped narrow the selection of the optimal sweep angle and taper ratio. The code<br />
used to perform this analysis can be observed in Appendices B and C.<br />
This analysis was not performed separately for the quarter chord sweep angle and trailing edge<br />
sweep angle since they are dependent on the leading edge sweep angle. Figure 12 shows the<br />
variation in leading edge sweep angle and taper ratio as a function of static margin.<br />
Figure 12 indicates that sweep angles between 0 and 15 degrees produce a negative static margin<br />
for every possible taper ratio. A negative static margin indicates that the C.G. of the aircraft is aft<br />
of the aerodynamic center. As static margin increases, the responsiveness of the aircraft to pilot<br />
input decreases, but, longitudinal static stability increases. So, a negative static margin refers to<br />
poor longitudinal static stability, which is undesirable for a flying wing configuration since<br />
flying wings are inherently unstable.<br />
31
Project Final Report – CUDBF April 30 th , 2009<br />
ASEN 4028: <strong>Aerospace</strong> <strong>Senior</strong> <strong>Projects</strong><br />
Static Margin<br />
0.2<br />
0.15<br />
0.1<br />
0.05<br />
0<br />
-0.05<br />
-0.1<br />
-0.15<br />
Static Margin as a function of Taper Ratio and Sweep Angle<br />
Sweep Angle of 25 o<br />
Sweep Angle of 20 o<br />
Sweep Angle of 15 o<br />
Sweep Angle of 10 o<br />
Sweep Angle of 5 o<br />
-0.2 Sweep Angle of 0 o<br />
-0.25<br />
-0.3<br />
1 2 3 4 5 6 7 8 9 10<br />
Taper Ratio * 10 -1<br />
Figure 12: Determining Wing Geometry<br />
The leading edge sweep angle was narrowed down to between 15 degrees and 25 degrees such<br />
that a positive static margin was assured. The choice of configuration is discussed in the<br />
Mechanical <strong>Design</strong> Elements section for aerodynamics.<br />
5.1.2 Airfoil Selection<br />
In order to choose the best suited airfoil for a flying wing configuration, several hundred airfoils<br />
on the UIUC database as well as the DBF Osborne databases were analyzed. All the airfoils<br />
were plotted in the airfoil analysis tool XFOIL [8] . The three best airfoils were chosen based on<br />
their drag polars and variance in coefficient of moment with angle of attack. The main driver for<br />
the airfoil selection was the coefficient of moment as a function of angle of attack. Since the<br />
configuration chosen for this aircraft is a flying wing design, the longitudinal static stability of<br />
the aircraft is very important. Flying wings have the tendency to be unstable in pitch; therefore,<br />
selecting an airfoil with optimal lift characteristics as well as a coefficient of moment very close<br />
to zero was extremely important.<br />
The variation in moment coefficient with angle of attack and the variation of the lift coefficient<br />
with angle of attack for the three best airfoils are shown in Figure 13. The top three airfoils<br />
shown are the HS520, Eppler216 and the HS602.<br />
32
Project Final Report – CUDBF April 30 th , 2009<br />
ASEN 4028: <strong>Aerospace</strong> <strong>Senior</strong> <strong>Projects</strong><br />
Moment Coefficient and Lift Coefficient as a Function of Angle of Attack<br />
2<br />
Re: 844,493<br />
Mach: .0912<br />
Moment Coefficient and Lift Coefficient<br />
C m<br />
and C l<br />
, non-dimensional<br />
1.5<br />
1<br />
0.5<br />
0<br />
hs520<br />
e216<br />
hs602<br />
-0.5<br />
-5 0 5 10 15 20<br />
Angle of Attack, α, degrees<br />
Figure 13: Moment Coefficient and Lift Coefficient as a Function of Angle of Attack<br />
Figure 14 shows the drag polars of the top three airfoils. The HS520 and HS602 have very<br />
similar drag polars. The eppler216 airfoil has a greater increase in drag for the most increase in<br />
lift. Table 5 summarizes the airfoil characteristics of the top three airfoils.<br />
2<br />
Re: 844,493<br />
Mach: .0912<br />
Drag Polar<br />
Coefficient of Lift, C l<br />
, non-dimensional<br />
1.5<br />
1<br />
0.5<br />
0<br />
hs520<br />
e216<br />
hs602<br />
-0.5<br />
0 0.01 0.02 0.03 0.04 0.05 0.06 0.07 0.08 0.09 0.1<br />
Coefficient of Drag, C d<br />
, non-dimensional<br />
Figure 14: Drag Polars for the Top Three Airfoils<br />
33
Project Final Report – CUDBF April 30 th , 2009<br />
ASEN 4028: <strong>Aerospace</strong> <strong>Senior</strong> <strong>Projects</strong><br />
Table 5: Characteristics of the Top Three Airfoils Analyzed<br />
Airfoil % t/c C l max C d (at Cl mx) C m (at cruise) Stall AOA (deg)<br />
Eppler216 10.40 1.78 0.0446 -0.1925 13.27<br />
HS520 8.84 1.42 0.0306 -0.0059 13.70<br />
HS602 10.21 1.38 0.0339 -0.101 12.60<br />
5.2 Missions Subsystem <strong>Design</strong> Alternatives<br />
The design alternatives for the Missions subsystem was broken into three separate elements: the<br />
wing mounted stores, the centerline store, and the aircraft container. Each of these were vital to<br />
the mission of the aircraft and its performance at competition. The design process included a<br />
complete understanding of the score sensitivities and the importance of store load times, an<br />
analysis of the loads acting on these stores, consideration of multiple design alternatives, testing<br />
of those alternatives, an educated selection based on the test results, and finally a successful<br />
implementation of the design choice. Based on established requirements, it was imperative the<br />
stores load quickly, release reliably, and do not release in flight.<br />
5.2.1 Wing Store Release Mechanism<br />
From the sensitivity analysis, the loading of these stores has a large effect on the aircraft’s score<br />
at competition. This loading time factors into both the System Complexity Factor score of the<br />
aircraft through its effect on assembly time, and wing store loading time is measured directly for<br />
the score in Mission 3 (the heaviest weighted mission). It was therefore important that the<br />
release mechanisms for these stores have the ability to load quickly, and this is a key design<br />
driver. It was also important the store release on the ground and not while in flight. To this end,<br />
the release mechanism must release 95% of the time while being able to constrain the store under<br />
flight conditions and loads. These flight conditions include a 3 g force in the aircraft’s Z-axis<br />
and a 1.73 g lateral force. These design-to loads were determined from Figure 15.<br />
Figure 15: FBD and Summary of Equations Calculating Centripetal Force on Wing Stores<br />
34
Project Final Report – CUDBF April 30 th , 2009<br />
ASEN 4028: <strong>Aerospace</strong> <strong>Senior</strong> <strong>Projects</strong><br />
This was important information for the brainstorming phase when several conceivable ideas for<br />
releasing the stores were generated. These included a sliding pin design, a tab-spring design, a<br />
magnetic design, a rotating platform design, and a sliding trigger design. The sensitivity analysis<br />
was applied, and the pin and rotating platform designs were eliminated because of their projected<br />
high load times. The magnetic, spring-tab, and sliding trigger designs were found to be the two<br />
best designs because they could be loaded the fastest and both stood a high probability of success<br />
of being able to keep the store secure.<br />
5.2.1.1 Magnetic <strong>Design</strong><br />
The concept of using magnets to attach the store had several drivers. The first and largest is that<br />
this design had the potential for putting a large amount of the release mechanism weight into the<br />
store itself. The store must weigh 1.5 lbs. Therefore, much of the release mechanism could be<br />
directly integrated into the store itself (rather than into the aircraft). With the magnetic system,<br />
this works well as the magnets are the heaviest portion of this release mechanism and will be<br />
mounted to the store. Another advantage of this system is that competition rules stipulate that<br />
the release mechanism have no moving parts within the store. Magnets are an effective solution<br />
for this because they are solid state. A concept of this can be observed in Figure 16.<br />
Figure 16: Preliminary <strong>Design</strong> of Magnetic Release Mechanism<br />
Another driver was the amount of free play present in the release mechanism. Free-play would<br />
be disastrous to the stability of the aircraft as additional forces and vibrations in flight would<br />
affect all other systems. It was predicted that the magnetic design had the potential of keeping<br />
the store rigidly attached in all directions. The magnetic attraction to the underside of the wing<br />
keeps the store restrained in the aircraft’s Z direction. Because magnetic attraction is<br />
significantly weaker in the shear direction, restraining tabs will be placed on the underside of the<br />
wing that keeps the store from sliding off by restraining it in the X and Y directions.<br />
5.2.1.2 Tab-Spring Payload <strong>Design</strong><br />
The tab-spring payload release mechanism was designed in order to deploy two rockets using<br />
one servo while still allowing fast loading. In order to decrease load time, it was decided that a<br />
spring system would need to restore a beveled aluminum strip. Therefore, the pin could retract<br />
35
Project Final Report – CUDBF April 30 th , 2009<br />
ASEN 4028: <strong>Aerospace</strong> <strong>Senior</strong> <strong>Projects</strong><br />
from the insertion of the rocket and restrain itself automatically. In order to release two stores<br />
from one servo, it was determined that one servo would control two pins by string. This would<br />
allow the servo to retract one pin which is experiencing the tension but the other pin would<br />
remain stationary since no load is applied through compression. The servo actuator would need<br />
to produce a torque equal to the spring constant times the gap width multiplied by the length of<br />
the servo arm. A concept of this can be observed in Figure 17.<br />
Figure 17: Preliminary Drawing of Tab-Spring Payload System<br />
5.2.1.3 Sliding Trigger <strong>Design</strong><br />
The sliding trigger design is based off of the coordinated movement of two pins to load and<br />
release the store. A tab with a hole is rigidly fixed to the store. To secure the store to the<br />
aircraft, this store-fixed tab is inserted into the bottom of the aircraft. As it slides in, it pushes<br />
against the rotating pin arm (seen in the figure below) which in turn rotates the release pin.<br />
Further insertion causes the rotating pin to rotate until it is perpendicular to the vertical store tab.<br />
At this moment, a spring will force the release pin back into its original position. This will<br />
prevent the rotating pin from coming back to its original position and the store will remain<br />
secured to the underside of the aircraft. To release the store, a servo actuator pulls the release pin<br />
out of its locked position and the weight of the store causes the rotating pin to rotate to its<br />
original position and release the store. A concept of this option can be seen in Figure 18.<br />
36
Project Final Report – CUDBF April 30 th , 2009<br />
ASEN 4028: <strong>Aerospace</strong> <strong>Senior</strong> <strong>Projects</strong><br />
Figure 18: Preliminary Drawing of Sliding Trigger Payload System (Left: Loaded; Right: Released)<br />
This design has the potential to hold a great deal of weight due to the manner in which these pins<br />
are aligned. It is therefore considered to be very reliable in both securing the store to the aircraft<br />
and releasing it on cue. Without fixed guides to easily maneuver the store into proper alignment<br />
into the system, load time is projected to be slightly higher. This mechanism will also require<br />
tight manufacturing tolerances. However because of both its reliability and projected quick load<br />
times, this design was selected for the final design.<br />
5.2.2 Centerline Store<br />
The expectations for the wing mounted store also apply to the centerline store. The design for<br />
this store must be able to support the larger load of the filled wattle bottle at 9 lbs. Load time<br />
remains a major design driver. Multiple designs were considered and three alternatives made the<br />
final analysis. These designs involve support on both sides of the water bottle for security and<br />
reduction of free-play. The first two designs involve the tab-spring and sliding trigger concepts<br />
applied to both ends of the centerline store because it is the weight of approximately 6 wing<br />
stores. The third design alternative involves that concept of a metallic sheet that is wrapped<br />
around the bottle and released by pressing the top ends of the sheet inward. Magnets for the<br />
centerline store were quickly ruled out because it was determined early on that they would not be<br />
able to support the store weight and load during maneuvering flight.<br />
5.2.2.1 Forward and Rear Mounting System<br />
The centerline store may also be secured using either the sliding trigger or tab-spring methods<br />
discussed for releasing the wing mounted stores. The only difference would be that the<br />
centerline store would require two of each particular mechanism, one located towards the front<br />
and one towards the aft of the centerline store because of both its heavy weight and it not having<br />
a useful contributing moment. The advantage of this is construction reproducibility and<br />
therefore simplicity (even though it requires an additional release mechanism). Releasing both<br />
mechanisms simultaneously so that the loaded centerline store does not jam in the wing joiner<br />
37
Project Final Report – CUDBF April 30 th , 2009<br />
ASEN 4028: <strong>Aerospace</strong> <strong>Senior</strong> <strong>Projects</strong><br />
will be a design concern but is manageable. A servo placed on the joiner between the two<br />
release mechanisms could be integrated with tight tolerances so as to release both mechanisms at<br />
the same instant. This design alternative was selected for the centerline store because of its<br />
reproducibility with the other wing release mechanisms and its ease to manufacture.<br />
5.2.2.2 Metallic Wrap<br />
In this design, the centerline store is supported by a metallic spring tab designed to support the<br />
load of the full 4L water bottle in all directions. The tab is counter sunk into the store and<br />
manufactured tight enough to ensure that the bottle will not move under any flight condition. A<br />
servo is attached to two rakes by a lever arm and a pin. The rakes rest over the tips of the spring<br />
tabs. Two U-bolts help to keep the rakes in proper postion and alignment over the holes in wing<br />
joiner.<br />
Figure 19: Metallic Wrap Centerline Store Release Mechanism<br />
To load the centerline store, the spring tabs are inserted through the bottom of the aircraft. They<br />
must be aligned with the cutout holes in the wing root. As the tabs are inserted, they will deflect<br />
inward due to their tip shape. Once inserted far enough, they will spring back nearly to their<br />
original outboard locations. They do not spring back all the way out to apply pre-stress to the<br />
tabs and root, helping to minimize store free-play. To release the centerline store, servo rotates<br />
and pulls the two rakes overlaying tabs inward. These rakes will then engage the outward edges<br />
of the spring tabs and pull them inward. The U-bolts over the rakes push and keep the rakes<br />
from rotating upward as the servo pull them in. This configuration allows the removal of the<br />
arms on the servo to prevent accidental deployment during flight.<br />
The sliding trigger release mechanism was chosen for both the wing and centerline stores. After<br />
being prototyped, it was shown that this mechanism did in fact have the greatest reliability when<br />
it came to securing the store on the aircraft. It was determined that this function was the most<br />
38
Project Final Report – CUDBF April 30 th , 2009<br />
ASEN 4028: <strong>Aerospace</strong> <strong>Senior</strong> <strong>Projects</strong><br />
mission critical design parameter because if the stores detach during flight, that mission would<br />
be considered a failure at competition. This mechanism also has the ability to load quickly if<br />
loading guides are placed on the store and aircraft. The sliding trigger design is the most reliable<br />
mechanism from preliminary design while maintaining an ability to load quickly.<br />
5.2.3 Container<br />
It is important that the container be light, be able to be unloaded quickly, and that its contents be<br />
securely stored and not shift or be damaged after a 6” drop. It was initially determined that the<br />
best approach would be to use two containers. Due to the large weight of the centerline store<br />
payload, a small solid box was used to contain the bottle. To prevent large dynamic loads<br />
experienced during the drop, the bottle was solidly supported on all sides. The second box,<br />
being the maximum size, contained the aircraft, rocket payloads and transmitter. This container<br />
was constructed using an isogrid skeleton in order to survive the drop at a light weight.<br />
Figure 20: Isogrid Box<br />
5.3 Propulsion Subsystem <strong>Design</strong> Alternatives<br />
The primary design choice for the propulsion system was whether to utilize a single motor or<br />
dual motors. The advantage of using a single motor is the reduced weight of a second motor,<br />
gearbox, speed controller, and the additional wiring necessary for a second motor. The weight of<br />
a second motor, gearbox, speed controller, and wiring is approximately 0.5 pounds. A conceptual<br />
design of the aircraft with a single motor is shown below in Figure 21.<br />
39
Project Final Report – CUDBF April 30 th , 2009<br />
ASEN 4028: <strong>Aerospace</strong> <strong>Senior</strong> <strong>Projects</strong><br />
Figure 21: Single Motor Aircraft<br />
However, in order to get the thrust required to meet the 100ft takeoff distance requirement with a<br />
single motor, a propeller size of 20 in was necessary. In order to accommodate a 20 in propeller<br />
with adequate ground clearance, the landing gear would need to be at least 11 in long. This<br />
would allow for 10 in or half the propeller blade to spin under the wing with 1 in of ground<br />
clearance. This added landing gear size would require more structure and thus added weight and<br />
drag from the long landing gear. A system level requirement states that the aircraft must fit<br />
within a 2 ft x 2 ft x 4 ft box. With 11 in landing gear, an aircraft thickness, and 13 in winglets<br />
that fold 15 in in from the tip of the wing, it would be impossible to fit the aircraft vertically in a<br />
box under 2 ft tall. This drove the design of the propulsion system to utilize dual motors.<br />
Other disadvantages of a single motor include less directional stability due to the large amount of<br />
p-factor coming off one motor. In order to use a single motor rated for the required power<br />
necessary, the motor itself would weigh 0.25lbs more. That means the overall weight savings<br />
from using a single motor in this case would only be 0.25lbs. Because of these characteristics, a<br />
dual motor configuration was chosen.<br />
Once dual motors were selected, the exact configuration of the motors was analyzed. Three<br />
configurations were analyzed. These included dual inline pusher puller motors, dual rear<br />
mounted motors, and dual front mounted motors.<br />
The advantage of using dual inline motors is that if an engine were to fail, asymmetric thrust<br />
would not be an issue. A conceptual design of dual inline motors is shown in Figure 22.<br />
Figure 22: Dual In-Line Pusher Puller Motors<br />
The major disadvantage of using dual inline motors is that it would add length to the aircraft. The<br />
front motor would need to be placed in front of the nose of the aircraft, adding an additional 3 in<br />
40
Project Final Report – CUDBF April 30 th , 2009<br />
ASEN 4028: <strong>Aerospace</strong> <strong>Senior</strong> <strong>Projects</strong><br />
to the aircraft length. The aircraft is already 22.5 in from the nose to the most rearward location<br />
of the wing after the wingtip is folded. If any additional length were added in front on the nose,<br />
the aircraft would not be less than 2 ft long, and therefore would not fit into the box.<br />
Another big disadvantage would be that the propellers would interfere with the water bottle<br />
placement on the CG. In order to keep the aircraft static margin the same during all flight<br />
missions, the payload CG must be placed on the aircraft CG. The wing chord at the root is 20 in,<br />
and the length of the water bottle with aerodynamic fairings is 15 in long. Depending upon<br />
where the aircraft CG ends up, placing the water bottle on the CG may be impossible without the<br />
propeller striking the bottle.<br />
As for dual rear mounted motors, the primary advantage is that the wake from the propellers<br />
does not interfere with the lift and efficiency of the wing. A conceptual design of dual rear<br />
mounted motors is shown below in Figure 23.<br />
Figure 23: Dual Rear Mounted Motors<br />
The major disadvantage of having dual rear mounted motors is that there is additional ground<br />
clearance required for rotation on takeoff. As the aircraft nose pitches up for takeoff, the rear of<br />
the aircraft moves down about the CG. Estimating that the CG was approximately ½ way down<br />
the chord, or 10 in, and assuming a 10° angle of attack on rotation, the rear propellers would<br />
move down 1.5 in. This means that the landing gear would need to be 1.5 in taller when<br />
compared to front mounted motors. This added landing gear length and structure would add<br />
unnecessary weight and drag.<br />
Two other disadvantages to having dual rear mounted motors are weaker structure and<br />
interference with other aircraft systems. The airfoil chosen for the wing becomes very thin<br />
towards the rear. If the motors needed to be mounted on the rear, the structure would need to be<br />
strengthened significantly to handle the weight of the motors, as well as the stress caused by the<br />
force from the thrust, and any torque from the motors. As for interference, there are many<br />
components in the rear of the aircraft. All of the control surfaces will be at the rear of the aircraft.<br />
In addition, all of the servos and wiring required to move them will need to be integrated in the<br />
rear. The two main landing gear struts will also need to be placed at the rear of the aircraft. The<br />
41
Project Final Report – CUDBF April 30 th , 2009<br />
ASEN 4028: <strong>Aerospace</strong> <strong>Senior</strong> <strong>Projects</strong><br />
attachment and integration of these parts will be difficult if they are all placed in the rear of the<br />
aircraft.<br />
The propulsion configuration chosen incorporates dual front mounted motors. This configuration<br />
requires the least additional ground clearance, reducing landing gear size, weight, and drag.<br />
Another major advantage to mounting the motors in the front of the aircraft is it helps move the<br />
CG forward, increasing stability. Each motor assembly is approximately 0.5lbs, a significant<br />
portion of the aircraft total weight. Since the aircraft center of gravity needs to be in front of the<br />
center of pressure, and the larger the static margin the more stable the aircraft is, having the<br />
weight of the motors in the front of the aircraft is the best for stability.<br />
For the same reason, the battery pack will be placed at the front of the aircraft. The weight of the<br />
battery pack was estimated at 1.0lbs, so placing the batteries towards the front of the aircraft was<br />
deemed essential for stability. By utilizing dual front mounted motors, the amount of wiring<br />
required to run from the batteries to the motors will be decreased, eliminating the extra wire<br />
weight. Finally, these motors fit without interfering with other aircraft systems. Unlike the rear<br />
of the aircraft, there are almost no systems in the front of the aircraft aside from the main landing<br />
gear in the center. For these reasons, the propulsion configuration chosen incorporated dual front<br />
mounted motors.<br />
A conceptual design of the aircraft using dual front mounted motors is shown in Figure 24.<br />
Figure 24: Dual Front Mounted Motors<br />
5.4 Structures Subsystem <strong>Design</strong> Alternatives<br />
5.4.1 Wing Construction<br />
Competition scoring is directly affected by aircraft weight and minimizing the overall system<br />
weight is a top priority in order to maximize the score. The two driving parameters for the<br />
selection of the wing construction method were wing weight and overall design complexity.<br />
Wing weight is defined as the overall weight derived from the material, adhesives, and fasteners<br />
required for each construction method. A minimal wing weight was desired to minimize the<br />
total aircraft weight.<br />
<strong>Design</strong> complexity is composed of two construction method factors: the time of manufacturing<br />
and the ease of reparability. Both of these factors are primarily driven by the wing construction<br />
42
Project Final Report – CUDBF April 30 th , 2009<br />
ASEN 4028: <strong>Aerospace</strong> <strong>Senior</strong> <strong>Projects</strong><br />
complexity such as number of components, joints, and manufacturing steps. It was deemed<br />
important to reduce the time of manufacturing to increase the number of wings produced for<br />
testing, flights, and back-up replacements. The ease of repair was deemed important to increase<br />
each wing’s lifetime and allow for quick repairs if needed on-site or at competition. Higher<br />
preference was awarded to wing weight over design complexity due to its direct affect on the<br />
competition scoring. While design complexity is undesirable during the project construction and<br />
testing phases, it was identified as a secondary parameter because it does not directly affect<br />
competition scoring.<br />
The two main wing construction methods considered for the final design were balsa/foam-core<br />
composite wings and a traditional balsa rib and spar construction. A foam-core with balsa-skin<br />
sheeting relies on the balsa skin to carry the majority of the wing bending loads while the foam<br />
provides general wing structure and rigidity. The traditional balsa rib and spar construction<br />
technique applies the wing loads on the spar while the Monokote skin only provides an<br />
aerodynamic surface. A third available construction option was a composite shell technique<br />
made from fiberglass or carbon fiber. However this construction method was not considered due<br />
to the excessively large weights associated with composites and the higher complexity in<br />
manufacturing. The two wing construction techniques considered for final selection are<br />
displayed in Figure 25 9 .<br />
Figure 25: Wing Construction Method <strong>Design</strong> Options<br />
After examining the characteristics of both wing construction methods, it was determined that<br />
the weight would be similar between both methods. While the rib and spar method required<br />
fewer wing-critical materials, the addition of strengthened mounting locations for the wing stores<br />
would increase the overall wing construction weight to approximately the same as the balsa and<br />
foam-core composite. Thus the overall design complexity was used as a tie-breaker between the<br />
two construction techniques. It was determined that both the time of manufacturing and wing<br />
repair ease were vastly superior on the balsa-foam composite due to the fewer number of<br />
components and manufacturing steps. The rib and spar construction method inherently requires<br />
many components including the wing spar, joint locations, and various ribs sizes across the<br />
length of the wing span. The complexity and number of wing rib components required for a<br />
tapered and swept wing alone would dramatically increase each wing’s manufacturing time. The<br />
rib and spar system, in a light weight design, will also be vulnerable in crashes and require<br />
43
Project Final Report – CUDBF April 30 th , 2009<br />
ASEN 4028: <strong>Aerospace</strong> <strong>Senior</strong> <strong>Projects</strong><br />
extensive repair time to account for varying sized parts throughout the wing. Due to the time<br />
savings during the construction and repair of a balsa-foam composite wing, this construction<br />
method was selected as the final design selection<br />
5.4.2 Wing Span Reduction Method and Joint Location<br />
The existence of both the span-wise minimum wing span and the maximum aircraft container<br />
dimensions made it impossible to employ a traditional solid single-piece wing. Some form of<br />
wing span reduction is necessary in the design to meet both span and container requirements.<br />
The primary decision parameters for wing span reduction included minimizing assembly time<br />
(the most significant mission score component), and design/manufacturing complexity. The<br />
most sensitive score component at competition is derived from assembly time, and any reduction<br />
in total assembly time is given the highest priority and preference. The design and<br />
manufacturing complexity is important for reducing failure opportunities and improving<br />
performance and construction consistency.<br />
The two primary methods considered as design options for total wing span reduction were wing<br />
folding and wing disassembly. Wing folding involves the use of hinges at a fold joint to allow a<br />
wing section to either fold upwards or downwards to reduce the span-wise length. Wing<br />
disassembly splits the wing into multiple sections that would come apart for container storage<br />
and reassemble into a complete wing. Both the wing folding and wing disassembly design<br />
concepts are provided within Figure 26.<br />
Figure 26: Wing Span Reduction <strong>Design</strong> Options<br />
The wing folding solution presents many advantages over wing disassembly, particularly with<br />
respect to the important aircraft assembly time derived from the mission sensitivity analysis.<br />
With a hinged folding wing, the handler only needs to repeat one simple swinging motion to<br />
reposition the wings into flight ready position. Another advantage to a folding wing is that any<br />
wiring across the fold location does not need to separate and reconnect repeatedly. A<br />
disassembled wing not only requires time for reassembly of various individual components, but<br />
has increased assembly time and complexity to realign components and reconnect any<br />
44
Project Final Report – CUDBF April 30 th , 2009<br />
ASEN 4028: <strong>Aerospace</strong> <strong>Senior</strong> <strong>Projects</strong><br />
disconnected wiring. The simplicity and single motion input from the aircraft assembler was<br />
expected to significantly decrease the assembly time of a folded wing design over a disassembled<br />
wing design. The significance of assembly time on the mission score in conjunction with the<br />
simplicity and quick assembly of the wing folding system resulted in it being chosen as the final<br />
wing span reduction method.<br />
Various locations along the wing for the fold joint location were considered, including near the<br />
wing tips, near the wing root, and a single side wing fold. <strong>Design</strong> concepts for each of the wing<br />
fold joint locations are provided in Figure 27. The wing tip or mid-span wing folds place the fold<br />
joint in the outer ends of the wing span. Folding at or near the wing root would place the fold<br />
joints on or near the aircraft centerline. A single side folding placed the fold joint in one side of<br />
the wing, sparing the other side from any fold joints. A fold joint at the wing root will encounter<br />
the largest bending moment, and the significant risk to the overall aircraft structural integrity<br />
disqualified this design option. A fold joint on one side was disqualified due to the asymmetric<br />
design issues and the significant strain placed on that wing half. Wing fold joints located in the<br />
outer sections of the wing was chosen primarily because it encounters the smallest wing loads<br />
and moments. Another reason for choosing wing-tip folding is that it creates the smallest folded<br />
region out of the three options.<br />
Figure 27: Wing Fold Joint Location <strong>Design</strong> Options<br />
5.4.3 Landing Gear Configuration<br />
Determination of the aircraft landing gear configuration was primarily driven by four landing<br />
gear parameters: ground stability, ground authority, take-off rotation, and drag. Factors such as<br />
landing gear weight and integration were not included in the determination process due to their<br />
dependence on the overall aircraft design and configuration. A preliminary landing gear height<br />
of 7 inches was estimated by accounting for adequate centerline store and propeller ground<br />
clearance below the wing. The four main decision drivers do not directly meet mission<br />
requirements, but all play significant roles in the completion of the various missions. Ground<br />
stability is crucial during the ground components of Mission 3 where an asymmetric wing store<br />
configuration is possible and any aircraft that tips over will fail that mission attempt. Ground<br />
authority is important once again in Mission 3’s ground component when the pilot must taxi the<br />
aircraft to a specified location for rocket drops. Take-off rotation is crucial in every mission as<br />
the aircraft must take off within 100 feet every time. Lastly, drag is an important factor in<br />
45
Project Final Report – CUDBF April 30 th , 2009<br />
ASEN 4028: <strong>Aerospace</strong> <strong>Senior</strong> <strong>Projects</strong><br />
Mission 1, where two laps will be timed for the score and in Mission 3 where flight endurance is<br />
crucial.<br />
The three landing gear configurations considered for the design included tricycle, bicycle, and<br />
tail-dragger style landing gear and are shown in Figure 28. A tricycle configuration has one nose<br />
gear and two wheels on a main gear just aft of the aircraft center of gravity. A bicycle<br />
configuration has one nose gear and one nose wheel inline on the centerline of aircraft, and<br />
sometimes employs wing-tip outriggers for lateral balance. The tail-dragger configuration is<br />
similar to an inverted tricycle gear, where a tail gear is used and the two wheels on the main gear<br />
are just forward of the aircraft center of gravity.<br />
Figure 28: Landing Gear Configuration Options<br />
After examining the three landing gear configuration’s characteristics in each of the four main<br />
parameters, the tricycle configuration was determined to be the best all around performer. The<br />
tricycle configuration is widely regarded as the most ground stable due to the aircraft center of<br />
gravity’s location just forward of the main gear. The tricycle configuration is not as vulnerable<br />
to tip over from take-off side gusts. Tail-dragger and bicycle configurations are vulnerable since<br />
they must pivot about one wheel. Ground authority on a tricycle landing gear is simpler than the<br />
tail-dragger which has nose over and ground loop issues. The tricycle gear’s ground stability<br />
also outperforms the bicycle gear which must balance on the center-line mounted landing gear.<br />
The bicycle gear is also particularly vulnerable to tip over with the large expected lateral CG<br />
shifts. The tricycle gear is the only one of the three that has the capability to rotate during the<br />
46
Project Final Report – CUDBF April 30 th , 2009<br />
ASEN 4028: <strong>Aerospace</strong> <strong>Senior</strong> <strong>Projects</strong><br />
take-off ground roll and generate additional positive angle of attack for take-off. The drag<br />
penalty on the three large surface tricycle configuration is higher than the two surface bicycle<br />
gears and slightly higher than the more aerodynamically efficient tail-dragger configuration.<br />
However, due to the drag penalties only affecting one timed mission and general aircraft<br />
endurance, it was decided that the superior performance in the other three parameters far<br />
outweighed the tricycle gear’s slight drag penalty. Due to the tricycle gear’s superior<br />
performance in ground stability and authority, a unique ability to rotate on the ground among the<br />
three, and only slight underperformance in drag, it was chosen as the final selection for landing<br />
gear.<br />
5.4.4 Main Landing Gear Material<br />
The main landing gear material was chosen by examining the weight and radius required in order<br />
to satisfy the landing gear design-to-specifications. These properties were compared for various<br />
potential gear construction materials including aluminum, steel, fiber glass, and carbon fiber.<br />
The results are shown in Figure 29. The material that required the smallest radius, thus<br />
generating the least drag, and smallest weight was carbon fiber. However after examining<br />
potential landing gear construction and mounting methods, it was determined that carbon fiber<br />
was not an ideal landing gear solution for this aircraft. The next best solution was aluminum,<br />
which still had an ideal low weight but with a slightly larger radius. Along with its low weight,<br />
aluminum’s malleability made it an attractive material for landing gear shaping and mounting.<br />
For these reasons aluminum was chosen as the main landing gear strut material.<br />
0.25<br />
Landing Gear Strut Radius Sensitivity to Sweep Angle and Youngs Modulus<br />
2500 ksi (Fiberglass Composite)<br />
10,000 ksi (Aluminum)<br />
20,000 ksi (Carbon Fiber w/ Epoxy)<br />
30,000 ksi (Medium Alloy Steel)<br />
0.2<br />
0.15<br />
Radius (in)<br />
0.1<br />
0.05<br />
0<br />
0 10 20 30 40 50 60<br />
Angle Sweep of Strut (Degree)<br />
Figure 29: Main Gear Material Comparisons<br />
47
Project Final Report – CUDBF April 30 th , 2009<br />
ASEN 4028: <strong>Aerospace</strong> <strong>Senior</strong> <strong>Projects</strong><br />
6.0 Subsystem <strong>Design</strong>-To Specifications<br />
Author: Jarryd Allison<br />
Co-Author: Brett Miller<br />
6.1 Aerodynamics <strong>Design</strong>-To Specifications<br />
Requirements for the aerodynamics subsystem were derived from customer requirements as well<br />
as from the mission goals. The customer required that the aircraft take off in no more than 100 ft<br />
and fly at conditions in a 5000 ft density altitude. Additionally, it was required that the minimum<br />
wing span shall be no less than 5 ft and the airplane is required to be stable in both the<br />
asymmetric and symmetric load cases.<br />
Since the overall goal of the team is to win the competition, performance requirements were<br />
derived from past competition winners. The aircraft was required to cruise at 100 ft/sec, stall at<br />
40 ft/sec, and perform a 2 g maneuver at 80 ft/sec. Heuristic data is valid because performance<br />
specifications such as cruise speed, and stall speed have not varied over the past years’<br />
competition winners regardless of mission or overall aircraft configuration.<br />
6.2 Missions <strong>Design</strong>-To Specifications<br />
The design-to specifications for the Missions subsystem can be broken into three separate<br />
elements: the wing mounted stores, the centerline store, and the aircraft container. Each of these<br />
is vital to the mission of the aircraft and its performance at competition.<br />
The design process includes an analysis of the loads acting on the stores, consideration of<br />
multiple design alternatives, testing of those alternatives, an educated selection based on the test<br />
results, and finally a successful implementation of the design choice.<br />
6.2.1 Wing Mounted Store<br />
Based on the sensitivity analysis, the loading of these stores will have a large effect on the<br />
aircraft’s score at competition. This loading time factors into both the System Complexity<br />
Factor score of the aircraft through its effect on assembly time, and wing store loading time<br />
directly affects the score in Mission 3 (the heaviest weighted mission). It is therefore important<br />
that the release mechanisms for these stores have the ability to load quickly. Although a specific<br />
time requirement has not been established, multiple iterations should be utilized to achieve the<br />
fastest loading design.<br />
It is also important the store release when desired and not while in flight. To this end, the release<br />
mechanism must release 95% of the time while being able to constrain the store under flight<br />
conditions and loads. These flight conditions include a 3g force in the aircraft’s Z-axis and a<br />
1.73 g lateral force. These design-to loads were determined from the following equations (which<br />
in turn were derived using Error! Reference source not found.).<br />
48
Project Final Report – CUDBF April 30 th , 2009<br />
ASEN 4028: <strong>Aerospace</strong> <strong>Senior</strong> <strong>Projects</strong><br />
Equation 8: Summary of Equations Calculating Centripetal Force on Wing Stores<br />
6.2.2 Centerline Store<br />
The centerline store experienced a change in requirements between PDR and CDR in the fact<br />
that it must be releasable. Therefore, the expectations for the wing mounted store also apply to<br />
the centerline store. The design for this store must be able to support the larger load of the filled<br />
wattle bottle at 9 lbs.<br />
6.2.3 Container<br />
The containers have many objectives to achieve. The first of which is that it must accommodate<br />
the payloads, the aircraft, and the transmitter. These items must be secured in the containers.<br />
The containers themselves must also be able to be secured so that it may be handled without<br />
opening. The containers must be able to protect themselves and their contents from a 6” drop<br />
onto pavement. If any contents are shifted or damaged this test results in failure. It is also<br />
important that the design facilitate a fast loading assembly of the aircraft after being secured in<br />
the containers. The time it takes to do this is factored directly into the assembly time of the<br />
aircraft at competition, which drives the SCF.<br />
6.3 Propulsion <strong>Design</strong>-To Specifications<br />
The design of the propulsion system was restricted by several competition requirements. The<br />
propulsion system must be electrically powered and all parts must be COTS. For safety, the<br />
battery chemistry must be either NiCad or NiMH. The maximum battery pack weight is limited<br />
to 4lbs. The amount of current flowing from the battery is limited by a 40 amp fuse. The 40 amp<br />
fuse must be implemented in such a way so that no single part of the propulsion system sees<br />
more than 40 amps.<br />
The biggest requirement for the overall propulsion system is that the aircraft must be able to take<br />
off in under 100 ft with a 5,000 ft density altitude and no wind. Once airborne, the aircraft must<br />
have a range long enough to complete all three flight missions. The two most battery power<br />
challenging missions are mission 2 and mission 3. Mission 2 requires four laps flown with a fully<br />
loaded water bottle (9.0 lbs). Mission 3 requires four takeoffs, four landings, and four laps,<br />
49
Project Final Report – CUDBF April 30 th , 2009<br />
ASEN 4028: <strong>Aerospace</strong> <strong>Senior</strong> <strong>Projects</strong><br />
dropping one rocket in between each lap. The first lap will be flown at 12 lbs, and the last lap<br />
will be flown at 7.5 lbs, with a 1.5 lb rocket being dropped in between each landing and takeoff.<br />
The batteries must be designed for a four lap endurance plus a 30 second power reserve.<br />
6.4 Structures <strong>Design</strong>-To Specifications<br />
6.4.1 Aircraft Wing Requirements<br />
The aircraft wing is required to sustain a +3.5g load while carrying the centerline store and a -2g<br />
load while carrying the tip stores. The required g loads were determined by including an<br />
additional 1 g of load to the worst case expected scenario for each payload. The worst case wing<br />
loading scenarios were derived from the expected in-flight bank turns the aircraft must make<br />
during each of the missions. The addition of the g loading margin creates a 1.4 safety factor for<br />
the centerline store flight scenario and a safety factor of 2 for the tip store flight scenario. The<br />
safety factor added to the worst expected loading is an added margin for unexpected factors<br />
including in-flight wind gusts and ideal assumptions made for the wing material and<br />
construction.<br />
The aircraft wing is required to fit within the aircraft container while still meeting the wingspan<br />
and payload integration requirements. This requires the wing be foldable or collapsible for incontainer<br />
storage due to the 48” x 24” x 24” dimensions specified by the competition. To<br />
guarantee the aircraft wing does not exceed the maximum container dimensions, the aircraft’s<br />
maximum dimensions on each side shall be 1” shorter than the container’s dimensions. With the<br />
maximum wing dimensions bound to 47” x 23” x 23”, a margin of safety was assured for this<br />
dimension requirement. This margin accounts for the thickness of the walls as well as some free<br />
space on any side of the aircraft in the container.<br />
The wing structure is also required to integrate the wingtip and centerline stores such that they<br />
are securely restrained in the worst case flight loading with some safety factor. The worst case g<br />
loading is expected to be a 2.5g bank turn and 1g of safety factor was added to that loading. A<br />
3.5g loading generates 28 lbs at the centerline store mount and 10.5 lbs at each wingtip store<br />
mount. The additional 1g included in the design wing loading creates a safety factor of 1.4 for<br />
each payload’s mounting point.<br />
6.4.2 Landing Gear Requirements<br />
The aircraft landing gear and supporting aircraft structure is required to survive the impact loads<br />
involved during landing. A successful mission requires that the aircraft survive take-off, flight,<br />
and landings. The landing gear requirement dictates that each gear strut survive a dynamic<br />
loading assumed to be approximately 3 times the heaviest aircraft weight configuration. Landing<br />
the plane on one gear in the heaviest configuration was deemed the worst case landing scenario.<br />
The 3g single gear strut loading includes a safety factor of 1.2 during the heaviest aircraft<br />
configuration and a safety factor of 2.25 in a no payload configuration. An additional 25%<br />
50
Project Final Report – CUDBF April 30 th , 2009<br />
ASEN 4028: <strong>Aerospace</strong> <strong>Senior</strong> <strong>Projects</strong><br />
safety factor applied to the final gear design was required to account for additional loads in<br />
landing and for the ideal assumptions made in the gear materials and construction.<br />
6.5 Avionics <strong>Design</strong>-To Specifications<br />
6.5.1 Transmitter<br />
The transmitter is required to control all control surfaces, the propulsion system, and the<br />
releasable external stores. The releasable stores are required to be dropped one at a time. The<br />
transmitter is also required to have a fail-safe mode that is automatically selected during loss of<br />
transmit signal. During fail-safe the aircraft receiver must select throttle closed, full up elevator,<br />
full right or left aileron, and full right rudder.<br />
6.5.2 Telemetry System<br />
The telemetry system must record several flight characteristics including: Motor voltage, amps,<br />
motor RPM, angle of attack, G forces, servo positions, altitude, and airspeed.<br />
6.5.3 Microcontroller System<br />
The aircraft’s onboard microcontroller must be able to take signals from the receiver, process<br />
which order is being commanded by the pilot, and determine when to drop the payload stores.<br />
51
Project Final Report – CUDBF April 30 th , 2009<br />
ASEN 4028: <strong>Aerospace</strong> <strong>Senior</strong> <strong>Projects</strong><br />
7.0 Project Feasibility and Risk Assessment<br />
Author: Eric Hall<br />
Co-Author: Dan Colwell<br />
7.1 Project Feasibility<br />
7.1.1 Weight Budget and Feasibility<br />
The estimated weight of the aircraft was determined from the sum of the weights of all the<br />
systems components. From the combination of the system weights stated earlier, the estimated<br />
maximum takeoff weight of the aircraft is approximately 15 pounds. This weight reasonably<br />
satisfies the aircraft maximum weight requirement (0.PRJ.5).<br />
This weight estimation can be further validated by comparison to similar aircraft. A database of<br />
aircraft from the 2007-2008 DBF competition shows an average payload weight to empty aircraft<br />
weight ratio (W PL /W E ) of 1.27. The 2008-2009 competition payload weight of 8.33 pounds<br />
determines the aircraft should have an empty weight of approximately 6.54 pounds. This<br />
estimate also satisfies 0.PRJ.5.<br />
7.1.2 Cost Feasibility<br />
In order to guarantee the project’s material costs are less than the project’s budget, a base<br />
estimate of the prices of each component was collected. The estimated budget for construction<br />
and travel can be observed in Section 14.4. The estimated budget for the project is $12,130.<br />
Based on the funding provided by the <strong>Aerospace</strong> <strong>Engineering</strong> <strong>Sciences</strong> Department ($4,000), the<br />
<strong>Engineering</strong> Excellence Fund ($2,000), and Lockheed Martin ($10,000), the budget for<br />
constructing the aircraft is feasible even with a 25% margin.<br />
7.1.3 Aerodynamic Feasibility<br />
Based on the design to specifications, the aircraft was sized to a takeoff distance of 90 feet with a<br />
10 ft margin, 40 ft/sec stall speed, 100 ft/sec cruise speed and 2g maneuver at 80 ft/sec. The<br />
performance sizing plot is shown in Figure 30. Performance sizing was checked with Dr.<br />
Gerren, a team advisor [10] .<br />
52
Project Final Report – CUDBF April 30 th , 2009<br />
ASEN 4028: <strong>Aerospace</strong> <strong>Senior</strong> <strong>Projects</strong><br />
Figure 30: Performance Constraint Plot<br />
From the performance sizing, the design area that meets all requirements was determined. In the<br />
plot shown, the shaded area indicates the optimal design area. The equations used to determine<br />
the weight to power ratio as a function of stall speed, takeoff distance, cruise speed and<br />
maneuver are shown in Equation 9, Equation 10, and Equation 11 respectively:<br />
= 1<br />
2 <br />
<br />
Equation 9: Weight-to-Power Ratio for Stall Speed<br />
In Equation 9, is the ambient density, is the maximum lift coefficient and V stall is the stall<br />
speed.<br />
= ∙ ∙ ∙ <br />
∙ <br />
1.44 ∙ <br />
Equation 10: Weight-to-Power ratio for takeoff.<br />
In the performance sizing equation for takeoff distance, is the takeoff distance, is the<br />
density, is the maximum lift coefficient, is the landing speed, is the acceleration<br />
due to gravity and is the wing loading.<br />
<br />
53
Project Final Report – CUDBF April 30 th , 2009<br />
ASEN 4028: <strong>Aerospace</strong> <strong>Senior</strong> <strong>Projects</strong><br />
<br />
=<br />
<br />
<br />
∙ ∙ <br />
<br />
<br />
<br />
<br />
1<br />
<br />
<br />
<br />
+ <br />
<br />
<br />
∙ ∙ ∙ ∙ <br />
∙ <br />
<br />
∙ <br />
∙ <br />
<br />
<br />
<br />
<br />
Equation 11: Weight-to-Power ratio for cruise speed.<br />
In Equation 11, is the dynamic pressure based on the ambient density, and cruise velocity,<br />
is the parasitic drag, <br />
<br />
is the takeoff thrust to cruise thrust ratio, is the Oswald efficiency<br />
factor of the wing, is the aspect ratio of the wing, <br />
<br />
is the ratio of the cruise weight to the<br />
takeoff weight, is the wing loading and <br />
is the cruise speed. A detailed list of the<br />
assumptions and values used to size this aircraft can be seen in Appendix F. The equations used<br />
to do the performance sizing were obtained from Roskam [11] .<br />
The design point chosen from this design area is also marked in the plot. This design point gave<br />
a wing loading, W/S of 2.1 lb/ft 2 and a weight to power ratio, W/P of 0.047 lb/lb ft/s. Using an<br />
estimated gross takeoff weight of 15lb, the wing area necessary from the wing loading was<br />
determined to be 7.14 ft 2 . The power required from the weight to power ratio was determined to<br />
be 530 W. The performance sizing shown demonstrates that a number of designs that meet all<br />
the performance requirements for stall, takeoff and cruise are feasible, and an optimized design<br />
can be created that would maximize the cruise speed while keeping the weight to power ratio<br />
small.<br />
7.1.4 Propulsion Feasibility<br />
To ensure that the propulsion system can meet all the design to specifications, a feasibility study<br />
was conducted. The two major requirements to verify are the 100 ft takeoff distance and the<br />
maximum 4 lb battery weight. The rest of the requirements can be verified by inspection. In<br />
order to make the 100 ft takeoff, the thrust required from the motors was calculated. The<br />
equation for takeoff distance is in Equation 12.<br />
S<br />
LO<br />
=<br />
g * ρ * S * C<br />
L<br />
2<br />
1.44 * W<br />
*{ T − [ D + µ * ( W<br />
r<br />
− L)}<br />
Equation 12: Takeoff Distance Calculation<br />
To simplify the equation, it is assumed that drag, D is very small compared to thrust and that the<br />
coefficient of friction, µ of the landing gear wheels is negligible. This yields the simplified<br />
version solved for thrust in Equation 13.<br />
r<br />
54
Project Final Report – CUDBF April 30 th , 2009<br />
ASEN 4028: <strong>Aerospace</strong> <strong>Senior</strong> <strong>Projects</strong><br />
T<br />
=<br />
2<br />
1.44* W<br />
g * ρ * S * C L<br />
* S LO<br />
Equation 13: Simplified Takeoff Distance Calculation<br />
Where W is the fully loaded weight of the aircraft (15 lbs), ρ is the density for a 5,000 ft density<br />
altitude, S is wing area, g is gravity, C L is takeoff lift coefficient, and S LO is takeoff distance. The<br />
aircraft stalls at a C L of 1.38 and an angle of attack of 12.6°. Therefore, assuming a takeoff<br />
rotation of 10°, takeoff C L was assumed to be 1.1. To account for the small drag and rolling<br />
friction assumption, a 10% margin was added to the takeoff distance. Therefore, S LO was chosen<br />
to be 90ft. With these variables, the thrust required is 6.0lb, or 3.0lb per motor. To ensure that<br />
this thrust could be met, a static thrust stand was created shown in Figure 31.<br />
Figure 31: Static Thrust Stand<br />
The thrust stand was designed so that as the motor generated thrust, it would pull against a load<br />
cell to record the static thrust. The load cell was connected to a LabView VI to record the thrust<br />
data [12] . During static thrust tests, an Eagle Tree telemetry system was used to record voltage,<br />
current, power, and motor RPM [13] . The motor set up utilized to test the thrust available was the<br />
Neu [14] 1107 2Y motor with 3300 rpm/V at 19.0 V, 40 amps, and an 8,000 ft density altitude. To<br />
make up for the extra rpm/V of the Neu 1107 motor compared to the Neu 1110 2Y motor, the<br />
voltage was lowered below that of the estimated battery pack voltage to compensate. Several<br />
different propeller sizes were tested. The amount of thrust produced by this single motor varied<br />
between 4.30 lb and 5.87 lb of thrust depending upon the propeller size and pitch. This<br />
confirmed that the amount of thrust required to make the 100ft takeoff requirement is feasible.<br />
The other major design to specification of the propulsion system is the maximum battery weight<br />
of 4 lbs. To check the feasibility of this requirement, the amount of power required to fly four<br />
laps at maximum weight was estimated. The average current draw was assumed to be 20 amps at<br />
55
Project Final Report – CUDBF April 30 th , 2009<br />
ASEN 4028: <strong>Aerospace</strong> <strong>Senior</strong> <strong>Projects</strong><br />
20V. At this power draw, an 18 cell battery pack would last for 4.5 minutes. This would be<br />
enough time to complete four laps with a minimum 30 second reserve. After glancing at several<br />
NiCad and NiMH batteries, a conservative weight of 30g per battery was chosen. The battery<br />
pack weight was calculated to be 1.2lbs. This is significantly less than the 4lb maximum battery<br />
pack weight, making it feasible to meet all requirements.<br />
7.1.5 Payload Feasibility<br />
Payload deployment capabilities are important in order to successfully complete the competition<br />
missions. Currently two parallel concepts are being designed; a mechanical pin concept and a<br />
magnetic plate concept. In order to restrain the payload in flight, both systems need to withstand<br />
a 4.5 lb vertical load while restraining a 1.5 lb horizontal load. This is not a concern for the<br />
mechanical system as the payload system would need to fail structurally for the payload to<br />
prematurely detach. For the magnetic system, the payload would need to overcome the magnetic<br />
force between the payload and the deployment system. In flight, a maximum force of 4.74 lb<br />
could be encountered, requiring a magnetic force equal to or greater than this force. Two D8X8<br />
neodymium magnets installed in the payload provides an attractive force of 12 lb, more than<br />
enough to restrain the payload in worst case flight conditions. Deploying the mechanisms is<br />
solely dependent on the force applied by an actuator. Standard digital servos are capable of<br />
providing enough torque to deploy both mechanisms.<br />
Landing gear ground stability for the worst asymmetric payload configuration was analyzed<br />
through lateral center of gravity (C.G.) shifting. An aircraft assumed to weigh 6 pounds under a<br />
symmetric configuration will have an aircraft C.G. at the lateral aircraft center. The worst case<br />
payload configuration was determined to be two wing stores on one wing (27 inches from<br />
aircraft center), while the other wing carries no wing stores. The combined two wing stores will<br />
generate a moment of 81 lb-in about the aircraft center, forcing the total system C.G. to shift<br />
towards the wing tip by 9 inches from its initial location. With a design margin of 1.5 the rear<br />
landing gears will be 13.5 inches left and right of the center line with 27 inches between them. A<br />
distance of 27 inches will assure adequate ground stability for the aircraft even under the worst<br />
asymmetric loading conditions while providing more than enough space for the 6 inch wide<br />
centerline fuel tank.<br />
7.1.6 Assembly Feasibility<br />
The box will be aligned such that the 4’ direction is along the aircraft wingspan, while the height<br />
and length of the aircraft will be aligned in the 2’ directions. To get the aircraft to fit into a single<br />
box, the wings will be designed to fold 15” in from the tip, reducing the folded wingspan to 38”.<br />
As for height, the aircraft will be designed with landing gear of 7”. This is driven by the need to<br />
store the 6” diameter water bottle under the wing and by the need for propeller ground clearance.<br />
Above that, the wing will only be a few inches thick to house the motors and batteries. The<br />
propeller could be positioned horizontally parallel to the wing while packed in the box. The<br />
winglets are not expected to exceed a height of 15”. As seen in Figure 32, the required vertical<br />
56
Project Final Report – CUDBF April 30 th , 2009<br />
ASEN 4028: <strong>Aerospace</strong> <strong>Senior</strong> <strong>Projects</strong><br />
clearance is available with the wing-tips folded: This was determined using the code provided in<br />
Appendix D<br />
Figure 32: Assembly Feasibility<br />
The wing area was determined to be 7.14 ft 2 from the performance sizing. Using an upper bound<br />
of 25° leading edge wing sweep, and a nominal taper ratio of 0.5, the leading edge of the wing at<br />
the fold is 19 in behind the nose. This means the aircraft will be 23 in long when folded in the<br />
box. This was the upper bound because ½ in thickness for the walls of the box was assumed. It is<br />
also important to note that even with a 14 in propeller (the largest under consideration for the<br />
project), the propellers can still be mounted on the front of the aircraft with adequate clearance<br />
from the wing, and still remain behind the nose of the aircraft. Based upon this information, it is<br />
entirely feasible to fit the flying wing inside a 2’ x 2’ x 4’ box by only folding the wingtips.<br />
7.2 Risk Assessment<br />
The largest risks involved with designing the Buff-2 Bomber are enough to warrant concern and<br />
additional analysis in order to alleviate as much danger of total aircraft failure. The major risks<br />
from each subsystem were further analyzed to determine the overall importance, probability, and<br />
mitigation.<br />
7.2.1 Aerodynamics<br />
Insufficient stability of the aircraft would result in a loss of pilot control and erratic flight.<br />
Included in this risk is the possibility of aircraft damage during takeoff and landing if the<br />
unstable nature of the aircraft prompts the plane to pitch or roll when operating at low velocities.<br />
Should the aircraft be unstable, the control surfaces would be unable to compensate and a crash<br />
is imminent. This was mitigated through extensive analysis and research into airfoils and design<br />
of flying wings. Even with the amount of time devoted to aerodynamic design, the probability of<br />
instabilities is still at a medium level. However, because the consequences are so great, that this<br />
aerodynamic risk possibilities are still undergoing continuous analysis.<br />
57
Project Final Report – CUDBF April 30 th , 2009<br />
ASEN 4028: <strong>Aerospace</strong> <strong>Senior</strong> <strong>Projects</strong><br />
7.2.2 Avionics<br />
Should the pilot, while operating an in-flight aircraft, lose radio communication to the vehicle<br />
due to Radio Frequency Interference (RFI) the aircraft will crash. However, this probability is<br />
low because of the transmitter selection. Because the operating frequency is 2.4 GHz, no other<br />
radios can operate on the same channel and interfere with the communication with the Buff-2<br />
Bomber. Also the selected transmitter has a programmable failsafe. If for some reason the<br />
communication with the vehicle fails, the receiver will automatically cut throttle and deflect the<br />
control surfaces to bring the aircraft down.<br />
7.2.3 Propulsion<br />
The propulsion sub-team must be most worried about whether or not their selected motor and<br />
battery configuration can propel the aircraft far enough to complete each mission. If the total<br />
range is insufficient to complete four laps at maximum weight, the consequence is no score and<br />
ultimately no chance of winning the competition. Fortunately this is a lower level probability as<br />
much analysis and testing has been done to accurately calculate the actual thrust provided from<br />
the motors. Further mitigation will involve dynamic testing of the entire propulsion system.<br />
7.2.4 Structures<br />
The wingtip hinge design is necessary for the aircraft to fit into the storage container. However,<br />
“breaking” the wing along the span increases the possibility of a catastrophic failure during flight<br />
that results in competition failure and possible endangerment of bystanders. Because of the<br />
mechanical complexity, the wingtip hinge presents the most probable and dangerous risk the<br />
aircraft faces. However, much of the risks associated with this design aspect can and will be<br />
mitigated with extensive ground testing. The overall strength of the hinge system and its ability<br />
to restrict free-play will be optimized before the system is tested in flight.<br />
7.2.5 Missions<br />
Tasked with designing the release mechanism of the wing mounted stores, the missions sub-team<br />
was able to determine their most significant risk to mission success is the possibility of the<br />
release mechanism jamming or failing during the mission. This possibility is mid-to low range<br />
simply because extensive testing will be done on the prototype and final design to ensure that the<br />
mechanism can release the stores with a 95% success rate. Another primary risk is if the rules,<br />
which undergo constant upgrades and explanations, may soon not allow magnetic mechanisms to<br />
hold the payloads to the wing. Although a low risk, this will be mitigated by not abandoning the<br />
mechanical design system and holding it as a backup to the magnetic system.<br />
7.2.6 Microcontroller<br />
Implementing the microcontroller creates additional risks to the overall avionics subsystem. The<br />
microcontroller is only enabled when the pilot gives the appropriate input on the transmitter;<br />
however, it is possible that the microcontroller receives a false reading and activates while the<br />
plane is in flight. The probability of this situation occurring will be fairly low as safety features<br />
58
Project Final Report – CUDBF April 30 th , 2009<br />
ASEN 4028: <strong>Aerospace</strong> <strong>Senior</strong> <strong>Projects</strong><br />
will be coded into software and extensive testing will be performed to determine the likelihood<br />
of the microcontroller receiving a false signal.<br />
59
Project Final Report – CUDBF April 30 th , 2009<br />
ASEN 4028: <strong>Aerospace</strong> <strong>Senior</strong> <strong>Projects</strong><br />
8.0 Mechanical <strong>Design</strong> Elements<br />
Author: Shivali Bidaiah<br />
Co-Author: Ben Kemper, Mark Findley<br />
8.1 Aerodynamics Mechanical <strong>Design</strong> Elements<br />
8.1.1 Aircraft Geometry<br />
The analysis that was done on the effect of static margin with varying sweep angles and varying<br />
taper was used to determine the optimal geometry given the requirement for the aircraft to fit in<br />
the box. In order to have the most room along the wing for control surfaces, the span was chosen<br />
to be 68 inches. This satisfies the minimum wing span requirement of 60 inches. Figure 33<br />
shows the aircraft geometry:<br />
Figure 33: Aircraft Geometry<br />
The analysis done showed that the static margin increased as the sweep angle increased between<br />
20 and 25 degrees. The best possible configuration that meets the requirement to fit in a 4’x2’x2’<br />
box is a leading edge sweep angle of 23 degrees and a taper ratio of 0.5.<br />
Because this project involves flight missions with asymmetric loading in the lateral direction, the<br />
addition of a vertical is necessary. The vertical is the equivalent of a vertical stabilizer and<br />
provides yaw control. Winglets were added to each wing tip to serve the purpose of a vertical<br />
stabilizer. The winglets were sized using the tail volume coefficient method.<br />
The tail volume coefficient method is based off of the sizing of past aircraft. This sizing is based<br />
off of the area of the wing, S w , the wing span, b, the area of the vertical tail, A vt , and the distance<br />
between the c. g. of the aircraft and the aerodynamic center of the vertical tail. The tail volume<br />
coefficient for most aircraft falls in the range of 0.03 to 0.06. A larger tail volume coefficient<br />
60
Project Final Report – CUDBF April 30 th , 2009<br />
ASEN 4028: <strong>Aerospace</strong> <strong>Senior</strong> <strong>Projects</strong><br />
means that the aircraft will be more directionally stable. With the main geometry of the wing<br />
selected, the only parameter to determine is the sizing of the vertical tail. A tail volume<br />
coefficient of 0.04 was used giving the two vertical tails an area of 0.69 ft 2 . The vertical tails are<br />
shaped with a taper ratio of 0.5 and a straight trailing edge. This drove the vertical tails to be<br />
13.25 inches tall. Table 6 summarizes the geometry of the aircraft.<br />
Table 6: Characteristics of Aircraft Geometry<br />
Parameter<br />
Value<br />
Leading Edge Sweep, Λ LE 23 degrees<br />
Quarter Chord Sweep, Λ c/4 19 degrees<br />
Trailing Edge Sweep, Λ TE 7.3 degrees<br />
Span, b 68”<br />
Wing Area, S 7.14 ft 2<br />
Aspect Ratio, AR 4.5<br />
Root Chord, c root 20.16”<br />
Tip Chord, c tip 10.08”<br />
Taper Ratio, λ 0.5<br />
Winglet Height 13.25”<br />
Winglet Taper Ratio, λ v 0.5<br />
Wing Area, S v 0.69 ft 2<br />
8.1.2 Airfoil Selection and Aerodynamic Twist<br />
The airfoil chosen for the root of the aircraft was the HS602. This airfoil was chosen for the root<br />
primarily because it has a thickness to chord ratio of 10.21%. Because this aircraft does not have<br />
a fuselage, the wings will house the batteries, motor mounts, release mechanism mounts, the<br />
servos and the wiring. In order to ensure that these components will be housed in the wing, the<br />
root must have a reasonably thick airfoil.<br />
From a stability standpoint, it is ideal to have an airfoil with a moment coefficient of 0. Of all the<br />
airfoils analyzed, the airfoil that had the smallest moment coefficient was the HS520 airfoil<br />
(Figure 34). Since the HS520 has a thickness to chord percentage of only 8%, it is not the<br />
optimal choice for the root. In order to make a fair trade between the most desirable thickness to<br />
chord percentage that would house most of the components and the airfoil with the best moment<br />
coefficient, an aerodynamic twist was implemented into the design. The root section has the<br />
HS602 airfoil and the tip has the HS520 airfoil with a linear twist between the root and the tip of<br />
the wing. The winglets have the NACA 0010 airfoil; a symmetric airfoil with a 10% thickness to<br />
chord ratio.<br />
61
Project Final Report – CUDBF April 30 th , 2009<br />
ASEN 4028: <strong>Aerospace</strong> <strong>Senior</strong> <strong>Projects</strong><br />
Figure 34: The Tip Airfoil (HS520)<br />
8.1.3 Aircraft Incidence Angle<br />
By definition, the incidence angle on a fixed-wing aircraft is the angle between the chord line of<br />
the wing root where the wing is mounted to the fuselage and the longitudinal axis of the fuselage.<br />
However, on this aircraft, due to the absence of a fuselage, the incidence angle is the angle of<br />
attack. A slight incidence angle is necessary to ensure the necessary takeoff rotation needed<br />
during takeoff. To determine the angle of incidence necessary, the takeoff distance was estimated<br />
using Equation 14<br />
S<br />
LO<br />
2<br />
1.44W<br />
=<br />
ρgC<br />
T<br />
L max<br />
Equation 14: Takeoff Distance Equation<br />
The maximum lift coefficient in the takeoff distance equation corresponds to the angle of attack<br />
or in this case, the incidence angle necessary to meet the takeoff distance requirement. From the<br />
coefficient of lift vs. angle of attack curve for the airfoil selected, at an angle of attack of 0, the<br />
corresponding Cl is ~0.1, and at the stall angle of attack of 13º, the Cl is ~1.4. The lift coefficient<br />
needed to meet the takeoff distance requirement of 100 ft is ~0.7, which corresponds to an<br />
incidence angle of 5 degrees. As a result, a 5 degree incidence angle was implemented into the<br />
design to achieve the rotation and ground roll necessary on takeoff.<br />
8.1.4 Control Surface Sizing<br />
For this airplane, conventional control surfaces (ailerons, elevators and rudders) were chosen.<br />
The aileron sizing was driven by the requirement to fit the airplane in the box. The ailerons were<br />
sized based on the location of the fold on the wings. It is ideal to use the least number of servos<br />
possible in order to reduce weight. In order to eliminate the weight of an additional servo, it is<br />
desirable to limit the length of the aileron by the location of the fold. Figure 35 shows the<br />
location of the fold and the aileron size based on the fold:<br />
62
Project Final Report – CUDBF April 30 th , 2009<br />
ASEN 4028: <strong>Aerospace</strong> <strong>Senior</strong> <strong>Projects</strong><br />
Figure 35: Location of the Fold on the Wing<br />
The percentage of the chord for the control surfaces is important to ensure that the control<br />
surfaces produce the necessary control authority. An upper bound on the chord percentage is<br />
about 30% because flow separation occurs on the wing for larger percentages. The ailerons were<br />
sized to 15” from the wingtip and 30% along the chord.<br />
The rudders were sized so that maximum possible control could be achieved. The rudder was<br />
sized to be the entire length of the vertical with a 0.25” clearance so it would not interfere with<br />
the ailerons. The rudder is 13” long along the winglets and 30% along the chord.<br />
Since pitch control is a concern for flying wing configurations, it is important to ensure that<br />
maximum pitch control is available. The elevator was sized by the ailerons. The elevator is<br />
located between the ailerons, inside of the fold along the wing. The elevator has a constant chord<br />
percentage of 15%. Figure 36 shows the three control surfaces employed by this design:<br />
Figure 36: Control Surfaces on the Aircraft<br />
63
Project Final Report – CUDBF April 30 th , 2009<br />
ASEN 4028: <strong>Aerospace</strong> <strong>Senior</strong> <strong>Projects</strong><br />
In order to guarantee that the designed control surfaces could produce the deflections necessary<br />
to trim the aircraft, analysis was done in AVL. Three cases were setup to determine if the<br />
necessary deflections were feasible. Under the worst case scenario (2 rockets on one wing during<br />
takeoff), the maximum deflection necessary from the rudder was 10 degrees, 15 degrees from the<br />
aileron and 15 degrees from the elevator. The maximum possible deflection is approximately 25<br />
degrees. Flow separation occurs over the wing around 25 degrees of deflection. It is clear that<br />
there is enough margin for deflection for all the control surfaces before flow separation occurs.<br />
8.1.5 Stability Analysis<br />
Stability analysis was done in AVL and in MATLAB, the code can be found in Appendix G.<br />
Non-dimensional stability derivatives were obtained from AVL for three different scenarios that<br />
mirror flight missions. The first scenario simulated a case where the centerline fuel tank is flown<br />
on the airplane for cruise conditions, the second scenario was four rockets on the airplane in<br />
cruise, and the third was the worst case scenario of two rockets on one wing tip. To get a clear<br />
understanding of the aircraft’s stability it is important to analyze stability in the longitudinal and<br />
lateral domains. The longitudinal domain refers to the stability of the aircraft about the axis of<br />
pitch. Lateral stability refers to the stability of the aircraft about the yaw and roll axis.<br />
Stability modes in the longitudinal domain are the phugoid and short period and stability modes<br />
in the lateral domain are roll subsidence, dutch roll and spiral divergence. Stability derivatives<br />
represent an incremental change in a force or moment acting on the aircraft to a corresponding<br />
change in any of the following variables: velocity, angle of attack, side slip angle, bank angle,<br />
pitch angle, pitch rate, roll rate and yaw rate. Because aircraft dynamics is fairly complex, it is<br />
necessary that the equations of motions are linearized to assess stability.<br />
The non dimensional stability derivatives outputted from AVL were dimensionalized in<br />
MATLAB to analyze dimensional stability for different modes in the longitudinal and lateral<br />
directions. Matrix methods were used to solve the set of differential equations to obtain the<br />
stability of the aircraft. The aircraft is modeled as a dynamic system where the system receives<br />
input in the form of control surface deflections implemented by the pilot. Equation 15 shows the<br />
longitudinal equations of motion. The plant that describes this system is represented by Equation<br />
16.<br />
0 − cos <br />
<br />
= + − sin <br />
<br />
0<br />
0 0 1 0<br />
0 0 0<br />
0 − <br />
= <br />
0 0<br />
<br />
0 − 1 0<br />
0 0 0 1<br />
Equation 15: Equations of Motion in Matrix Form for Longitudinal Stability<br />
<br />
= <br />
<br />
Equation 16: Representation of the Dynamic System for Longitudinal Stability<br />
64
Project Final Report – CUDBF April 30 th , 2009<br />
ASEN 4028: <strong>Aerospace</strong> <strong>Senior</strong> <strong>Projects</strong><br />
The eigenvalues of the A matrix are the poles to the dynamic system.<br />
This analysis was performed for the three cases described previously in the longitudinal and<br />
lateral directions. The longitudinal case will be presented first. The poles plotted for the airplane<br />
with the bottle is shown in Figure 37:<br />
0.1<br />
0.08<br />
Longitudinal Stability Modes for the Bottle on the Airplane<br />
Real Roots<br />
Short Period<br />
0.06<br />
0.04<br />
Imaginary<br />
0.02<br />
0<br />
-0.02<br />
-0.04<br />
-0.06<br />
-0.08<br />
-0.1<br />
-7 -6 -5 -4 -3 -2 -1 0 1<br />
Real<br />
Figure 37: Longitudinal Stability Modes for the Bottle on the Airplane<br />
The natural frequency and the period of each of the roots for the longitudinal case for the bottle<br />
are summarized in Table 7:<br />
Table 7: Longitudinal Stability for the Bottle on the Airplane<br />
Bottle on the Airplane-Longitudinal<br />
Mode Roots Time Constant (Real Roots)<br />
Natural Frequency (Complex Conjugates)<br />
Period (sec)<br />
ζ<br />
Real Root -6.04 Time constant 6.04 (1/sec) 0.17 --<br />
Real Root -0.17 Time constant 0.17 (1/sec) 5.88 --<br />
Short Period 0.03±0.10i ω n 0.20 (rad/sec) 31.60 0.005<br />
65
Project Final Report – CUDBF April 30 th , 2009<br />
ASEN 4028: <strong>Aerospace</strong> <strong>Senior</strong> <strong>Projects</strong><br />
The s-plane is a visual representation of the roots of the system to characterize the behavior of<br />
the system. Poles in the right half of the plane are unstable where as poles in the left half of the s-<br />
plane indicates stability.<br />
As seen in Figure 37 and Table 7, the real roots are located on the negative real axis. These roots<br />
are stable and have time constants of 6.04 s -1 and 0.17 s -1 . The short period is slightly unstable.<br />
The period of the short period roots were analyzed to determine if this is a concern. The period<br />
for both short period roots is 31.60 seconds. Since the period for natural instability in the short<br />
period mode is as slow as 31.60 seconds, this indicates that the pilot has 31 seconds to input<br />
control surface response to the system. As a result, this is not an issue.<br />
The analysis in the s-plane for the airplane with four rockets is shown in Figure 38:<br />
0.15<br />
0.1<br />
Longitudinal Stability Modes for Four Rockets on the Airplane<br />
Real Roots<br />
Short Period<br />
0.05<br />
Imaginary<br />
0<br />
-0.05<br />
-0.1<br />
-0.15<br />
-0.2<br />
-8 -7 -6 -5 -4 -3 -2 -1 0 1<br />
Real<br />
Figure 38: Longitudinal Stability Modes for Four Rockets on the Airplane<br />
The natural frequency and period of each of the roots in the longitudinal case for the scenario<br />
with four rockets on the airplane are summarized in Table 8:<br />
66
Project Final Report – CUDBF April 30 th , 2009<br />
ASEN 4028: <strong>Aerospace</strong> <strong>Senior</strong> <strong>Projects</strong><br />
Table 8: Longitudinal Stability for Four Rockets on the Airplane<br />
Four Rockets on the Airplane-Longitudinal<br />
Mode Roots Time Constant (Real Roots)<br />
Natural Frequency (Complex Conjugates)<br />
Period (sec)<br />
ζ<br />
Real Root -7.72 Time constant 7.72 (1/sec) 0.13 --<br />
Real Root -0.19 Time constant 0.19 (1/sec) 5.26 --<br />
Short Period 0.03±0.11i ω n 0.24(rad/sec) 26.23 0.005<br />
For this flight case, there were two real, stable roots which had time constants of 7.72 s -1 and<br />
0.19 s -1 . The short period roots were slightly unstable in this case as well. The period for the<br />
short period roots was calculated to be 26.23 seconds. Again, this is not a concern since the pilot<br />
has enough time to compensate.<br />
The poles plotted in the s-plane for the worst case scenario, i.e. the airplane with two rockets on<br />
one wing is shown in Figure 39:<br />
0.15<br />
0.1<br />
Longitudinal Stability Modes for Two Rockets on the Airplane<br />
Real Roots<br />
Short Period<br />
0.05<br />
Imaginary<br />
0<br />
-0.05<br />
-0.1<br />
-0.15<br />
-0.2<br />
-12 -10 -8 -6 -4 -2 0 2<br />
Real<br />
Figure 39: Longitudinal Stability Modes for Two Rockets on the Airplane<br />
67
Project Final Report – CUDBF April 30 th , 2009<br />
ASEN 4028: <strong>Aerospace</strong> <strong>Senior</strong> <strong>Projects</strong><br />
The natural frequency and period of each of the roots for the longitudinal case for two rockets on<br />
one wing are summarized in Table 9:<br />
Table 9: Longitudinal Stability for Two Rockets on the Airplane<br />
Two Rockets on the Airplane-Longitudinal<br />
Mode Roots Time Constant (Real Roots)<br />
Natural Frequency (Complex Conjugates)<br />
Period<br />
(sec)<br />
ζ<br />
Real Root -10.50 Time constant 10.50 (1/sec) 0.10 --<br />
Real Root -0.19 Time constant 0.19 (1/sec) 5.26 --<br />
Short Period 0.04±0.13i ω n 0.24 (rad/sec) 26.23 0.005<br />
As seen in the preceding figure, there are two real, stable roots. The time constants for these<br />
roots are 10.50 s -1 and 0.19 s -1 . The short period is unstable in this scenario as well, but, it has a<br />
period of 26.23 seconds which is enough time for the pilot to input control.<br />
For lateral stability, the modes concerned are spiral divergence, dutch roll and roll subsidence. In<br />
aircraft design, there exists a tradeoff between spiral divergence and dutch roll stability. The<br />
equations of motion for lateral stability analysis are shown in Equation 17 and the plant that<br />
models the dynamic system is represented in Equation 18:<br />
cos ( − )<br />
<br />
= <br />
0 <br />
<br />
0 1 0 0 <br />
0 <br />
0 0 0<br />
0 1 0 −<br />
= <br />
⁄ <br />
<br />
0 0 1 0<br />
0 − ⁄ 0 1<br />
Equation 17: Equations of Motion in Matrix Form for Lateral Stability<br />
= <br />
Equation 18: Representation of the Dynamic System for Lateral Stability<br />
The visual representation of the poles in the s plane for the three cases described previously are<br />
shown in Figure 40, Figure 41, and Figure 42.<br />
68
Project Final Report – CUDBF April 30 th , 2009<br />
ASEN 4028: <strong>Aerospace</strong> <strong>Senior</strong> <strong>Projects</strong><br />
Lateral Stability Modes for the Bottle on the Airplane<br />
0.1<br />
Roll Subsidence<br />
Spiral Divergence<br />
Dutch Roll<br />
0.05<br />
Imaginary<br />
0<br />
-0.05<br />
-0.1<br />
-0.15<br />
-0.2<br />
-0.8 -0.7 -0.6 -0.5 -0.4 -0.3 -0.2 -0.1 0 0.1<br />
Real<br />
Figure 40: Lateral Stability Modes for the Bottle on the Airplane<br />
The natural frequency and period of each of the roots for the lateral case for the bottle on the<br />
airplane are summarized in Table 10:<br />
Table 10: Lateral Stability for the Bottle on the Airplane<br />
Bottle on the Airplane-Lateral<br />
Mode Roots Time Constant (Real Roots)<br />
Natural Frequency (Complex Conjugates)<br />
Period<br />
(sec)<br />
ζ<br />
Roll Subsidence -0.71 Time constant 0.71 (1/sec) 1.41 --<br />
Spiral Divergence 0.0001 Time constant -0.0001 (1/sec) 10,000 --<br />
Dutch Roll 0.00±0.11i ω n 0.11 (rad/sec) 58.68 --<br />
For the case with the airplane carrying the bottle, the airplane was stable in roll subsidence,<br />
neutrally stable in spiral divergence and barely unstable in dutch roll. The time constant for the<br />
roll subsidence mode was determined to be 0.71 s -1 , and the time constant for spiral divergence<br />
was -0.0001 s -1 and the period for dutch roll was determined to be 58.68 sec and 10,000 seconds<br />
for the spiral divergence. This is clearly not a concern for stability.<br />
69
Project Final Report – CUDBF April 30 th , 2009<br />
ASEN 4028: <strong>Aerospace</strong> <strong>Senior</strong> <strong>Projects</strong><br />
0.06<br />
0.04<br />
Lateral Stability Modes for Four Rockets on the Airplane<br />
Roll Subsidence<br />
Spiral Divergence<br />
Dutch Roll<br />
0.02<br />
Imaginary<br />
0<br />
-0.02<br />
-0.04<br />
-0.06<br />
-1 -0.8 -0.6 -0.4 -0.2 0 0.2 0.4<br />
Real<br />
Figure 41: Lateral Stability Modes for Four Rockets on the Airplane<br />
The natural frequency and period of each of the roots for the lateral case for the four rockets on<br />
the airplane are summarized in Table 11:<br />
Table 11: Lateral Stability for Four Rockets on the Airplane<br />
Four Rockets on the Airplane-Lateral<br />
Mode Roots Time Constant (Real Roots)<br />
Natural Frequency (Complex Conjugates)<br />
Period<br />
(sec)<br />
ζ<br />
Roll Subsidence -0.91 Time constant 0.91 (1/sec) 1.10 --<br />
Spiral Divergence 0.00 -- -- --<br />
Dutch Roll 0.00±0.05i ω n 0.05(rad/sec) 125.7 --<br />
The lateral stability for the case with four rockets on the airplane was not much of a concern<br />
either. This is because the airplane was stable in roll subsidence, neutrally stable in spiral<br />
divergence and very slightly unstable in dutch roll. The time constant for the roll subsidence<br />
mode was 0.91 s -1 , and the period for dutch roll was determined to be 125.7 seconds.<br />
70
Project Final Report – CUDBF April 30 th , 2009<br />
ASEN 4028: <strong>Aerospace</strong> <strong>Senior</strong> <strong>Projects</strong><br />
0.08<br />
0.06<br />
Lateral Stability Modes for Two Rockets on the Airplane<br />
Roll Subsidence<br />
Spiral Divergence<br />
Dutch Roll<br />
0.04<br />
0.02<br />
Imaginary<br />
0<br />
-0.02<br />
-0.04<br />
-0.06<br />
-0.08<br />
-1.2 -1 -0.8 -0.6 -0.4 -0.2 0 0.2<br />
Real<br />
Figure 42: Lateral Stability Modes for Two Rockets on the Airplane<br />
The natural frequency and period of each of the roots for lateral stability for two rockets on one<br />
wing are summarized in Table 12:<br />
Table 12: Lateral Stability for Two Rockets on the Airplane<br />
Two Rockets on the Airplane-Lateral<br />
Mode Roots Time Constant (Real Roots)<br />
Natural Frequency (Complex Conjugates)<br />
Period (sec)<br />
ζ<br />
Roll Subsidence -1.21 Time constant 1.21 (1/sec) 1.10 --<br />
Spiral Divergence 0.001 -0.001 10,000 --<br />
Dutch Roll 0.00±0.065i ω n 0.05 (rad/sec) 96.7 --<br />
The case with two rockets on one wing was also analyzed for lateral stability. This was the worst<br />
case scenario, as mentioned before. Stability for this case was also not an issue because the<br />
airplane was stable in roll subsidence, neutrally stable in spiral divergence and very slightly<br />
unstable in dutch roll. The time constant for the roll subsidence mode was 1.21 s -1 , and the period<br />
for dutch roll was determined to be 96.7 seconds<br />
71
Project Final Report – CUDBF April 30 th , 2009<br />
ASEN 4028: <strong>Aerospace</strong> <strong>Senior</strong> <strong>Projects</strong><br />
As shown in the preceding paragraphs, stability for the designed aircraft configuration will not<br />
be an issue and therefore will not be an obstacle in accomplishing the mission goals.<br />
8.1.6 Drag Analysis<br />
With payloads that don’t seem very aerodynamic such as the water bottle, it is necessary to<br />
ensure that there is enough available thrust to overcome the drag predicted. The drag analysis<br />
was performed in a program called PowerFLOW [15] . PowerFLOW is a computational fluid<br />
dynamics tool used to aid in the analysis and visualization of internal and external flows using<br />
the Lattice-Boltzmann Method (LBM). External 3-dimensional, incompressible flow was used<br />
for the simulations for drag estimates obtained from this tool. PowerFLOW consists of two<br />
modules used to set up a simulation and one used to analyze flow results. The module used to<br />
setup the simulation case is called PowerCASE [16] and the module used to visualize the flow<br />
results is called PowerVIZ [17] .<br />
The drag on the airplane was predicted for the case with four rockets on the airplane, the bottle<br />
on the airplane, the bottle, the rocket, and the airplane without payloads. The drag results from<br />
the bottle and the rocket in a simulation volume were compared to hand calculations to<br />
determine if the results produced by PowerFLOW were reasonable. The results from the drag on<br />
the payload alone as predicted by the software and as calculated by hand are shown in Table 13:<br />
Table 13: Drag Prediction on the Payload Calculated by Hand and in PowerFLOW<br />
Payload Drag (By Hand) Re C D Drag (PowerFLOW)<br />
Rocket 0.082 lb 527473 0.75 0.081 lb<br />
Bottle 1.64 lb 998681 0.85 0.531 lb<br />
As seen in the preceding table, it is clear that the drag estimate was very close for the rocket but<br />
for the bottle, the hand calculation was predicted to be much larger than the result from<br />
PowerFLOW. The purpose of calculating drag by hand was to verify the results from<br />
PowerFLOW and evaluate the discrepancy, if any. The reason that the hand calculation for the<br />
drag on the rocket was so similar to the result obtained from PowerFLOW is because the drag<br />
coefficient for the exact rocket being used was found to be 0.75 [18] .<br />
On the other hand, for the bottle, the drag coefficient was estimated as a cylinder from Horener<br />
[19] . The bottle being used on the airplane is not a perfect cylinder. This is responsible for the<br />
difference in drag estimates for the bottle. Because the drag prediction for the rocket done by<br />
hand was accurate (since the correct drag coefficient was used) and this value was different from<br />
PowerFLOW by 0.001 lb, it is valid to assume that the predictions from PowerFLOW are<br />
accurate with the caveat that the cases were set up correctly.<br />
72
Project Final Report – CUDBF April 30 th , 2009<br />
ASEN 4028: <strong>Aerospace</strong> <strong>Senior</strong> <strong>Projects</strong><br />
The following figure, Figure 43, shows the velocity magnitude around the aircraft with the bottle<br />
during steady level cruise flight. The blue region seen around the bottle indicates that the flow is<br />
significantly slower. Also, from the picture it is clear that the non-streamlined shape of the bottle<br />
creates a significant amount of turbulent flow around the body. The green region around the<br />
entire system shows that the velocity around the entire configuration is reasonably high for this<br />
case (red refers to the highest velocity). It is also interesting to note that the disrupted flow<br />
caused by the bottle does not interfere with the wing. This emphasizes that the selection of the<br />
flying wing configuration was also optimal for aerodynamics. Had there been a tail present, it is<br />
possible that the disrupted flow from the bottle might have affected the flow seen by the tail.<br />
Figure 43: Velocity Magnitude around the Aircraft with the Bottle<br />
Figure 44 shows the streamlines around the aircraft with the bottle. As expected, the streamlines<br />
around the trailing edge of the bottle are not extremely smooth due to the blunt nature of the<br />
bottle.<br />
73
Project Final Report – CUDBF April 30 th , 2009<br />
ASEN 4028: <strong>Aerospace</strong> <strong>Senior</strong> <strong>Projects</strong><br />
Figure 44: Streamlines around the Aircraft with the Bottle<br />
The velocity magnitude around the airplane with four rockets on it is shown in Figure 45. Unlike<br />
the previous case described, the rockets are streamlined and therefore the disrupted airflow<br />
around them does not appear to be as severe. The flow around the trailing edge of the rockets is<br />
the slowest and the flow over the entire system is reasonably high (yellow/orange refers to higher<br />
speeds).<br />
Figure 45: Velocity Magnitude around the Aircraft with the Rockets<br />
The streamlines for the airplane carrying four rockets show that the flow around the entire<br />
system is smooth. This is expected since the airplane and the rockets are streamlined. This is<br />
seen in Figure 46:<br />
74
Project Final Report – CUDBF April 30 th , 2009<br />
ASEN 4028: <strong>Aerospace</strong> <strong>Senior</strong> <strong>Projects</strong><br />
Figure 46: Streamlines around the Aircraft with the Rockets<br />
The drag estimates for the cases with the payloads on the airplane and the airplane without<br />
payload is summarized in Table 14:<br />
Table 14: Predicted System Drag for Flight Missions from PowerFLOW<br />
Flight Mission Reynolds Number Drag<br />
No Payload on Airplane 708923 1.03 lb<br />
4 Rockets on Airplane 708923 1.43 lb<br />
Bottle on Airplane 708923 1.57 lb<br />
2 Rockets on Airplane 708923 1.30 lb<br />
The analysis was set up to simulate cruise at expected flight conditions in the competition site,<br />
Tucson, Arizona. The maximum drag expected is 1.57 lb which is for the case with the bottle on<br />
the airplane. The results make intuitive sense, since the bottle is not streamlined and therefore<br />
disrupts the flow around it, causing more drag than the rockets.<br />
It is expected that the thrust available is more than required to overcome the predicted drag. This<br />
will be described in the propulsion section. Additionally, this drag prediction will be tested in<br />
flight for comparison purposes. This is detailed in the test and verification section.<br />
75
Project Final Report – CUDBF April 30 th , 2009<br />
ASEN 4028: <strong>Aerospace</strong> <strong>Senior</strong> <strong>Projects</strong><br />
8.2 Missions Mechanical <strong>Design</strong> Elements<br />
8.2.1 Wing Store <strong>Design</strong> Element<br />
Although the basic operation of this mechanism was discussed in preliminary design, several<br />
other design considerations had to be made to incorporate the system into a working release<br />
mechanism. The most important of these considerations was the moment that the store CG<br />
would generate on the release mechanism (shown in Figure 1). The CG was placed here to keep<br />
the longitudinal aircraft CG unchanged while the stores are loaded and unloaded. The design<br />
area was limited by physical attachment points located on the underside of the wing.<br />
Figure 47: Store Center of Gravity and Resulting Moment at Mechanism<br />
To allow the wing release mechanism to operate under these conditions, a sliding trigger system<br />
was placed at the forward portion of the allowable design area. At this point, the mechanism<br />
produced a reaction force in the positive Z direction. Towards the rear of the store, the store<br />
mount will actually press up against the underside of the aircraft. Here, a small neodymium<br />
magnet was placed in a pylon that was attached to the store. This magnet wa attracted to an iron<br />
plate in the wing. This will help to decrease load time, keep the store directional aligned with the<br />
aircraft and keep the store secure in negative g-loading flight conditions. To further ensure the<br />
store did not release prematurely, a 1/8” aluminum tab was added to the back of the wooden<br />
store pylon. This tab rests on the inside of the reinforced aircraft skin during negative g-loads.<br />
A diagram of the release system can be seen in Figure 48.<br />
76
Project Final Report – CUDBF April 30 th , 2009<br />
ASEN 4028: <strong>Aerospace</strong> <strong>Senior</strong> <strong>Projects</strong><br />
Figure 48: Wing Store Overview Detailing the Store Release Process<br />
To release, the trigger connecting to the forward connection point releases the store-fixed tab<br />
with a hole for the trigger to slide through. The store then rotates nose down on the rear pylon<br />
due to its CG location. The forward portion of the pylon will increase in distance from the<br />
aircraft as the store pivots. This increased distance decreases the magnetic attraction to the iron<br />
plate embedded in the wing. The store then falls forward as the 1/8” tab slides out of the rear of<br />
the wing. The store clears the aircraft before the nose of the store travels 6” and hits the ground.<br />
The detailed design of the release mechanism consisted of the following: A Tru-Fire bow<br />
release trigger was cut and sized to fit into the aircraft at ½ in tall. Each trigger was rated to<br />
support 100 lbs, far greater than any flight loads. Two 1½ in aluminum L-wedges were placed<br />
on either side of the Tru-Fire trigger and bolted in place. Two of these were located in each wing<br />
with a HS-125MG servo between the pairs. When an inboard or out board store needed to be<br />
released, the servo arm pulled on a Kevlar string attached to each Tru-Fire trigger, causing that<br />
trigger to release the store. Due to the use of a string that only allowed the transfer of tension, an<br />
inboard deployment did not affect an outboard store. The rear store pylons were made of birch<br />
and contained a magnet and an aluminum tab secured to the top of the pylons with epoxy. The<br />
aluminum tab protruded 1/8 in over the rear of the pylon. Each rocket was ballasted to 1.5 lbs<br />
77
Project Final Report – CUDBF April 30 th , 2009<br />
ASEN 4028: <strong>Aerospace</strong> <strong>Senior</strong> <strong>Projects</strong><br />
using 1/32 in diameter copper BBs and the longitudinal CG of the rocket was aligned with that of<br />
the aircraft. Competition rockets employed 1/8 in aluminum fins to ensure that they did not<br />
break on store drops.<br />
The two connection points on each store were located as far apart from one another as possible<br />
on the underside of the wing which effectively reduced the moment holding the store in place.<br />
This meant that the inboard stores experienced a smaller load on the front metal tab and rear<br />
pylon than the outboard stores due to the greater chord length of the wing. This also meant that<br />
each store was unique due to inboard/outboard and left wing/right wing combination<br />
considerations. Each store pylon location was located ½ in from the trailing edge of the aircraft<br />
and remained clear of aileron movement.<br />
8.2.2 Centerline Store<br />
The centerline store utilized two Tru-Fire triggers located on the front and aft sides of the store.<br />
An HS-77BB servo actuator was placed between the two mechanisms and connected to the<br />
release mechanisms with Kevlar string. The servo, string length, and mechanisms were<br />
calibrated to ensure that they release at the same instant, reducing the chance of a jamming<br />
scenario.<br />
.<br />
Figure 49: Left: Store-Fixed Metal Tab; Right: Tru-Fire Trigger Assembly<br />
Each Tru-Fire trigger was mounted to the centerline joiner plate using ½ in aluminum L-wedges<br />
and bolts. 1¼” metal tabs with a hole for the trigger were secured to the store with aluminum<br />
hose clamps wrapped and tightened about the circumference of the bottle. To release, the<br />
centerline servo will rotated counter-clockwise until both triggers released their tabs<br />
simultaneously. Figure 50 shows the centerline release design.<br />
78
Project Final Report – CUDBF April 30 th , 2009<br />
ASEN 4028: <strong>Aerospace</strong> <strong>Senior</strong> <strong>Projects</strong><br />
Figure 50: Isometric view of Centerline Store and Release Mechanism<br />
8.2.3 Box <strong>Design</strong><br />
Due to the fact that the box weights were counted in the total system weight, they must be made<br />
as light as possible while at the same time strong enough to withstand a 6 inch drop during the<br />
competition technical inspection. Balsa was again chosen as the primary construction material<br />
for the aircraft box, due to its high strength to weight ratio. In order to increase the box strength<br />
even further, the isogrid structure shown in Figure 51 lent its inherent strength to the box and<br />
was able to distribute loads throughout the entire container. For the bottle box, thick hollowed<br />
foam was used for its ability to restrain the payload on all sides and withstand the shock during<br />
the drop test.<br />
Figure 51: Box Isogrid Structure<br />
79
Project Final Report – CUDBF April 30 th , 2009<br />
ASEN 4028: <strong>Aerospace</strong> <strong>Senior</strong> <strong>Projects</strong><br />
Foam inserts mounted around the spaces reserved for the aircraft components further ensure no<br />
damage came to the aircraft or its elements during the drop test. Together, the entire balsa and<br />
foam structure was projected to weigh 3.1lb. Once the structure and materials were finalized,<br />
COSMOSWorks [20] was used to determine whether or not the structure could feasibly pass the<br />
6in drop test without significant damage to the box, or damage to any aircraft components stored<br />
inside. Figure 52 shows the results of the computer design which showed that the box would<br />
indeed survive the drop. In case, during testing, the box did fail due to imperfect manufacturing<br />
(especially on the corners), wedges made from a composite material added to the box sides<br />
would further increase the strength without significantly adding to overall container weight.<br />
Figure 52: Box Drop Test Analysis Using COSMOSWorks<br />
8.3 Propulsion Mechanical <strong>Design</strong> Elements<br />
8.3.1 Motor Selection<br />
The Neu 1100 series motors are custom built electric brushless motors capable of handling<br />
between 50 and 1500W of power. They are designed to spin as fast as 60,000 rpm. The motor<br />
needed to be able to handle 400W of continuous power, with 800W short bursts for takeoff. The<br />
motor also needed to have a low enough rpm/V such that the motor will not exceed 60,000rpm<br />
with 21.6 V. Table 15 shows the motor model options considered.<br />
Table 15: Motor Selection<br />
Neu Motor RPM / V Continuous<br />
Watts<br />
Maximum<br />
Watts<br />
Weight (g)<br />
1107 2.5Y 2750 300 600 90<br />
1110 1.5Y 3350 400 800 114<br />
1110 2Y 2500 500 1000 114<br />
1112 1.5Y 2900 600 1200 138<br />
80
Project Final Report – CUDBF April 30 th , 2009<br />
ASEN 4028: <strong>Aerospace</strong> <strong>Senior</strong> <strong>Projects</strong><br />
The Neu 1110 2Y motor was chosen because it meets all the requirements at the lightest weight.<br />
In order to increase the torque provided by the motors and increase the efficiency at cruise, the<br />
motor is geared using a gearbox. The two options available for the Neu 1110 motor are a 4.4:1<br />
and 6.7:1 gearbox. According to Electricalc [21] ,amp draw by the Neu 1100 motor using a 4.4:1<br />
gearbox is 60 amps compared to a 24 amp draw with a 6.7:1 gearbox. Since the propulsion<br />
system was designed to utilize up to 40 amps per motor, the 6.7:1 gearbox was eliminated.<br />
Therefore a 4.4:1 gearbox was chosen to provide more torque and increase the efficiency of the<br />
motor at cruise. The motor and gearbox can be seen in Figure 53.<br />
Figure 53: Neu Motor and Gearbox<br />
8.3.2 Propeller<br />
The propeller choice was driven by the requirement to produce enough thrust in order to make<br />
the 100ft takeoff while providing the most efficiency at cruise. The limiting factor in the overall<br />
propeller size was ground clearance. The main landing gear were designed to be 7” long,<br />
allowing the 5.75” water bottle to be stored under the wing while maintaining approximately 1”<br />
of clearance from the ground. Due to the 5° incidence angle from the nose gear, the ground<br />
clearance available for the propeller is 8”. In order to reduce the overall landing gear size and<br />
weight, the size of the propeller was limited to 14”. This allows the propeller to spin freely while<br />
still maintaining 1” of clearance from the ground. The 1” of ground clearance from the propellers<br />
are sufficient even during a crosswind landing since the propeller is inboard of the landing gear.<br />
Thin electric propellers with diameters from 12-14” and of all different pitch were considered.<br />
The lower the propeller pitch, the more static thrust is generated on takeoff. However, the higher<br />
the propeller pitch, the more efficient the propeller is at cruise. The propeller sizes shown in<br />
Table 16 were tested at the maximum theoretical power of 800W (20V and 40 amps per motor<br />
(80 amps total)) which can be obtained from the battery pack. It is important to note that while<br />
the battery pack can deliver up to a total of 80 amps (40 amps per motor), the propulsion system<br />
was sized based upon the assumption that a maximum of 60 amps can be obtained. The battery<br />
pack can only deliver 80 amps immediately after charging (while the battery pack is still hot).<br />
However, due to the unknown waiting time at the competition flight line, the battery pack may<br />
not be used for up to 30 minutes of it being charged, consequently reducing the maximum amp<br />
draw to 60 amps. In order to generate the required thrust of 8.0lbs total at only 60 amps, each<br />
motor must be able to produce 5.33 lbs at 40 amps.<br />
81
Project Final Report – CUDBF April 30 th , 2009<br />
ASEN 4028: <strong>Aerospace</strong> <strong>Senior</strong> <strong>Projects</strong><br />
Table 16: Propeller Options<br />
Propeller<br />
Diameter (in)<br />
Propeller<br />
Pitch<br />
Maximum<br />
Thrust (lb)<br />
12 6 5.37<br />
12 12 4.30<br />
13 6.5 5.06<br />
13 10 4.78<br />
14 7 5.87<br />
14 12 4.65<br />
The only propellers that met the minimum thrust requirement were the 12in x 6 and the 14in x 7<br />
propellers. The 14in x 7 propellers, shown in Figure 54, was chosen because it provides the<br />
maximum amount of static thrust. With a designed maximum power draw of 1200W, dual<br />
motors utilizing 14in x 7 propellers can produce up to 8.81 lbs of static thrust, enough to make<br />
the 100ft takeoff distance.<br />
Figure 54: 14 x 7 APC-E Propeller<br />
8.4 Structures Mechanical <strong>Design</strong> Elements<br />
8.4.1 Wing Bending Model<br />
Analysis for the deflections and stresses acting on the wing due to lifting loads was performed<br />
using hand calculations and confirmed by COSMOSWorks simulations. The distributed force<br />
acting on the beam was estimated using the Treffitz plot and strip forces representing a 3.5g load<br />
determined from AVL. Many of the structures analysis was checked with Dr. Maute, a team<br />
advisor [22] . The near parabolic shape was inserted into MATLAB and a 2 nd order polynomial<br />
function was best fit to the lift distribution. This function can be seen in Equation 19.<br />
() = −0.001 + 0.0215 + 0.807<br />
Equation 19: Lift Distribution Estimation<br />
82
Project Final Report – CUDBF April 30 th , 2009<br />
ASEN 4028: <strong>Aerospace</strong> <strong>Senior</strong> <strong>Projects</strong><br />
Using the 4 th order integration method on Equation 19 produces the following functions for the<br />
total displacement, displacement slope, moment, and shear force. These can be seen in Equation<br />
20, Equation 21, Equation 22, and Equation 23, respectively. The code for this can be found in<br />
Appendix H.<br />
() = − 0.001<br />
3 + 0.0215 + 0.807 + <br />
2<br />
Equation 20: Shear Force Distribution<br />
() = − 0.001<br />
12 + 0.0215 + 0.807 + + <br />
6<br />
2<br />
Equation 21: Bending Moment Distribution<br />
() = − 0.001<br />
60 + 0.0215<br />
24 + 0.807<br />
6 + 2 + + <br />
Equation 22: Displacement Slope Distribution<br />
() = − 0.001<br />
360 + 0.0215<br />
120 + 0.807<br />
24 + 6 + 2 + + <br />
Equation 23: Displacement Distribution<br />
Applying boundary conditions of a fixed restraint at the wing root and a free end at the wingtip,<br />
the following boundary conditions are produced.<br />
2 = 0; 2 = 0<br />
(0) = 0; (0) = 0<br />
Equation 24: Boundary Conditions for Wing Bending<br />
Using these boundary conditions, the integration constants from the previous equations are<br />
computed in Equation 25.<br />
= 0.001 <br />
3 2 <br />
= 0.001<br />
12 2 <br />
− 0.0215 <br />
2 2 − .807 2 <br />
− 0.0215 <br />
2 2 − .807 <br />
2 − 2 <br />
= 0; = 0<br />
Equation 25: Constants of Integration<br />
83
Project Final Report – CUDBF April 30 th , 2009<br />
ASEN 4028: <strong>Aerospace</strong> <strong>Senior</strong> <strong>Projects</strong><br />
To determine the moment of inertia for the airfoil cross-section, a few assumptions were<br />
made. To simplify the cross-sectional shape, the foam was neglected and a thin-walled ellipse of<br />
balsa was selected as seen in Figure 55.<br />
Figure 55: Thin-Walled Ellipse<br />
Since the taper and sweep are not considered, the mean aerodynamic chord of 16.6 inches was<br />
selected as the semi-major axis. The semi-minor axis was defined as the airfoil thickness at the<br />
mean aerodynamic chord. The average thickness-to-chord ratio of 0.9 was used to give the semiminor<br />
axis a value of 0.375 inches (0.75 for the entire thickness). Using the balsa thickness of<br />
1/32 inch, Equation 26 produces the moment of inertia [23] of approximately 0.7 in 4 .<br />
= 4 1 + 3<br />
<br />
Equation 26: Moment of Inertial for Thin Walled Ellipse<br />
8.4.2 Wing Material Selection<br />
The wing design materials were selected to minimize overall weight while still meeting the<br />
minimum wing design-to-specifications. A foam-core made of EPS foam (Expanded<br />
Polystyrene Foam) was selected after the foam-core and skin composite construction technique<br />
was selected over the traditional rib and spar construction. Additional analysis was done in order<br />
to select an optimum skin material from balsa, fiber-glass, or carbon fiber. The most significant<br />
resource employed in the skin material selection process was a Young’s modulus vs. Density<br />
Ashby plot [24] .The two significant Ashby charts are displayed within Figure 56 and Figure 57,<br />
the balsa and composites Ashby charts respectively.<br />
84
Project Final Report – CUDBF April 30 th , 2009<br />
ASEN 4028: <strong>Aerospace</strong> <strong>Senior</strong> <strong>Projects</strong><br />
Figure 56: Balsa Ashby Chart<br />
Figure 57: Composites Ashby Chart<br />
The wing root stress was computed using the Treffitz plot and Equation 19 once more. After<br />
determining the minimum required material strength from the wing bending analysis, a minimum<br />
85
Project Final Report – CUDBF April 30 th , 2009<br />
ASEN 4028: <strong>Aerospace</strong> <strong>Senior</strong> <strong>Projects</strong><br />
skin thickness was calculated for each of the three materials. Using the minimum thickness,<br />
wing area, and the material density, a wing skin weight was estimated. The estimated wing skin<br />
weights for each material are provided within Table 17.<br />
Table 17: Wing Skin Material Comparison<br />
Property EPS Foam Balsa Fiberglass Carbon Fiber<br />
(w/ the grain) (E-Fiber) (with epoxy)<br />
Tensile Strength 16 psi 566 psi 250,200 psi 602,000 psi<br />
Young’s Modulus 435 psi 261 ksi 1,595 ksi 14,500 ksi<br />
Density 0.0006 lb/in³ 0.0032 lb/in³ 0.0939 lb/in³ 0.065 lb/in³<br />
Weight per wing 0.280 lb 0.0834 lb 0.7737 lb 0.5356 lb<br />
It should be pointed out that the Young’s modulus for both fiber-glass and carbon fiber are<br />
orders of magnitude higher than balsa, resulting in a minimum required thickness far thinner than<br />
what could actually be applied with epoxy. Both fiber-glass and carbon fiber thickness were<br />
then estimated as the thinnest possible for the team to apply, approximately 0.06 inches. After<br />
computing the skin weights from these thicknesses, it was determined that the much higher<br />
density of both composite materials far outweighed the balsa. These thicknesses were the<br />
minimum required to meet the strength requirements, and due to physical practicalities the<br />
composite materials are over designed for this aircraft. Since wing weight is a significant design<br />
driver, balsa sheeting was selected because it satisfies the strength requirements and weighs the<br />
least of the three materials.<br />
8.4.3 Wing Stress Analysis<br />
Using the Young’s Modulus for the balsa skin, the maximum deflection of the wing is 0.62<br />
inches. This value was then compared later to a COSMOSWorks FEM model in order to<br />
validate a proper COSMOSWorks study.<br />
The COSMOSWorks simulations were simulated using the half wing span from the Solidworks<br />
models [25] . This model varies from the hand calculations due to the balsa sheeting and foam<br />
core analysis (rather than just the balsa). Other changes include the removal of control surfaces<br />
and the addition of the propulsion motor reinforcement due to its large size. The restraint for the<br />
study was defined as fixed at the root and the load was defined by the parabolic 3.5 g lift<br />
distribution shown in Equation 19. The COSMOSWorks results for URES displacement is<br />
0.4957 inches. The discrepancy between the hand calculation and COSMOSWorks result is<br />
25%. This error can be attributed to extra stiffness in the wing due to the addition of the foam<br />
core. Equation 20 below shows the displacement distribution results for the entire wing half.<br />
86
Project Final Report – CUDBF April 30 th , 2009<br />
ASEN 4028: <strong>Aerospace</strong> <strong>Senior</strong> <strong>Projects</strong><br />
Figure 58: Wing Displacement Distribution<br />
Upon acceptance that the run case in COSMOSWorks produced accurate results, stress<br />
distributions can be used to determine the maximum stress acting on the wing and if unexpected<br />
stress concentration are developed. Figure 59 below shows the Von Mises stress distribution for<br />
the wing half.<br />
Figure 59: Von Mises Stress Distribution<br />
87
Project Final Report – CUDBF April 30 th , 2009<br />
ASEN 4028: <strong>Aerospace</strong> <strong>Senior</strong> <strong>Projects</strong><br />
The maximum stress from COSMOSWorks produces a stress of 951.1 psi at a stress<br />
concentration close to the wing root. This is expected due to the maximum bending moment at<br />
the root. Using the balsa tensile yield strength of 2,900psi, the minimum safety factor of the<br />
wing is 3.05. The wing also shows a stress drop across the motor mount.<br />
8.4.4 Folding Wing System<br />
The ability of the aircraft to fit into the 2ft x 2ft x 4ft box is feasible only with a well designed<br />
folding wingtip that can withstand the forces along the wing, minimize vibrations, and fold<br />
enough to allow the aircraft ample storage room within the required space. The final wing<br />
folding design can be seen in Figure 60.<br />
Figure 60: Wingtip Hinge <strong>Design</strong><br />
First, the hinge selected. A traditional cabinet hinge, a concealed Half-Mortise/Integral hinge,<br />
was used for its ability to provide a degree of pre-stress to the wingtip to minimize excessive<br />
movement during flight. Figure 61 shows the integral hinge [26] .<br />
Figure 61: Integral Hinge<br />
When the hinge is folded, the spring forces the moving parts into the recessed cavity in the door<br />
leaf. This allows the hinge to pull the wingtip into the main section of the wing. Both the tip<br />
and main section are lined along the edge by rubber sheeting. When pressed together, free-play<br />
in the hinge system is mitigated by the pre-stress and frictional force enacted by the rubber<br />
bushing.<br />
88
Project Final Report – CUDBF April 30 th , 2009<br />
ASEN 4028: <strong>Aerospace</strong> <strong>Senior</strong> <strong>Projects</strong><br />
The hinge is connected to a long balsa spar that runs through most of the length of the wingtip.<br />
This spar rigidly connects the wingtip to the main body, and distributes the load along the wing.<br />
It is screwed into the integral hinge and glued into the underside of the wingtip foam.<br />
Since the door leaf has a relatively small surface area and is metal, it is not feasible to glue this<br />
into the foam itself. Rather, the hinge is screwed into the balsa mount, which is then glued into<br />
the foam. The balsa mount increases the surface area where the forces on the hinge are<br />
distributed, increasing the overall load the entire wingtip hinge system can withstand. The balsa<br />
mount itself is shown in Figure 62, and the actual placement in the wing can be seen in Figure<br />
60.<br />
Figure 62: Balsa Mounting Block<br />
Finally, in order to increase the strength of the hinge in the direction that it opens as well as<br />
provide more pre-stress to the rubber sheeting, a small clasp was fastened to the trailing edge<br />
side of the hinge, seen in Figure 60. This limits movement even further and strengthens the<br />
entire system to withstand the loads expected.<br />
8.4.5 Landing Gear Positioning and Stability<br />
The Buff-2 Bomber must be stable and controllable while on the ground because of the<br />
possibility of extended ground taxi during the missions. To that end, the main landing gear was<br />
placed far apart on the aircraft to provide longitudinal and lateral stability as seen in Figure 63.<br />
The nose wheel is 1.5 inches behind the nose and the main gear wheels were 13 inches aft of the<br />
nose and 17 inches outboard of the aircraft centerline. The landing gear placement is show in<br />
Figure 63.<br />
89
Project Final Report – CUDBF April 30 th , 2009<br />
ASEN 4028: <strong>Aerospace</strong> <strong>Senior</strong> <strong>Projects</strong><br />
Figure 63: Landing Gear Placement<br />
8.4.6 Longitudinal and Lateral Ground Stability:<br />
Longitudinal stability is determined by the angle from the main gear to the aircraft center of<br />
gravity as seen in Figure 64.<br />
Figure 64: Longitudinal Stability<br />
In order for stability to be assured, this angle must not be less than 15°, or else the plane will<br />
tend to nose into the ground, prompting a propeller strike on landing or even during taxi. The<br />
aircraft may also tip backwards under the same conditions, rendering ground control impossible.<br />
With the current landing gear placement, the angle for the Buff-2 Bomber is 20°, giving the<br />
vehicle ample stability in the longitudinal direction.<br />
Lateral stability depends on the angle ψ which is seen in Figure 65. In order to be statically<br />
stable (i.e. when not in motion) the angle ψ must be under 90°. Because the Buff-2 Bomber has<br />
a lateral stability angle of 85° under the worst loading case (two rockets on one wing), the<br />
aircraft achieves lateral stability in all circumstances (lateral stability was calculated using AAA<br />
[27] ).<br />
90
Project Final Report – CUDBF April 30 th , 2009<br />
ASEN 4028: <strong>Aerospace</strong> <strong>Senior</strong> <strong>Projects</strong><br />
Figure 65: Lateral Stability Angle Definition<br />
Once the ground stability was guaranteed, the total load applied on each gear strut was<br />
determined using the following equations. The determined gear loading values are provided in<br />
Table 18, including the final weight percentage that each strut carries during the worst loading<br />
scenario.<br />
= <br />
+ <br />
Equation 27 - Nose Gear Load<br />
=<br />
<br />
( + )<br />
Equation 28 - Main Gear Load<br />
% = <br />
<br />
100<br />
Equation 29 - Weight Distribution Percent on the Nose Gear<br />
% = <br />
<br />
100<br />
Equation 30 - Weight Distribution Percent on the Main Gear<br />
91
Project Final Report – CUDBF April 30 th , 2009<br />
ASEN 4028: <strong>Aerospace</strong> <strong>Senior</strong> <strong>Projects</strong><br />
Table 18: Calculating the Load on Each Strut<br />
Parameter Variable Value Units<br />
Length from main gear to CG l m 4.00 inches<br />
Length from nose gear to CG l n 7.50 inches<br />
Takeoff Weight W to 14.00 lbs<br />
Number of main gear struts n s 2 none<br />
Load on the nose gear strut P n 4.87 lbs<br />
Load on each main gear strut P m 4.57 lbs<br />
Percent of takeoff weight carried by the nose gear %W n 34.78 %<br />
Percent of takeoff weight carried by the main gear %W m 65.22 %<br />
8.4.7 Main Gear Loading Analysis<br />
The strength of the main gear for the Buff-2 Bomber was determined by analyzing both a beam<br />
deflection and beam buckling case for the horizontal and vertical forces seen during landing.<br />
These forces were due to the friction between the wheel and the landing strip (calculated with a<br />
coefficient of friction 0.2 of to be 9lbs) and the impact force seen when the aircraft first touches<br />
down (found to be 54lbs), as Figure 66 clarifies. Note that the main gear struts are angled at 80°,<br />
increasing the overall length to 7.1 inches to preserve the 7 inches clearance of the aircraft. P N is<br />
the impact load normal to the runway, and P S is the frictional load applied due to rolling friction.<br />
This angle was done to extend the landing gear span while at the same time anchoring the gear to<br />
a thick portion of the wing to prevent the structure from tearing out during landing.<br />
Figure 66: Main Gear with Applied Loads<br />
Figure 67 shows the beam deflection case Free Body Diagram (FBD).<br />
92
Project Final Report – CUDBF April 30 th , 2009<br />
ASEN 4028: <strong>Aerospace</strong> <strong>Senior</strong> <strong>Projects</strong><br />
Figure 67: Beam Deflection Analysis<br />
The maximum allowable deflection of the beam, set to 0.5in, allows the beam to be analyzed to<br />
determine the minimum radius of a number of materials, including the final selected Al 2024.<br />
Knowing the deflection as well as the supposed 3g maximum load on the landing gear (assuming<br />
heaviest aircraft weight of 14lbs), Equation 31 was twice integrated to solve for the required<br />
radius of the aluminum strut. The final solution is seen in Equation 32. These equations were<br />
obtained from Vable [28] .<br />
Equation 31: Second Order Moment Differential Equation<br />
Figure 68 shows the beam buckling case FBD.<br />
Equation 32: Minimum Radius for the Deflection Case<br />
Figure 68: Beam Buckling Case<br />
93
Project Final Report – CUDBF April 30 th , 2009<br />
ASEN 4028: <strong>Aerospace</strong> <strong>Senior</strong> <strong>Projects</strong><br />
A simply supported beam was analyzed, fixed at one end with a load P applied at the free tip of<br />
the beam. From Vable, the critical load experienced by the beam (i.e. the maximum amount of<br />
force the column can take before it buckles) is known and seen in Equation 33. Simply<br />
rearranging the critical load equation, knowing the moment of inertia for a cylinder, the radius<br />
can be solved for as in Equation 34. The code is provided in Appendix I.<br />
Equation 33: Beam Buckling Critical Load<br />
Equation 34: Minimum Radius for the Buckling Case<br />
The analysis of these different beam cases under the same applied forces proved the deflection of<br />
the landing gear to be of the higher concern. Thus Equation 32 showed the minimum diameter<br />
for the Al 2024 material properties was 0.2 inches. In order to both add a safety factor while at<br />
the same time easing the manufacturing of the landing gear, the final selected landing gear<br />
diameter is the readily available 0.25 inch diameter Al 2024.<br />
Once the landing gear was sized, it needed to be integrated into the aircraft structure in such a<br />
way that the risk of tearing out of the wing was mitigated. The strut is to be attached to a<br />
plywood plate using two small brackets that strap to the strut structure. The two brackets, seen<br />
in Figure 69, will then be screwed into the plywood plate.<br />
Figure 69: Two View of the Landing Gear Structure<br />
94
Project Final Report – CUDBF April 30 th , 2009<br />
ASEN 4028: <strong>Aerospace</strong> <strong>Senior</strong> <strong>Projects</strong><br />
The plywood plate distributes the force received on the landing gear into the foam body. This<br />
prevents puncture through the body and gives the strut a solid anchor into the aircraft. In order<br />
to minimize the potential of the screws shearing out of the plywood mount, a T-nut will be<br />
employed on top of the screws. This forces the screws into a metal-on-metal connection,<br />
strengthening the bond, and also distributing the load acting on each screw over a larger area of<br />
the plywood.<br />
8.4.8 Nose Gear Selection<br />
The nose gear was required to attach to a servo to control steering. Due to this required<br />
connection, a common commercial off the shelf nose gear strut was selected. The spring steel<br />
nose gear strut, along with servo control, is mounted to an aluminum T-bar wing joiner as shown<br />
in Figure 70. This nose gear strut is angled forward to move the mounting T-bar further back in<br />
the wing. The strut is 7 inches in height and mounts to the same aircraft wheels as the main gear.<br />
The steel material makes this nose gear strut stronger than the main gear struts with some degree<br />
of flexibility and allows for a thinner diameter. Due to the superior strength properties of steel<br />
and the higher quality associated with COTS gear struts, it was determined that this gear strut<br />
was adequate for the landing design-to-specifications.<br />
Figure 70: COTS Nose Gear Assembly<br />
95
Project Final Report – CUDBF April 30 th , 2009<br />
ASEN 4028: <strong>Aerospace</strong> <strong>Senior</strong> <strong>Projects</strong><br />
8.4.9 Motor Mount<br />
The motor and propulsion systems were designed to attach to the foam wing. A mounting<br />
system that integrates into the wing was designed in order to accomplish this. This mounting<br />
system consists of four major components. The motor is the first component and attaches<br />
directly into the motor pylon, the second component, as shown in Figure 71. Simple M2.6<br />
machine screws and aluminum strap are used to secure the main motor body to the pylon. A<br />
motor pylon was required in order to maintain necessary propeller clearance on a swept wing.<br />
The motor pylon is to be made from 0.02 inch 2024 aluminum sheet formed such that it was 6.5<br />
inches long and 1.2 inches in width.<br />
Figure 71: Motor and Motor Pylon System<br />
The motor and pylon assembly then integrates into the third component which is a balsa hard<br />
mount that is installed into the wing structure. The wing itself makes the fourth and final<br />
component of the motor mounting system. In addition to accommodating the motor, the<br />
aluminum pylon in the airflow also acts as an effective heat sink for both the attached motor and<br />
speed controller. The integration of the motor pylon into the balsa hard mount and into the wing<br />
itself is shown in Figure 72. This balsa insert was designed to distribute the propulsion system’s<br />
load into a large surface area of the wing foam-core and balsa skin. The motor pylon requires a<br />
hard point to bolt onto because the foam does not provide adequate structural support. The pylon<br />
and balsa insert are bolted together using four light ¼ inch nylon bolts through the holes seen in<br />
Figure 72. Lastly, the balsa insert is glued into a slot cut from the wing before the wing is<br />
sheeted with the balsa skin. Wire access to the motor is provided by a tunnel bored through the<br />
foam and balsa to the pylon.<br />
96
Project Final Report – CUDBF April 30 th , 2009<br />
ASEN 4028: <strong>Aerospace</strong> <strong>Senior</strong> <strong>Projects</strong><br />
Figure 72: Motor Mount System Integrated into the Wing<br />
8.4.10 Motor Mount Loading Analysis<br />
To ensure that the motor mount is capable of supporting the stresses encountered in flight, a<br />
loading analysis was done using COSMOSWorks. The wing and balsa attachment was<br />
determined to be strong enough due to the use of both glue and the wing skin to hold the balsa<br />
insert in place. A stress analysis of the motor on the pylon was done to assure the design of the<br />
pylon was structurally sufficient. A static load of 6 pounds was applied from the motor to the<br />
pylon, with the nylon bolts serving as the only restraint. The 6 pound load is the highest<br />
expected thrust from any propeller configuration with the motor. The results of the<br />
COSMOSWorks analysis can be seen in Figure 73. A maximum stress of 18.7 ksi was located at<br />
the nylon bolt holes shown in close-up within Figure 74. However the yield stress of aluminum<br />
2024 is 58 ksi, which creates a minimum 3.1 safety factor in the pylon design. A strain analysis<br />
was also done on the entire motor pylon assembly, shown in Figure 75, and it was confirmed that<br />
all strain deflections were negligible in magnitude.<br />
97
Project Final Report – CUDBF April 30 th , 2009<br />
ASEN 4028: <strong>Aerospace</strong> <strong>Senior</strong> <strong>Projects</strong><br />
Figure 73: Stress Analysis on Motor and Pylon Assembly<br />
Figure 74: Maximum Stress on Motor and Pylon Assembly<br />
98
Project Final Report – CUDBF April 30 th , 2009<br />
ASEN 4028: <strong>Aerospace</strong> <strong>Senior</strong> <strong>Projects</strong><br />
Figure 75: Motor Pylon Strain and Deflection<br />
Next, another COSMOSWorks analysis was done on the stresses applied to the motor, pylon,<br />
balsa insert, and nylon screw assembly to factor in the balsa mount’s material strength. The<br />
results from the entire motor mount assembly analysis are provided in Figure 76. It was<br />
determined that the maximum stress encountered on the balsa insert was only 210 psi. Balsa<br />
wood has a minimum compressive strength of 377 psi, so there is a minimum 1.8 safety factor in<br />
this component. The maximum stress encountered among the four nylon screws was 4.5 ksi.<br />
The yield stress for the nylon bolts is 20.1 ksi, creating a minimum 4.5 safety factor in the bolt<br />
components. Each component was determined to have adequate safety factor built into the<br />
component design, and the motor mount assembly was determined to be structurally sound.<br />
Figure 76: Motor Mount Maximum Stresses<br />
99
Project Final Report – CUDBF April 30 th , 2009<br />
ASEN 4028: <strong>Aerospace</strong> <strong>Senior</strong> <strong>Projects</strong><br />
9.0 Electrical <strong>Design</strong> Elements<br />
Author: Brett Miller<br />
Co-Author: Jarryd Allison, Ross DeFranco<br />
9.1 Propulsion Electrical <strong>Design</strong> Elements<br />
9.1.1 Propulsion Electrical Overview<br />
The diagram shown in Figure 77 shows an overview of the propulsion electrical system required<br />
to produce thrust to power the aircraft.<br />
Figure 77: Propulsion Electrical Block Diagram<br />
For the pilot to control the amount of thrust, a signal is sent from the transmitter to the receiver.<br />
The signal flows from the receiver, where it is split in two different directions, and flows to each<br />
speed controller. The speed controllers then draw power from the battery pack and through the<br />
40 amp fuse. The power then splits and flows to each motor, which spins the propeller, and that<br />
produces thrust.<br />
9.1.2 Propulsion Batteries<br />
The battery selection was one of the most important processes for the aircraft. The battery pack<br />
itself will end up being the heaviest single components in the aircraft, with an estimated weight<br />
of 1.2lbs. The battery chemistry was limited to NiCad or NiMH chemistry by competition rules.<br />
A trade study was conducted comparing top of the line 1400mah NiCad and NiMH batteries to<br />
determine the best choice for the aircraft as shown in Table 19. Lowest weight, lowest internal<br />
resistance, and the highest recommended maximum continuous discharge were considered for<br />
each cell.<br />
100
Project Final Report – CUDBF April 30 th , 2009<br />
ASEN 4028: <strong>Aerospace</strong> <strong>Senior</strong> <strong>Projects</strong><br />
Table 19: Battery Options<br />
NiCad Sanyo<br />
KR 1400AE<br />
NiMH Intellect<br />
IB 1400<br />
Weight (g) 31 27<br />
Internal Resistance (mΩ) 10 4<br />
Maximum Continuous<br />
Discharge (amps)<br />
10 20<br />
In all categories, the NiMH battery chemistry outperformed the NiCad battery for this<br />
application. Therefore, NiMH chemistry battery cells were chosen for the aircraft.<br />
With the battery chemistry chosen, several specific batteries were analyzed in a trade study to<br />
choose the exact battery cell. The battery needed to be able to discharge up to 40 amps of current<br />
continuously, with 80 amps in short bursts. The most important factor in choosing the battery<br />
was energy density. Four top of the line 1.2V NiMH batteries were analyzed in the trade study<br />
provided in Table 20. The Elite 1500 battery was chosen because it had offered the most<br />
capacity at the least weight.<br />
Table 20: NiMH Battery Selection<br />
Image<br />
IB 1400 Elite 1500 Elite 1700 GB 2000<br />
Capacity (mAh) 1400 1500 1700 2000<br />
Weight (grams) 27.5 25 28.5 36.5<br />
Density (mAh /g) 50.9 60 59.6 54.8<br />
The battery pack was sized in order to meet two requirements; 100ft takeoff and four lap range<br />
with full water bottle payload weight. In order to generate the required thrust in order to make<br />
the 100ft takeoff, the battery pack must be able to generate 1200W of power. The battery pack is<br />
capable of discharging at up to 80 amps if it is taken directly off the charger and used within 10<br />
minutes of being charged while it is still hot. However, due to the unknown timing of the<br />
competition flight line, there may be up to a 30 minute wait from when the battery is taken off<br />
the charger until takeoff. That would limit the maximum amp draw to approximately 60 amps.<br />
Using the equation P=I*V, the battery pack voltage for takeoff must be at least 20V. Assuming<br />
€<br />
101
Project Final Report – CUDBF April 30 th , 2009<br />
ASEN 4028: <strong>Aerospace</strong> <strong>Senior</strong> <strong>Projects</strong><br />
a battery voltage of 0.9V/cell on takeoff, there must be at least 22 batteries in order for the<br />
aircraft to make the 100ft takeoff distance.<br />
Next, the amount of battery cells required to make the four lap range with the full water bottle<br />
payload was calculated. The cruise power draw required for the full water bottle payload was<br />
assumed to be 350W. With an average lap time of 1:00 per lap, the battery must be able to run at<br />
cruise power for 4:00. Although the Elite 1500’s have 1500mah of capacity, the batteries cannot<br />
discharge this amount when discharged under high amp draw. Therefore, it was assumed that<br />
only 1000mah of actual usable power could be drawn from the battery pack before the power<br />
would drop off below a usable level. The rest would be dissipated as heat from the internal<br />
resistance of the battery cells. 1000mah of usable power means the batteries can be discharged at<br />
1 amp for an hour, or 15 amps for the required 4:00. While the Elite 1500’s are 1.2V batteries,<br />
the battery voltage drops while under such high amp draw. It was assumed that each battery<br />
would have an average voltage of 1.0V. In order to get 350W of power at a maximum average<br />
amp draw of 15 amps, the equation P=I*Vwas used to calculate the required battery pack<br />
voltage under load. The battery pack voltage must be at least 23.33V. Therefore, there must be at<br />
least 24 batteries in order to make the four lap range at full weight. From this analysis, the<br />
optimal battery pack size was determined to be 24 cells. With 24 cells, the battery pack weighs<br />
1.3lbs. A picture of the battery pack is shown in Figure 78.<br />
Figure 78: Battery Pack Overview<br />
The battery pack was designed like this in order to fit in the very nose of the aircraft. This allows<br />
the center of gravity to be moved as far forward as possible, increasing the aircraft static margin<br />
and overall aircraft stability.<br />
9.1.3 Electronic Speed Controller<br />
Electronic speed controllers are required for each motor in order to control the amount of power<br />
flowing from the battery pack to the motor. The speed controllers must be able to handle 33.6V<br />
and up to 40 amps each. The best speed controllers suggested for Neu Motors are Castle<br />
Creations Phoenix series. Within the Phoenix speed controller line up, three different speed<br />
controllers were considered.<br />
102
Project Final Report – CUDBF April 30 th , 2009<br />
ASEN 4028: <strong>Aerospace</strong> <strong>Senior</strong> <strong>Projects</strong><br />
Table 21: Speed Controllers Options<br />
Speed Controller Maximum Maximum Weight (g)<br />
Voltage Amps<br />
Phoenix 45 19.2 45 30<br />
Phoenix HV-45 50 45 60<br />
Phoenix 60 35.0 60 58<br />
Because of the high voltage requirement, the Phoenix 60 speed controller was chosen. The<br />
Phoenix 60 was chosen over the Phoenix HV-45 speed controller because it was 2g lighter and is<br />
rated for higher current. The higher current rating means the speed controller will run cooler and<br />
will run less risk of overheating. An image of the speed controller is shown in Figure 79.<br />
Figure 79: Speed Controller<br />
9.1.4 Wire Gauge<br />
In order to connect the battery pack at the center of the aircraft to each motor, approximately 1ft<br />
of wire must be run in each direction. This wire must be able to sustain the amount of current<br />
flowing without overheating or causing a significant voltage drop, while keeping weight down.<br />
The wire gauge sizes considered were 16AWG, 14AWG, and 12AWG. The higher the wire<br />
gauge, the lighter the wire. However, the lower the wire gauge, the more amps the wire is rated<br />
to handle. This means the wire will not get as hot, and there will be less voltage drop across the<br />
wire at a given voltage.<br />
The wire gauge was chosen based upon current rating, voltage drop, and weight. 16AWG wire is<br />
rated for 22 amps, while 14AWG wire is rated for 32 amps, and 12AWG wire is rated for 41<br />
amps. These ratings are for continuous current, and can be exceeded for short power surges.<br />
Each motor may draw up to 20 amps of continuous current and up to 40 amps in short bursts for<br />
takeoff.<br />
Next, the weight of one foot of wire and the voltage drop over that span were calculated for each<br />
wire. The voltage drop was multiplied by the average current in order to get the average power<br />
lost in the wire. This value was compared to the equivalent weight of a battery required to<br />
provide that amount of power. The extra weight of the wire was compared to the equivalent<br />
weight of the extra batteries required to provide that power.<br />
103
Project Final Report – CUDBF April 30 th , 2009<br />
ASEN 4028: <strong>Aerospace</strong> <strong>Senior</strong> <strong>Projects</strong><br />
With this analysis complete, 14AWG wire was chosen because it proved to be the lowest weight<br />
option. The 32 amp continuous rating will ensure that the wire will not overheat, and short 40<br />
amp bursts will be handled by the wire.<br />
9.1.5 Fuse<br />
Competition rules state that the propulsion system must contain a 40 amp fuse placed such that<br />
no portion of the propulsion system sees more than 40 amps of continuous current. A Cooper-<br />
Bussmann [29] ATC style 40 amp blade fuse was chosen to meet this requirement. The fuse is<br />
rated for 40 amps of continuous current, with up to 80 amps in short bursts less than 10 seconds.<br />
The fuse will be placed just behind the battery pack right before the power splits to both motors.<br />
This will allow the fuse to be easily accessible from the top of the wing for easy arming and<br />
disarming. An image of the fuse is shown in Figure 80.<br />
Figure 80: 40 Amp Fuse<br />
9.2 Avionics Electrical <strong>Design</strong> Elements<br />
9.2.1 Avionics Electrical Overview<br />
The overall responsibility of the avionics subsystem is to implement the communication system<br />
between the pilot and the plane and to use a telemetry system to record the necessary flight<br />
characteristics.<br />
The communication system will consist of a transmitter and receiver that will be able to control<br />
the servos that are connected to the control surfaces, electronic speed controllers, microcontroller<br />
and the releasable payloads. Figure 81 illustrates that six channels will be required for the<br />
transmitter and receiver. Four channels will be utilized to control the aircraft, one will be needed<br />
for the payload release system, and the last channel will be used to control the propulsion system.<br />
104
Project Final Report – CUDBF April 30 th , 2009<br />
ASEN 4028: <strong>Aerospace</strong> <strong>Senior</strong> <strong>Projects</strong><br />
Figure 81: Overall Avionics Diagram<br />
In order to verify that the plane meets certain project requirements, it is necessary to have an<br />
onboard telemetry system capable of measuring several flight characteristics. The team will be<br />
using a commercially manufactured onboard telemetry system produced by Eagle Tree Systems<br />
that was purchased by the previous CUDBF team. The Eagle Tree telemetry system includes a<br />
small, less than 1.5 oz, flight data recorder that will be placed on the plane. Post flight, the data<br />
stored on the data recorder will be able to download to a computer via the USB port. The Eagle<br />
Tree telemetry system is also capable of producing real-time data; however, at this time the<br />
CUDBF team feels it is unnecessary to utilize this feature.<br />
9.2.2 Payload Release Microcontroller<br />
With limited experience designing a developmental board that would allow a microcontroller to<br />
be programmed, a commercial off the shelf USB development board was purchased, as seen in<br />
Figure 82.<br />
Figure 82: USB Development Board<br />
105
Project Final Report – CUDBF April 30 th , 2009<br />
ASEN 4028: <strong>Aerospace</strong> <strong>Senior</strong> <strong>Projects</strong><br />
The board features a PIC18F2553 microcontroller, which has one compare, capture, and PWM<br />
(CCP) pin. The CCP pin is used to read in the PWM signal from the receiver. Due to the fact<br />
that the board only had one CCP pin, only one signal could be read from the transmitter, thus the<br />
board was used for proof-of concept. In order to read all of the required incoming signals, a<br />
multiplexer chip was implemented. On the board there are digital input/output pins that can be<br />
set high or low in software and the state of these pins can be read into the multiplexer chip with<br />
the corresponding signal from the transmitter. In other words, each signal (rudder, elevator,<br />
aileron, and switch) will be one of the inputs into the multiplexer and the digital I/O pins will be<br />
the other input. The output of the multiplexing chip is then connected to the CCP pin and<br />
depending what the PWM signal is the desired servo will be controlled. Table 22 illustrates how<br />
the output of the multiplexer is determined and Figure 83 illustrates how everything is wired.<br />
Table 22: Determination of output from multiplexer<br />
A (I/O Pin) B (I/O Pin) Switch Aileron Elevator Rudder Output<br />
L L L X X X L<br />
L L H X X X H<br />
L H X L X X L<br />
L H X H X X H<br />
H L X X L X L<br />
H L X X H X H<br />
H H X X X L L<br />
H H X X X H H<br />
Figure 83: Wiring Diagram<br />
The power distribution board on the diagram illustrates that the PWM signal outputted by the<br />
microcontroller cannot power the servos; a 5 V battery must be used to provide power to the<br />
106
Project Final Report – CUDBF April 30 th , 2009<br />
ASEN 4028: <strong>Aerospace</strong> <strong>Senior</strong> <strong>Projects</strong><br />
servos. Also it is important that the electrical devices are properly grounded, to prevent the<br />
devices from blowing up.<br />
With the assistance from one of our graduate advisors, Josh Fromm, the team was able to design<br />
a fully functioning circuit board. The completed circuit board is shown in Figure 84. The circuit<br />
board layout can be observed in Figure 85.<br />
Figure 84: Completed Circuit Board<br />
Figure 85: Circuit Board Schematic<br />
107
Project Final Report – CUDBF April 30 th , 2009<br />
ASEN 4028: <strong>Aerospace</strong> <strong>Senior</strong> <strong>Projects</strong><br />
9.2.3 Transmitter/Receiver Selection<br />
As mentioned in the previous section, the transmitter and receiver must be capable of supporting<br />
six channels; four control channels and two switches. In addition, the transmitter needs to be<br />
lightweight as it is included in the total weight score at competition. Also to meet requirement<br />
0.PRJ.7 the transmitter must have a fail-safe mode that is automatically selected during loss of<br />
transmit signal. During fail-safe the aircraft receiver must select throttle closed, full up elevator,<br />
and full right or left aileron.<br />
After in-depth research the team has selected a transmitter and receiver that will fulfill all the<br />
necessary requirements. The transmitter selected is the Spectrum DX 6i with the BR6000<br />
receiver [30] , both shown in Figure 86. Together these components have an overall weight of 2.0<br />
pounds and operate on a frequency of 2.4GHz.<br />
Figure 86: Transmitter and Receiver<br />
With the appropriate transmitter and receiver selected, it is important to understand how all of<br />
the components will be connected to ensure functionally of the communication system. The<br />
rudder, throttle, aileron, and elevator commands are controlled by the main four channels. For<br />
extra control over the elevators, the second elevator servo is linked through the fifth channel, the<br />
flaps channel. The microcontroller arming switch is controlled through the final channel, the<br />
gear channel. The overview of the wiring can be seen in Figure 85. To save on complexity of<br />
the wiring inside the aircraft, all Y-harnessing is done through the circuit board.<br />
9.2.4 Servo Selection<br />
The servos for the control surfaces and releasable payloads must provide adequate torque and be<br />
lightweight as the overall weight of the aircraft is an important design factor. The servo<br />
selection was divided into two groups: aircraft control servos and external store servos. All<br />
servos were selected based off the torque they can produce using 6 volts, which is the voltage<br />
108
Project Final Report – CUDBF April 30 th , 2009<br />
ASEN 4028: <strong>Aerospace</strong> <strong>Senior</strong> <strong>Projects</strong><br />
provided by the receiver. The selected servos are from Hitec ® RCD [31] ; Hitec was selected over<br />
other manufacturers due to superior servo selection and performance.<br />
The required torque for the controls surfaces were found for the worst case scenario, cruise speed<br />
and maximum deflection of 25 degrees. The servos selected for each control surface is displayed<br />
in Table 23. For the nose gear, a servo was selected that would provide adequate torque to allow<br />
the nose gear to steer the aircraft while on the ground.<br />
Table 23: Servo Selection for Control Surfaces<br />
Control Surface Required Torque (oz-in) Selected Servo Servo Torque (oz-in)<br />
Aileron (2) 38.4 HS-125MG 48.6<br />
Elevator (2) 47.8 HS-225MG 66.65<br />
Rudder (2) 22.2 HS-82MG 47.22<br />
Nose Gear 31 HS-82MG 47.22<br />
The required torques for the external stores were found for the minimum needed to release the<br />
stores.<br />
Table 24: Servo Selection for External Stores and Nose Gear<br />
Required Torque (oz-in) Selected Servo Servo Torque (oz-in)<br />
Wing Stores 30 HS-125MG 48.6<br />
Centerline Store 60 HS-77MG 76.3<br />
9.2.5 Eagle Tree Telemetry Capabilities<br />
An overview of what the data recorder is capable of measuring during flight is shown in Figure<br />
87. This data recorder will be vital to the testing and verification plan for next semester.<br />
109
Project Final Report – CUDBF April 30 th , 2009<br />
ASEN 4028: <strong>Aerospace</strong> <strong>Senior</strong> <strong>Projects</strong><br />
Figure 87: Capabilities of Data Recorder (Seagull Pro Telemetry System)<br />
The specific components that will be used for these measurements are described in the following:<br />
Dual Channel A/D Input Board (DUAL – AD)<br />
• Allows for team to add analog sensors, such as angle of attack sensor. The analog to<br />
digital converter has a 15 bit resolution and has two channels.<br />
Electric Expander -100 Amp (ELEC-EXP-100)<br />
• Measures motor battery-pack current and voltage.<br />
G-Force Expander (GFORCE-38)<br />
• Capable of measuring G-force up to +/- 38 G’s. Also measures dual axis acceleration.<br />
GPS Expander Module (GPS-STD)<br />
• Key measurements include: Latitude and longitude, GPS altitude, ground speed, and<br />
distance to pilot (WAAS compatible).<br />
Optical RPM Sensor (OPT-RPM)<br />
• Measures the revolutions per minute of the motor.<br />
Pitot Static System<br />
110
Project Final Report – CUDBF April 30 th , 2009<br />
ASEN 4028: <strong>Aerospace</strong> <strong>Senior</strong> <strong>Projects</strong><br />
• Measures airspeed and altitude and verifies measurements from GPS.<br />
Servo Current Logger (Servo-CURR-LOG)<br />
• Measures the current draw of each individual servo (0-5 Amps continuously with<br />
-0.01 Amp resolution). It also measures the servo position and whether or not an error<br />
occurs in the signal to the servos.<br />
Thermocouple Expander with CHT Probe Kit (THERM-EXP-CHT)<br />
• Supports two Type K thermocouple probes and measures the temperature of battery pack<br />
and motors to be measured.<br />
111
Project Final Report – CUDBF April 30 th , 2009<br />
ASEN 4028: <strong>Aerospace</strong> <strong>Senior</strong> <strong>Projects</strong><br />
10.0 Software <strong>Design</strong> Elements<br />
Author: Brett Miller<br />
Co-Author: Mark Findley, Jarryd Allison<br />
The Buff-2 Bomber had two main software components. The first allowed the team to iterate<br />
their wing design in order to optimize the aircraft’s wing geometry. The second controlled the<br />
aircraft’s payload through the microcontroller. These two components detailed in the following<br />
sections below.<br />
10.1 Aerodynamic <strong>Design</strong> Software<br />
The aerodynamics sub-team focused on minimizing weight, configuring the aircraft to be able to<br />
fit within the dimensions of the storage container, and most importantly being able to fly all<br />
missions. It was important to choose a geometry without negatively affecting the stability of the<br />
aircraft. Therefore, analysis was performed to select the optimal geometry configuration, while<br />
still adhering to project requirements.<br />
First the airfoil was selected, and the program XFOIL was used to determine certain airfoil<br />
properties such as lift characteristics, drag, and the moment coefficients. Flying wing airfoils<br />
documented in the University of Illinois, Urbana-Champaign airfoil database were assessed<br />
along with the Osborne <strong>Design</strong>/Build/Fly airfoil collection. From this collection, the drag polars<br />
were used to select the airfoils to be used.<br />
Figure 88: Airfoil Selection Flow Diagram<br />
To analyze the effect on static margin for a given center of gravity location with varying leading<br />
edge sweep angle and taper ratio, MATLAB code was then created to iterate between many<br />
different geometries at once, and output files that were compatible with AVL. The output<br />
geometries from MATLAB were run through the AutoIT program which entered the geometries<br />
along with commands into AVL. This process yielded the stability derivatives for every<br />
combination produced in the MATLAB iteration, and these stability derivatives were then reentered<br />
into a different MATLAB code to determine the static margin of the selected geometry.<br />
This MATLAB code stored the different sweep, taper, and static margin values, and the results<br />
plotted in order to observe how sweep and taper affect the static margin. In this way, the ideal<br />
static margin and final geometry of the Buff-2 Bomber was selected. Figure 89 shows this flow<br />
diagram.<br />
112
Project Final Report – CUDBF April 30 th , 2009<br />
ASEN 4028: <strong>Aerospace</strong> <strong>Senior</strong> <strong>Projects</strong><br />
Figure 89: Wing Geometry Determination Flow Diagram<br />
The stability derivatives calculated from AVL were then used to determine the dimensional<br />
stability of the aircraft under different loading conditions for the chosen geometry. MATLAB<br />
code was created to convert the non-dimensional derivatives provided by AVL into dimensional<br />
derivatives. These were then entered into Equation 15 and Equation 16 along with the inertias<br />
from SolidWorks for each loading case and mission. The eigenvalues of the system were then<br />
plotted to determine the stability of the spiral divergence, dutch-roll, and roll subsidence in the<br />
lateral direction, along with short and long period in the longitudinal direction. The flow<br />
diagram is seen in Figure 90.<br />
Figure 90: Stability Determination Flow Diagram<br />
Finally, drag analysis was needed to establish that the propulsion subsystem provides enough<br />
thrust for the aircraft to perform as expected. The geometry of the aircraft developed in AVL<br />
was created as a three-dimensional model in SolidWorks. The model was then subjected to<br />
Powerflow, and the drag on the body determined.<br />
Figure 91: Drag Calculation Flow Diagram<br />
10.2 Avionics Microcontroller Software<br />
The following explains the software that was programmed to the microcontroller. All coding<br />
was written in C and MPLAB was used to compile the code and generate a hex file, so it could<br />
be programmed to the circuit board via a USB cable.<br />
The microcontroller was programmed such that the pilot had to arm the microcontroller when he<br />
was ready to release the payload. To activate the microcontroller, the pilot simply flipped a<br />
switch on the transmitter. The switch on the transmitter produced two different PWM signals<br />
each with a period of 20.0 ms. One position of the switch produced a signal with a 10% duty<br />
cycle and the other position produced a signal with a 5% duty cycle. The signal was read into the<br />
microcontroller and based on the duty cycle, the microcontroller either did nothing (no<br />
deployment required) or allowed signals to be sent to the payload servos (when deployment was<br />
required). The logic for arming the PIC can be seen in Figure 92. The microcontroller was able<br />
to differentiate between the duty cycles by using the capture module associated with the CCP<br />
pin. In software, it was written such that a flag was set when the CCP pin read a rising edge of<br />
the signal. After setting a flag, a timer was initiated. Once the microcontroller found the falling<br />
113
Project Final Report – CUDBF April 30 th , 2009<br />
ASEN 4028: <strong>Aerospace</strong> <strong>Senior</strong> <strong>Projects</strong><br />
edge of the signal, it stopped the timer. The timer value reflected how many instruction cycles it<br />
took the microcontroller to read the high time of the incoming signal. Knowing that the<br />
microcontroller operated at a frequency of 48 MHz and executed 4 instructions per clock cycle,<br />
the timer value was converted to a time.<br />
Figure 92: Logic to arming microcontroller<br />
Once the microcontroller was armed it then reads the incoming signals, using the CCP pin as<br />
before, from the aileron, elevator, and rudder. To avoid accidental store release, there is a time<br />
delay of three seconds between arming the microcontroller and the microcontroller reading the<br />
incoming signals. The inputs for these control surfaces are similar to how the switch works. On<br />
the transmitter there are two sticks that produce various PWM signals depending on their<br />
position. For instance, moving the left stick to the far left causes the rudder signal to have a high<br />
time of 1.0 ms or duty cycle of 5% and moving it to the far right gives the rudder a signal with a<br />
high time of 2.0 ms or duty cycle of 10%. Based on the signals, the appropriate payload is<br />
released. The flowchart of this process is shown in Figure 93. Every time the microcontroller is<br />
armed it goes through this sequence once and then returns to the arming routine. Code for the<br />
Microcontroller can be observed in Appendix K.<br />
Figure 93: Flowchart for releasing payloads<br />
114
Project Final Report – CUDBF April 30 th , 2009<br />
ASEN 4028: <strong>Aerospace</strong> <strong>Senior</strong> <strong>Projects</strong><br />
11.0 Integration Plan<br />
Author: Mark Findley<br />
Co-Author: Eric Hall<br />
11.1 Aircraft Overview<br />
The Buff-2 Bomber is composed of four main mechanical sub-assemblies: wing, structure,<br />
propulsion, and avionics. The following chapter details the integration plan of the major<br />
components into the four sub-assemblies and then the integration of the sub-assemblies into the<br />
complete aircraft. Figure 94 below shows the assembly flow diagram for the construction of the<br />
CUDBF aircraft.<br />
Figure 94: Assembly Flow Diagram<br />
115
Project Final Report – CUDBF April 30 th , 2009<br />
ASEN 4028: <strong>Aerospace</strong> <strong>Senior</strong> <strong>Projects</strong><br />
11.2 Wing Sub-Assembly<br />
The wing sub-assembly consists of the main wing assembly and the vertical assembly.<br />
11.2.1 Wing Assembly<br />
The main wing assembly is composed of a core of 1pcf EPS foam. The foam cores will be<br />
outsourced due to the geometric twist of the wing. This will ensure that the foam cores are the<br />
correct dimensions. The balsa motor mount blocks are then glued into the foam using epoxy.<br />
Also, the main gear mount plywood mount will be glued into the core before sheeting. The foam<br />
core will then skinned with 1/32” light weight balsa. The control surfaces will also be sheeted<br />
with 1/32” light weight balsa after a balsa insert is glued into the foam for the control horn. The<br />
ailerons and elevators will then be attached to the wing halves. Both wing halves will be<br />
constructed in parallel and can be seen below in Figure 95.<br />
Figure 95: Main Wing Assembly<br />
11.2.2 Vertical Tail Assembly<br />
The foam cores for the verticals will also be outsourced in order to achieve the desired<br />
tolerances. The verticals and rudders will be sheeted the same way as previously mentioned.<br />
After they are sheeted, the carbon support tubes will be inserted and glued in place. These will<br />
then be glued to the balsa vertical spar mount. The rudders will then be attached to each winglet.<br />
Both vertical tails will be constructed in parallel. A vertical tail can be seen in Figure 96.<br />
116
Project Final Report – CUDBF April 30 th , 2009<br />
ASEN 4028: <strong>Aerospace</strong> <strong>Senior</strong> <strong>Projects</strong><br />
Figure 96: Vertical Assembly<br />
The wing assemblies and the winglet assemblies will then be joined. The two wing halves with<br />
winglets will then be joined with the root wing joiner to form the wing sub-assembly. The wing<br />
sub-assembly is shown in Figure 97.<br />
11.3 Structures Sub-Assembly<br />
Figure 97: Wing Sub-Assembly<br />
The joint required to fold the wing must be structurally sound since a considerable amount of the<br />
wing folds. This is also a very critical element of the aircraft. The wing tips need to fold and<br />
117
Project Final Report – CUDBF April 30 th , 2009<br />
ASEN 4028: <strong>Aerospace</strong> <strong>Senior</strong> <strong>Projects</strong><br />
unfold properly for this aircraft to be successful. High tolerances need to be implemented when<br />
joining the wing tip to the main wing.<br />
11.3.1 Folding Wingtip Assembly<br />
The wing tip mounts are glued into the foam and balsa skinned main wings. The hinge is then<br />
screwed into the wing tip spar and glued into the wing tip. The hinge is then screwed into the<br />
wing tip mount. The rubber bushings are also glued into the adjoining surfaces. This assembly<br />
is shown in Figure 98.<br />
Figure 98: Folding Wingtip Assembly<br />
11.3.2 Landing Gear Assembly<br />
The landing gear assembly consists of the nose gear assembly and the left and right main gear<br />
assemblies. The main landing gear assembly consists of an quarter inch aluminum 2024 strut<br />
screwed to the main gear mount with steel straps. The screws screw into tee nuts in the main<br />
gear mount. The left and right main gear can be constructed in parallel. The strut is screwed the<br />
main gear mount after the wing is skinned. The main wheels are secured on the aluminum strut<br />
with ¼” collets. The nose gear assembly is made up of several parts to provide for the steering<br />
of the aircraft on the ground. It is mounted inside of the wing just behind the battery box. The<br />
nose gear assembly is shown in Figure 99 and the main landing gear assembly is shown in<br />
Figure 100.<br />
118
Project Final Report – CUDBF April 30 th , 2009<br />
ASEN 4028: <strong>Aerospace</strong> <strong>Senior</strong> <strong>Projects</strong><br />
Figure 99: Nose Gear Assembly<br />
Figure 100: Bottom View of Right Main Landing Gear<br />
119
Project Final Report – CUDBF April 30 th , 2009<br />
ASEN 4028: <strong>Aerospace</strong> <strong>Senior</strong> <strong>Projects</strong><br />
11.4 Propulsion Sub-Assembly<br />
All electronic components for the propulsion system are COTS.<br />
11.4.1 Motor Mount Assembly<br />
The motor and gear box assembly are secured to the motor pylon. The motor pylon is then<br />
attached to the main wing by means of the motor block mounts already in the wing. It is attached<br />
with four ¼ in nylon screws. The top piece of the motor block mount is then replaced back into<br />
the wing. The speed controller is wired to the motor using bullet connectors and is connected to<br />
the battery extensions and the receiver extension wire as the whole motor assembly is being<br />
attached to the wing. Figure 101 shows the installed motor mount assembly.<br />
Figure 101: Motor Mount Assembly<br />
11.4.2 Battery Assembly<br />
The battery pack consists of up to 24 Elite 1500 cells. These cells are soldered together in a “V”<br />
configuration in order to fit into the very nose of the wing. The battery pack is housed in a box<br />
made of 3/16” balsa. The battery pack is connected to the battery extension wire by a Deans<br />
connector. A hatch in the top of the wing allows the battery pack to be removed to be recharged.<br />
The battery assembly can be seen in Figure 102.<br />
120
Project Final Report – CUDBF April 30 th , 2009<br />
ASEN 4028: <strong>Aerospace</strong> <strong>Senior</strong> <strong>Projects</strong><br />
11.5 Release Mechanism Sub- Assembly<br />
Figure 102: Battery Assembly<br />
11.5.1 Wing Store Release Mechanism<br />
The main components of this system are the release servo, the Tru-Fire triggers, the metal plates,<br />
the pull pins, and the rails. This assembly is shown below in Figure 103. The wing store release<br />
mechanism is installed into the wing tip after it is sheeted but before the wing tip spar is glued<br />
into place. This allows for proper alignment of the two components into the wing tip. The<br />
mechanism locations are described in Section 8 with the key points being that their placement<br />
was measured to keep the centerline of the inboard wing store 24 1/4” from the centerline of the<br />
aircraft and each store 6 1/8 “ apart to meet competition based design requirements. The rear<br />
pylon location is reinforced and measured to be ½” from the rear of the wing to avoid the rocket<br />
fins from interfering with the ailerons. The mechanisms are surrounded by tape during<br />
construction to prevent glue from the balsa skin from with and seizing the mechanisms and<br />
servo.<br />
121
Project Final Report – CUDBF April 30 th , 2009<br />
ASEN 4028: <strong>Aerospace</strong> <strong>Senior</strong> <strong>Projects</strong><br />
Figure 103: Wing Store Release Mechanism<br />
11.5.2 Centerline Store Release Mechanism<br />
The centerline release mechanism consists of one servo and two arm hooks. The servo is<br />
mounted in the center of the root wing joiner and is shown below in Figure 104. It is important<br />
to note that the plate supporting the centerline store also joins the wings to reduce weight. Like<br />
the wing release mechanisms, the centerline store is surrounded by a balsa box during<br />
construction to prevent glue from interacting with and seizing the mechanisms and servo.<br />
Figure 104: Centerline Store Release Mechanism<br />
122
Project Final Report – CUDBF April 30 th , 2009<br />
ASEN 4028: <strong>Aerospace</strong> <strong>Senior</strong> <strong>Projects</strong><br />
11.6 Avionics Sub- Assembly<br />
11.6.1 Receiver Assembly<br />
The receiver and receiver battery are mounted just behind the nose gear mount and just forward<br />
of the root wing joiner. The receiver is wired to each servo, including the release mechanism<br />
servos.<br />
11.6.2 Servo Assembly<br />
The servos for the rudders, ailerons, and the elevator are installed after the wing assembly is<br />
completed. The servos are installed and connected to the control horns with their respective<br />
linkages.<br />
11.7 Aircraft Assembly<br />
The aircraft assembly is shown in Figure 105.<br />
Figure 105: Aircraft Assembly<br />
123
Project Final Report – CUDBF April 30 th , 2009<br />
ASEN 4028: <strong>Aerospace</strong> <strong>Senior</strong> <strong>Projects</strong><br />
12.0 Fabrication and Integration<br />
Author: Jarryd Allison<br />
Co-Authors: Mark Findley, Eric Hall<br />
12.1 Interior Sub-Assembly<br />
Figure 106: Interior Landing Gear and Joiner Plate Assembly<br />
To begin building the aircraft multiple interior subsystems needed to be built in tandem in order<br />
to integrate these systems into the wing. The nose gear was started by first cutting a 10 inch<br />
section of aluminum T-bar. Once cut, all sharp edges were filed down and the end corners<br />
rounded to ease assimilation into the wing halves. A hole sized to fit the steering servo was cut<br />
into the aluminum bar, and to reduce weight, holes were drilled one inch apart long the shorter<br />
perpendicular section of the aluminum bar. The servo was set into the T-bar and secured by<br />
drilling holes into the aluminum bar at the appropriate locations. The COTS landing gear system<br />
(to include servo connection arm, hard plastic holders, and spar) was then installed into the<br />
aluminum bar by drilling holes into the aluminum which holds the spar holders via four small<br />
screws. The spar was then sent through the holders and held in place with the servo connection<br />
arm. The COTS landing gear was then attached to the servo and the system tested using the<br />
transmitter.<br />
The PIC microcontroller was built to attach to the receiver and control all avionics systems of the<br />
aircraft as well as the release mechanisms. Once the PIC was selected, code was written for the<br />
microcontroller and tested with the PIC on a breadboard. Once the breadboard prototype was<br />
completed, a circuit board was designed to house all of the necessary electronic components in a<br />
compact fashion, so it could easily be integrated into the plane. The components were soldered<br />
onto the circuit board and the microcontroller tested to ensure that all connections were secure.<br />
Each release mechanism consisted of a Trufire bow release trigger held in place using small<br />
sections of aluminum L-bar. To alter the triggers, the hand grip was removed on the band saw<br />
and the screws that hold the two halves of the system together also removed. The screw holes<br />
were then extended using a drill and the release trigger bolted to the aluminum holders. In the<br />
actual releasing part of the system, the spring was manipulated by installing a small screw into<br />
124
Project Final Report – CUDBF April 30 th , 2009<br />
ASEN 4028: <strong>Aerospace</strong> <strong>Senior</strong> <strong>Projects</strong><br />
the release trigger directly behind the spring. This screw was then tied to a servo, and when<br />
pulled, activated the mechanism and released any stores that were attached to it.<br />
The centerline mount was built from a large sheet of plywood. Once cut, the plywood sheet was<br />
sanded smooth on all sides. Holes were cut into the mount to hold two release mechanisms and<br />
the servo in between which controlled both mechanisms. Great care was taken to ensure that the<br />
servo arm lay in the same plane as the release mechanism’s tops, so small balsa blocks were<br />
sized to raise the servo up to the necessary height. Making sure that the wiring remains long<br />
enough to thread through the wings, the servo was screwed into the balsa blocks and the release<br />
mechanisms into the plywood mount. The servo arm was then tied to each release system and<br />
the centerline mount tested with the centerline store.<br />
12.2 Exterior Sub-Assembly<br />
Figure 107: Exterior Vertical and Main Gear Assembly<br />
The aircraft verticals were built by first removing the rudders using a bandsaw and carefully<br />
measuring the exact locations where the rudder is located. Once removed, the vertical and<br />
rudder were sheeted with balsa wood attached with Gorilla Glue © . When the glue set, the pieces<br />
were removed from their molds and any excess balsa removed. The verticals and rudders were<br />
then sanded to remove excess glue. At this point, the verticals were shaped to be easily fitted to<br />
the wingtip of the aircraft. Thus an airfoil hollow which stops halfway through the vertical was<br />
cut into the bottom of the vertical. This allowed the vertical to sit atop the wingtip snugly.<br />
Small balsa blocks were attached to the tops of the two pieces and sanded to a curved shape to<br />
improve aircraft aerodynamics. A cavity was created in the verticals to hold an interior-mounted<br />
servo which controls the rudder, and at the same time the rudders were monokoted. Holes were<br />
drilled into the rudder and small hinges glued into the holes, with like holes being drilled into the<br />
vertical. The vertical was then itself monokoted and the exposed rudder hinges glued into the<br />
vertical taking care not to cover the hinge with excess glue, which impinged on rudder<br />
movement. The servo was then attached to the rudder and the system tested.<br />
125
Project Final Report – CUDBF April 30 th , 2009<br />
ASEN 4028: <strong>Aerospace</strong> <strong>Senior</strong> <strong>Projects</strong><br />
The metal motor mounts were fabricated by printing out a template from SolidWorks © and then<br />
gluing the paper to thin aluminum sheeting. The shape was cut out using a bandsaw and the<br />
rough edges filed to prevent injury. Holes were then drilled into the metal in the appropriate<br />
places marked on the template. Once this was completed, the mounts were bent on a sheet metal<br />
bender.<br />
Given their unique shape, the main landing gear could not be purchased and thus had to be built<br />
from scratch. To begin construction, plywood mounts for the main gear were cut, the corners<br />
rounded, and blind nuts secured into the mounts to attach the main gear spars to the mounts.<br />
Al2024 spars were store-bought and the necessary bend locations marked along the spars. Each<br />
gear spar was bent by hand using a strong table mounted clamp and a hammer, making sure to<br />
bend the sections attached to the mount at a 90 degree angle, the longest sections at a 10 degree<br />
angle, and the section which holds the wheel at a 90 degree angle. Once the spar was bent, 1/8<br />
inch aluminum sheeting was cut into 1.5 inch long strips ¼ inches wide in order to secure the<br />
main gear strut to the plywood mount. The strips were then hammered over a piece of the<br />
aluminum spar to bend them into a horseshoe-like shape. Holes were then drilled into the strips,<br />
which were bolted into the blind nuts on the plywood mounts, securing the spars to the mounts.<br />
The main gear was then completed by attaching wheels and collars at the base of the spar.<br />
12.3 Wingtip Sub-Assembly<br />
Figure 108: Wingtip Interior Sub-Assembly<br />
While the interior and exterior sub-assemblies were being completed, other team members were<br />
beginning work on the aircraft wing. To begin fabricating the verticals, the main wing was first<br />
separated from the wingtip at the fold location using a hot wire cutter. After the cut was made,<br />
the aileron was removed. The aileron was then sheeted, sanded, and monokoted. Small holes<br />
were then drilled along the aileron leading edge and small hinges similar to those used in the<br />
rudder where glued into the aileron. The wingtip was then subjected to a series of hollows using<br />
a routing bit and a drill press. Holes were made for the wiring, balsa spar, and release<br />
mechanisms (to include the release mechanism mentioned above as well as the small metal plates<br />
that attract the magnets located in the wingtip stores and the servo). Once the holes were<br />
created, the release mechanisms were glued into place and balsa covers glued on top of the<br />
126
Project Final Report – CUDBF April 30 th , 2009<br />
ASEN 4028: <strong>Aerospace</strong> <strong>Senior</strong> <strong>Projects</strong><br />
apparatus to both protect the device as well as maintain the integrity and shape of the wing. A<br />
small balsa plate was glued into the servo cavity which allows the servo to be screwed into place.<br />
Wiring for the rudder, aileron, and release mechanisms was placed in the hole created for it, and<br />
enough run through the wingtip to attach the vertical, aileron, and wingtip to the main wing. The<br />
balsa spar and hinge system was then glued into place on the wingtip. Great care was taken to<br />
ensure that the balsa spar and hinge were properly placed and aligned within the wingtip such<br />
that no twist or different angles of attack are introduced to the final aircraft.<br />
Once the spar, wiring, and release mechanisms were installed, the release mechanisms were tied<br />
to the servo with Kevlar string and paper was taped over all hollows to prevent glue from<br />
spreading into the hollows. The wingtips were then sheeted with balsa in the same manner as the<br />
verticals. The wiring and release mechanisms were tested after sheeting to ensure no glue spread<br />
to the system. Rubber sections were then cut to fit the airfoil shape at the wingtip folding edge<br />
(this provided some degree of pre-stress for the hinge system). Balsa sheets were first fitted to<br />
the wingtip edge, and the thin rubber airfoil shapes glues to the wingtip. The location where the<br />
wingtip stores connect to the aircraft via magnets was then hollowed out to allow the rocket<br />
magnet to directly contact the installed metal. Next, a small hollow was created for the aileron<br />
control servo and the servo installed. Like holes were then drilled into the trailing edge which<br />
matches those created for the aileron. The aileron hinges were glued into place, servo linkages<br />
were attached to the aileron, and the control surfaces tested.<br />
12.4 Main Wing Sub-Assembly<br />
Figure 109: Main Joined Wing Assembly<br />
Once the cut along the aircraft fold location was made, the main wing could be built in tandem<br />
with the wingtips. The elevators were removed first using a bandsaw, and the elevators sheeted<br />
and sanded. These control surfaces were then monokoted and holes drilled along the leading<br />
edge. Small hinges similar to the ones used in the rudder and aileron were then installed, and the<br />
elevator was then set aside until later. In the wing, sections where the motors are placed were<br />
removed from the wing and balsa mounts integrated. The mounts were made by shaping blocks<br />
carefully to maintain wing shape and tightly hold the metal motor mounts which directly house<br />
the motors. Once these were glued into place, the wing halves were sheeted. While the wings<br />
127
Project Final Report – CUDBF April 30 th , 2009<br />
ASEN 4028: <strong>Aerospace</strong> <strong>Senior</strong> <strong>Projects</strong><br />
were drying, balsa mounts, which tightly hold the wingtip hinge systems to the main wing, were<br />
shaped to fit into the tips of the main wings. After the wings were dry, the excess balsa was<br />
removed (to include the balsa sheeting covering the motor mount holes) and the wings sanded<br />
while cavities to house the balsa hinge mounts as well as the wiring, nose gear, and centerline<br />
mount were created. While removing excess glue, the glue that inevitably formed around the<br />
nose gear was removed such that the nose gear can rotate unimpeded. The hinge mounts were<br />
glued into place, the wiring fed throughout the wing halves, and the halves joined with the<br />
centerline mounts and nose gear spar securing the two halves together. After this glue dried, the<br />
excess was removed by sanding. Hollows in the wing were then created to house the batteries<br />
and the receiver as well as the circuit board, which together control the aircraft avionics systems.<br />
After the hollows were created, the wiring was fed to the motor locations and into the main<br />
hatch, and battery cables linked to the battery cavity. Holes were cut into the bottom of the wing<br />
to house the elevator servos, which were mounted onto plywood mounts to secure the servos to<br />
the aircraft. Additionally, cavities were cut to house the main landing gear to the bottom of the<br />
airplane. Holes that match the hinge locations on the elevators were drilled into the trailing edge<br />
of the main wing and the elevators attached. The servos were linked to the elevators and the<br />
system tested to ensure functionality.<br />
12.4 Full System Assembly<br />
Figure 110: Full System Assembly<br />
To complete the aircraft assembly, the wingtip wiring was soldered to the wiring running<br />
through the main wing assembly and the hinges screwed into the balsa hinge mounts. The circuit<br />
board which houses the microcontroller and receiver was connected to the wiring within the<br />
aircraft main hatch. The verticals could then be attached to the wingtips. Small cavities were<br />
shaped in both the wingtip and vertical to house two small L shaped aluminum pieces per<br />
vertical. Glue was then applied to the verticals and wingtips and the verticals attached to the<br />
aircraft. Although the vertical sits nicely atop the wingtip airfoil shape, there remained a section<br />
on the bottom of the aircraft where the vertical sits which required a fairing. A small balsa piece<br />
was shaped and attached to maintain an aerodynamic profile at the bottom of the vertical/wingtip<br />
connection. The main landing gear was then glued to the bottom of the aircraft. Once full<br />
128
Project Final Report – CUDBF April 30 th , 2009<br />
ASEN 4028: <strong>Aerospace</strong> <strong>Senior</strong> <strong>Projects</strong><br />
systems functionality was tested, the entire top and bottom of the aircraft was monokoted the<br />
appropriate colors. Motors were attached to the metal motor mounts and secured to the aircraft<br />
using nylon bolts, and a perpendicular spar fitted to the nose gear and a wheel attached. The<br />
aircraft CG was then tested to ensure it is within limits. Finally, the aircraft was ground tested<br />
before flight.<br />
129
Project Final Report – CUDBF April 30 th , 2009<br />
ASEN 4028: <strong>Aerospace</strong> <strong>Senior</strong> <strong>Projects</strong><br />
13.0 Verification and Validation<br />
Author: Ben Kemper<br />
Co-Author: Ross Defranco<br />
13.1 Subsystem Verification and Validation<br />
13.1.1 Missions Subsystem Verification and Validation<br />
13.1.1.1 Release Mechanism Testing<br />
Both the wing stores and the centerline store needed to be tested for 95% deployment reliability.<br />
Payload release testing consisted of loading the rockets and releasing the rockets remotely<br />
repeatedly. Each individual release mechanism was fully tested as a subsystem before it was<br />
integrated into the Buff-2B and Buff-2C models. Further testing was done to ensure release<br />
reliability for both store types by loading them rapidly and then releasing them with only the<br />
powered servos, PIC, and transmitter. Both types released reliably on 25 out of 25 attempts after<br />
construction, validating the 95% release rate. After further wear and testing, the Kevlar string<br />
connecting the servo on the left outboard wing release mechanism broke. This required cutting<br />
into the aircraft for repair. After further testing and analysis, it was determined the CA used to<br />
secure the string to the metal pin made the single strand of Kevlar brittle and more likely to snap.<br />
This was redesigned on the Buff-2C model by using a screw so that CA was not required and<br />
braiding 3 strands of Kevlar together. Strings were seen to stretch initially after use on the Buff-<br />
2C model (one requiring tightening), but broken strings never again occurred.<br />
It was also important to ensure that the stores would remain fixed to the aircraft during flight.<br />
This was first tested on the ground by performing shake tests on both the aircraft and stores and<br />
130
Project Final Report – CUDBF April 30 th , 2009<br />
ASEN 4028: <strong>Aerospace</strong> <strong>Senior</strong> <strong>Projects</strong><br />
pulling/pushing on the store in each of the 6 coordinate directions. When properly loaded, the<br />
final payloads remained fixed to the aircraft throughout all of these conditions. The centerline<br />
store offered slightly more free-play than the wing mounted stores, but was determined to be safe<br />
and acceptable for flight on the C model. The centerline store on the B model had added foam<br />
inserts to prevent possible free-play during flight. In all, the final integrated release system<br />
proved reliable for release and attachment.<br />
13.1.1.2 Aircraft Container Drop Testing<br />
Both the foam box and balsa isogrid box were dropped multiple times in order to verify the 6<br />
inch drop requirement. Both boxes were loaded with all contents, lifted such that no part of the<br />
box was below 6 inches, and released. Following each test, both boxes were inspected for<br />
structural damage and the contents were checked to make sure nothing shifted during the drop.<br />
Both boxes were dropped 7 times over the course of the project and at least once on each side.<br />
For the foam box, the only visible damage to the box was foam compression on the surface. This<br />
damage was superficial and not structural. Similarly, the balsa only experienced surface<br />
scratching due to the concrete surface the box was being dropped on. Again, the box did not<br />
sustain damage and its contents did not shift. An inspection of the container’s corner can be seen<br />
in Figure 111.<br />
Figure 111: Inspect of the Isogrid Box Structural Corner after Drop Test<br />
13.1.2 Propulsion Subsystem Verification and Validation<br />
13.1.2.1 Static Thrust Testing<br />
Static thrust testing was conducted in order to ensure the aircraft had sufficient power to make<br />
the 100ft takeoff with the heaviest payload. No values were predicted before this test because of<br />
the known inaccuracy in the program Electricalc (the program used to determine the static<br />
thrust). Instead, the purpose of this test was to experimentally measure static thrust as a function<br />
of power draw for different diameter and pitch propeller sizes. No propellers less than 12” in<br />
diameter were tested because the ground clearance provided for the water bottle allowed for a<br />
131
Project Final Report – CUDBF April 30 th , 2009<br />
ASEN 4028: <strong>Aerospace</strong> <strong>Senior</strong> <strong>Projects</strong><br />
12” propeller without any additional landing gear size and weight. Propeller sizes up to 14” in<br />
diameter were tested incase additional thrust was needed, since the takeoff incidence angle<br />
allows for propellers of up to 14”. A motor was run at 800W, the maximum theoretical power<br />
that could be delivered by the battery pack to each motor (20V and 40 amps per motor, or 80<br />
amps total).<br />
Table 25: Static Thrust Test Results<br />
Propeller Diameter (in) Propeller Pitch Maximum Thrust (lb)<br />
12 6 5.37<br />
12 12 4.30<br />
13 6.5 5.06<br />
13 10 4.78<br />
14 7 5.87<br />
14 12 4.65<br />
This test confirms the expected result that higher diameter propellers as well as lower pitch<br />
propellers produce more static thrust than lower diameter and higher pitch propellers. In order to<br />
get the required thrust of 8.0lbs of static thrust at 1200W, each motor must produce 5.33 lbs of<br />
thrust at 800W. Therefore, this test confirms that the only usable propellers are 12in x 6 and 14in<br />
x 7 propellers.<br />
13.1.2.2 Battery Endurance Testing<br />
In order to determine aircraft endurance, the battery pack was discharged on the ground in a<br />
mission profile similar to the aircraft when in flight. It was determined that mission two,<br />
described in 2.2, would require the most battery endurance since the aircraft will be carrying the<br />
weight of the full water bottle load for four laps. In order to simulate this mission, the battery<br />
was first discharged at full power for ten seconds to simulate takeoff. The power was then cut in<br />
half for an additional ten seconds to simulate climb, and then reduced to cruise power until the<br />
battery pack voltage dropped below 0.9V per cell. The battery pack used in this test can be seen<br />
in Figure 112.<br />
Figure 112: Competition Battery Packs<br />
132
Project Final Report – CUDBF April 30 th , 2009<br />
ASEN 4028: <strong>Aerospace</strong> <strong>Senior</strong> <strong>Projects</strong><br />
The cruise power was estimated to be 350W. Assuming an average battery pack voltage of 1.0V<br />
per cell (24.0V) during the discharge, an approximate amp draw of 15 amps was required to<br />
generate 350W of power. While the batteries are designed to hold 1500mah of power, the<br />
batteries cannot discharge this amount when discharged under such high amp draw (10C).<br />
Therefore, it was assumed that only 1000mah of actual usable power could be drawn from the<br />
battery pack before the power would drop off below a usable level. The rest would be dissipated<br />
as heat from the internal resistance of the battery cells. With an average amp draw of 15 amps<br />
and 1000mah of usable power, the calculated endurance of the battery pack at cruise speed<br />
would be 4:00.<br />
The plots in Figure 113 show the battery pack voltage and power consumption as a function of<br />
time.<br />
34<br />
Battery Voltage<br />
1200<br />
Power Usage<br />
32<br />
30<br />
1000<br />
Battery Voltage (V)<br />
28<br />
26<br />
24<br />
22<br />
Power Usage (W)<br />
800<br />
600<br />
400<br />
20<br />
18<br />
200<br />
16<br />
0 50 100 150 200 250 300 350 400<br />
Time (seconds)<br />
0<br />
0 50 100 150 200 250 300 350 400<br />
Time (seconds)<br />
Figure 113: Battery Voltage and Power Over Time<br />
The results of the test indicate that the battery pack voltage dropped below 0.9 V/cell at 4<br />
minutes 10 seconds into the test, and then the power dropped below the 350 W required for<br />
cruise flight. This was slightly higher than the 4 minutes predicted because the battery pack<br />
provided about 1050 mah of usable power, above the 1000 mah used in the initial assumptions.<br />
Based upon the assumption of one minute per lap, this test verifies that the Buff-2 Bomber can in<br />
fact fly four laps in cruise with the heaviest payload configuration. The battery pack continues to<br />
provide sufficient power to sustain a slow descent until 4 minutes 30 seconds into the test, when<br />
the power drops below 200W. This extra power margin was designed to be used as reserve<br />
power during flight.<br />
13.1.3 Structures Subsystem Verification and Validation<br />
A whiffle tree test was performed to determine whether or not the Buff-2 Bomber wing can<br />
sustain the expected loads seen in flight. The wing was loaded using a whiffle tree system and<br />
mounted upside down to simulate lift in flight. A right wing half was built according to normal<br />
construction spec in order to correctly determine the actual strength of the wing. The wing half<br />
133
Project Final Report – CUDBF April 30 th , 2009<br />
ASEN 4028: <strong>Aerospace</strong> <strong>Senior</strong> <strong>Projects</strong><br />
was mounted via a plywood wing joiner and aluminum spar (as in the actual plane) to a<br />
2”x4”x30” piece of hardwood and glued into place. The hardwood mount was then bolted to a<br />
large sheet of plywood and weights were applied to the large plywood sheet such that the wing<br />
hangs off of an overhang. A top view of the constructed test wing with the mounting apparatus<br />
is shown in Figure 114 and a root view is provided within Figure 115.<br />
Figure 114: Test Wing with Mounting Apparatus Top View<br />
Figure 115: Test Wing with Mounting Apparatus Root View<br />
The whiffle tree was designed using the lift function derived from the AVL lift distribution plot.<br />
The lift distribution function is seen in Equation 35. Using the ratio of lift loads at specified span<br />
134
Project Final Report – CUDBF April 30 th , 2009<br />
ASEN 4028: <strong>Aerospace</strong> <strong>Senior</strong> <strong>Projects</strong><br />
locations, the required whiffle tree configuration was designed as seen in Figure 116, where ∆<br />
corresponds to a distance of 5 inches.<br />
() = −0.001 + 0.0215 + 0.807<br />
Equation 35: Estimated Wing Loading Function<br />
Figure 116: Whiffle Tree Final <strong>Design</strong><br />
The results from the test were then compared to a predicted max tip displacement of 0.62 inches<br />
at 3 g loading, and with a COSMOSWorks FEM model prediction of 0.69 inch max tip<br />
displacement. The COSMOSWorks FEM model and loading analysis are shown in Figure 117.<br />
Figure 117: COSMOSWorks FEM Model of Tip Displacement<br />
The whiffle tree then distributed a single load applied on the bottom rung to model the actual lift<br />
curve along the wing. The whiffle tree system was composed of multiple straps and metal beams<br />
placed onto the wing and taped into place to avoid slippage during testing. Weight was applied<br />
in 5 lb increments to the bottom rung of the whiffle tree to a loading of 3 g’s (22.5 lbs), which<br />
the wing was designed to withstand. The deflection at this point was then measured by using a<br />
ruler to measure the difference between the wing tip and an above the wing beam reference.<br />
This beam reference was a spar mounted above the wing onto the 2”x4” board where<br />
135
Project Final Report – CUDBF April 30 th , 2009<br />
ASEN 4028: <strong>Aerospace</strong> <strong>Senior</strong> <strong>Projects</strong><br />
measurements can be taken from a fixed location. As the wing deflected, the distance was<br />
viewed on the measuring stick and recorded for data collection. After applying the 3 g load to<br />
the wing, additional weight was added in increments of 5 lb, until the wing ultimately broke at<br />
the wing root. The deflection of the wing at each weight increment beyond the 3 g load was also<br />
recorded to determine the ultimate failure load. Photographs of the whiffle tree test are shown in<br />
Figure 118 and Figure 119.<br />
Figure 118: Whiffle Tree During Loading<br />
Figure 119: Wing Post-Failure<br />
The measured wing tip displacement as a function of loaded weight along with the estimated<br />
accuracy is provided in a plot within Figure 120. The displacement at the hinge location was<br />
also recorded in order to determine if the majority of the deflection was occurring within the<br />
wing-tip section itself. As seen within the plot, both the wing tip and the hinge locations<br />
deflected in similar fashion, implying that the wing itself maintained its shape and deflected as a<br />
whole. This is in agreement with the visual inspection of the wing during and after the wing<br />
loading, which observed the wing deflecting as one piece. The wing displacement data is<br />
provided within the Appendix J.<br />
136
Project Final Report – CUDBF April 30 th , 2009<br />
ASEN 4028: <strong>Aerospace</strong> <strong>Senior</strong> <strong>Projects</strong><br />
The wing tip displacement was also compared with the COSMOSWorks FEM prediction<br />
together in Figure 120. The measured values are in red asterisks and the FEM predicted<br />
displacement is shown in black line. The model agrees with the measured deflection closely,<br />
especially below a lift load of 30 lbs. The 3g, or 23.5 lbs, predicted deflection of 0.69 inches<br />
agrees exceptionally well with the measured value of 0.71 inches, thus validating the FEM model<br />
of the wing used within COSMOSWorks. The maximum breaking load of the wing was<br />
recorded as 56 lbs, approximately 7.5 g’s; far exceeding the design required 3 g minimum wing<br />
loading. The recorded maximum displacement before failure was 2.25 inches at the wing tip,<br />
and 1.03 inches at the hinge location.<br />
Total Deflection at Tip and Hinge Locations, (in)<br />
2.5<br />
2<br />
1.5<br />
1<br />
0.5<br />
0<br />
Wing Loading Recorded Tip and Hinge Displacements with Error Bars<br />
Wing Tip Deflection (Max = 2.25")<br />
FEM Modeled Wing Tip Deflection<br />
Hinge Point Deflection (Max = 1.03")<br />
-0.5<br />
0 10 20 30 40 50 60<br />
Loaded Weight = Total Lift of Wing Half, (lbs)<br />
Figure 120: Wing Tip and Hinge location Displacement vs. Loading Plot with FEM Model Predicted<br />
Displacement<br />
13.1.4 Avionics Subsystem Verification and Validation<br />
In order to verify that the microcontroller was ready to be used in competition, two tests were<br />
conducted. The first test was to determine if the battery could power the circuit board for the<br />
duration of the missions. The battery was composed of three 1.5V watch batteries soldered<br />
together. A code was programmed to the PIC (Programmable Integrated Circuit) to continuously<br />
run. It was determined that the battery could supply sufficient power for 90 minutes and since<br />
the missions were only ten minutes in duration, the battery was deemed reliable. The second test<br />
was to determine if the microcontroller could receive false signals and release the payloads if the<br />
plane were in flight. The microcontroller was programmed with the complete flight code and the<br />
137
Project Final Report – CUDBF April 30 th , 2009<br />
ASEN 4028: <strong>Aerospace</strong> <strong>Senior</strong> <strong>Projects</strong><br />
transmitter was set so the microcontroller was disarmed. A power source was used for the<br />
transmitter, so the transmitter would not lose power during testing and provide false results. The<br />
setup of this experiment is shown in Figure 121.<br />
Figure 121: PIC testing<br />
The PIC was programmed such that if it got past the arming routine and starts to read the control<br />
surface signals, an LED would turn on. After 90 minutes of testing, no false signals were read<br />
by the microcontroller. To ensure communication between the transmitter and the PIC was still<br />
working, the arming/disarming switch was flipped at the end of the test. When the switch was<br />
moved to the “arm” position at the end of the test, the LED turned on, confirming no<br />
communication loss, indicating that the PIC was programmed correctly for the test. With the<br />
results of these two tests, it was determined that the microcontroller was indeed safe to use for<br />
competition.<br />
13.2 System Verification and Validation<br />
13.2.1Wingtip Lift Test<br />
Before any flight testing can be completed, had to be lifted off the ground by the wingtips. This<br />
test simulates a 2.5g load at the root of the wing, and is demonstrated to the judges upon<br />
technical inspection at competition. This test demonstrates that the aircraft’s structure is flight<br />
worthy. Each model of the Buff-2 successfully passed the wingtip lift test.<br />
13.2.2 System Flight Testing<br />
13.2.2.1 Flight Test #1<br />
The purpose of flight test #1 was to assess the general aerodynamic flying qualities and test the<br />
proof-of-concept of the flying wing design with the aerodynamic prototype, Buff-2A. As a safety<br />
precaution for the first flight, the aircraft was initially ballasted with weight in order to increase<br />
the static margin to 10% to ensure the aircraft was stable. The goal was to have the pilot takeoff,<br />
fly for no more than two minutes, and land the aircraft. The purpose of this flight test was purely<br />
to get qualitative data on aircraft handling characteristics from the pilot.<br />
138
Project Final Report – CUDBF April 30 th , 2009<br />
ASEN 4028: <strong>Aerospace</strong> <strong>Senior</strong> <strong>Projects</strong><br />
The first flight of the aerodynamic prototype was a success. The pilot reported that the aircraft<br />
was indeed stable, and the decision was made to remove the ballast to return the aircraft to its<br />
normal static margin of 5%. A long ground roll was noticed on takeoff. This was attributed to an<br />
analysis error made early on in the year. The relationship between the Cl in the takeoff distance<br />
equation and aircraft incidence angle was not recognized, which resulted in a lower aircraft Cl<br />
than predicted during initial analysis. To account for this lack of lift, an incidence angle of 5°<br />
was added in order to increase the takeoff C L to 0.6 in order to make the 100 ft takeoff<br />
requirement. More about this change can be found in section 8.1.3. Pictures from the first flight<br />
are shown in Figure 122.<br />
Figure 122: Pictures of Buff-2A flight test #1<br />
13.2.2.2 Flight Test #2 and #4<br />
The purpose of these flight tests were to gather more qualitative data on aircraft handling and to<br />
accustom the pilot to the aircraft before riskier tests were undertaken. Both of these flight tests<br />
had successful takeoffs and airborne maneuvering portions. However, both of these flight tests<br />
ended with the nose gear breaking on landing. The main reason for the nose gear failure was that<br />
the aircraft was designed to sustain normal main-gear-first landings of up to 4.0 g’s. However,<br />
the nose gear was not designed to sustain the loads encountered by fast nose-gear-first landings.<br />
The reason for the nose-gear-first landings was due to the pilot still getting accustomed to<br />
landing the aircraft. The Buff-2 Bomber was designed with a relatively small wing and high stall<br />
speed in order to reduce aircraft size, fit in the box, and reduces overall weight. However, these<br />
design decisions indicate that the aircraft must land at a relatively high speed (25 mph when<br />
empty) and the pilot needed some practice flying the aircraft in order to make purely main-gearfirst<br />
landings. The nose gear failures that occurred during these two flight tests led to a redesign<br />
of the nose gear shown in section 8.48. Pictures of the nose gear failure upon landing are shown<br />
in Figure 123.<br />
139
Project Final Report – CUDBF April 30 th , 2009<br />
ASEN 4028: <strong>Aerospace</strong> <strong>Senior</strong> <strong>Projects</strong><br />
Figure 123: Nose gear failures from flight test #2 and #4<br />
13.2.2.3 Flight Test #3<br />
The purpose of this flight was to test the takeoff distance using an added 5° incidence angle. The<br />
initial flights of the Buff-2A aircraft utilized a LiPo battery in order to test aerodynamic<br />
characteristics of the aircraft without the limitations inherit to NiMH batteries. Therefore, the<br />
takeoff distance will not exactly match the performance of the aircraft with a 24-cell competition<br />
battery pack. The aircraft was able to takeoff in just 25ft, proving that the new incidence angle<br />
did significantly reduce takeoff ground roll.<br />
During the flight, the aircraft experienced a left motor failure in flight, causing the aircraft to<br />
enter a spin and consequently crash. This caused the aircraft to enter a spin and crash.<br />
Fortunately, the resulting damage was minor: broken propellers, damaged motor mounts and<br />
damaged nose gear.<br />
Figure 124: Buff-2A motor failure during flight test #3<br />
140
Project Final Report – CUDBF April 30 th , 2009<br />
ASEN 4028: <strong>Aerospace</strong> <strong>Senior</strong> <strong>Projects</strong><br />
In order to isolate the cause of the motor failure, the propulsion system was bench tested on the<br />
ground after the flight. It was determined that there were no issues with the motors, speed<br />
controllers, or wiring. The problem was determined to be a receiver issue. The receiver used on<br />
this flight was a 72 MHz receiver instead of a 2.4 GHz receiver, which will be used at<br />
competition. During bench testing, there was significant interference noticed with the 72 MHz<br />
receiver. The possible cause of the crash was suspected to be from the faulty receiver which<br />
caused the motor to cut out in flight. The 72 MHz receiver was replaced with the 2.4 GHz<br />
receiver. There were no receiver issues after replacing the receiver.<br />
13.2.2.4 Flight Test #5<br />
Flight test #5 was another flight dedicated to getting the pilot used to flying the aircraft. During<br />
this flight, the aircraft experienced servo travel on the right elevator. The right elevator was<br />
deflected up about 20° while the pilot commanded neutral elevator. The red arrow shown in<br />
Figure 125 shows the deflection experienced in flight. The pilot aborted landing twice before<br />
being able to force the aircraft on the ground during the third attempt. After the flight, it was<br />
determined that the servo travel occurred because the servo was over-torqued.<br />
Figure 125: Elevator servo travel experienced on flight test #5<br />
During analysis, the worst case scenario torque calculated for the elevator servo was 92 oz/in.<br />
This would only occur at the aircraft top speed of 70 mph, and a full control surface deflection of<br />
25°. However, it was determined that the pilot would never use full control deflection at top<br />
speed. Therefore, a lower torque servo was used in order to save weight. The servo torque of<br />
48.6 oz/in was used since it still allows for 20° of deflection at 60 mph. However, this torque<br />
proved to be insufficient through flight testing. Therefore, the next size up in servos was chosen,<br />
providing 66.7oz/in of torque. This allows for full 25° elevator deflection at up to 60 mph, and<br />
up to 20° of elevator deflection at the top speed of 70 mph.<br />
141
Project Final Report – CUDBF April 30 th , 2009<br />
ASEN 4028: <strong>Aerospace</strong> <strong>Senior</strong> <strong>Projects</strong><br />
13.2.2.5 Flight Test #6<br />
After the pilot had five flights to practice flying the Buff-2 Bomber, and several initial design<br />
problems had been fixed, the team felt comfortable installing the expensive Eagle Tree telemetry<br />
system on the aircraft. The purpose of flight test #6 was to collect numeric flight data for the first<br />
time on the empty aircraft. The goal was to gather data on takeoff speed, landing speed, top<br />
speed, and average power draw and compare these to the predicted values.<br />
Takeoff and landing speed were calculated using the standard value of 1.3*V stall . Without any<br />
payload, the takeoff and landing speed was predicted to be 25 mph. The actual takeoff and<br />
landing speeds were 27 mph and 23 mph respectively. The slight discrepancy in actual versus<br />
predicted speed is due to the fact that RC aircraft takeoff and landing speeds are based upon pilot<br />
judgment, and nearly impossible to fly at the exact chosen speeds.<br />
After climbing to a safe altitude, the pilot attempted a brief (less than 10 second) full power<br />
acceleration to see if the aircraft could reach the predicted top speed of 100 ft/s (68 mph). The<br />
aircraft reached a top speed of 70 mph, exceeding the 100 ft/s top speed requirement set in the<br />
PDD. The aircraft wasn’t flown at the top speed for an extended period of time because with RC<br />
aircraft, there is a possible risk that the aircraft becomes unstable at such high speeds. A plot of<br />
indicated airspeed versus time is shown in Figure 126. The airspeed is accurate to within 5 mph.<br />
This discrepancy is due to imperfect mounting of the pitot tubes on the aircraft. The top speed<br />
run occurred 130 seconds into the flight and lasted for only 10 seconds, allowing the aircraft to<br />
accelerate from 35 mph to 70 mph (plus or minus 3mph).<br />
70<br />
Indicated Airspeed vs. Time<br />
60<br />
Indicated Airspeed (mph)<br />
50<br />
40<br />
30<br />
20<br />
10<br />
0<br />
0 20 40 60 80 100 120 140 160 180 200<br />
Time (seconds)<br />
Figure 126: Indicated airspeed versus time on flight test #6<br />
Finally, average current draw was predicted to be 20 amps. The average current draw throughout<br />
the flight was 15.5 amps. A plot of the predicted versus actual current draw is shown in Figure<br />
142
Project Final Report – CUDBF April 30 th , 2009<br />
ASEN 4028: <strong>Aerospace</strong> <strong>Senior</strong> <strong>Projects</strong><br />
127. The blue line represents the predicted value, and the red line represents the actual value.<br />
These values are accurate to within +/- 1 amp as specified by Eagle Tree.<br />
60<br />
50<br />
Power Draw<br />
Actual<br />
Predicted<br />
Amp Draw (amps)<br />
40<br />
30<br />
20<br />
10<br />
0<br />
0 20 40 60 80 100 120 140 160 180 200<br />
Time (seconds)<br />
Figure 127: Actual versus predicted amp draw on flight test #6<br />
The propulsion team assumed that the pilot would fly at the same cruise power setting regardless<br />
of aircraft weight, and would end up flying faster with the empty aircraft. As it turned out, the<br />
pilot decided to fly at the same cruise speed, and therefore flew at a lower power setting during<br />
empty flights. Overall, flight test #6 was a very successful flight in which takeoff speed, landing<br />
speed, top speed, and average current draw were all tested and shown to be very close to the<br />
predicted values.<br />
13.2.2.6 Flight Test #7 and 8<br />
The goal of flight test #7 and #8 was to fly the aircraft with a full rocket payload. In flight test<br />
#7, the aircraft was flown with a payload of two symmetric rockets (3.0lb of total payload) in<br />
order to assess the aerodynamic flying qualities and aircraft performance at a higher weight.<br />
Another goal of flight test #7 was to fly a competition style lap and verify it using the GPS<br />
receiver. The GPS coordinates were recorded and plotted on Google Earth. An image of the<br />
competition lap is shown in Figure 128.<br />
143
Project Final Report – CUDBF April 30 th , 2009<br />
ASEN 4028: <strong>Aerospace</strong> <strong>Senior</strong> <strong>Projects</strong><br />
Figure 128: Competition lap flown on flight test #7<br />
After the successful completion of flight test #7, without any pilot complaints, flight test #8 was<br />
conducted using the full four rocket payload (6.0 lbs of total payload). The goal of this flight was<br />
to collect data on takeoff speed, landing speed, and average current draw. Takeoff and landing<br />
speed were predicted using 1.3*Vstall. With the four rocket payload, takeoff and landing speed<br />
were predicted to be 35 mph. Takeoff speed was 35 mph, and landing speed occurred at 33 mph.<br />
Figure 129: Flight pictures from flight test #8<br />
The average current draw was 21.9 amps, slightly above the 20 amps predicted. A plot of the<br />
predicted versus actual current draw is shown in Figure 130. The blue line represents the<br />
predicted value, and the red line represents the actual value. The small discrepancy can be<br />
attributed to variations in pilot flying style. The average speed during the flight was 44.8 mph,<br />
very close to the 43 mph average speed during the empty flight. This data confirms that the pilot<br />
chose to fly at a constant airspeed, rather than a constant power setting. Ultimately, all these<br />
values proved to be close to the predicted values. Flight test #8 ended with a broken nose gear<br />
upon landing.<br />
144
Project Final Report – CUDBF April 30 th , 2009<br />
ASEN 4028: <strong>Aerospace</strong> <strong>Senior</strong> <strong>Projects</strong><br />
60<br />
50<br />
Power Profile<br />
Actual<br />
Predicted<br />
Amp Draw (amps)<br />
40<br />
30<br />
20<br />
10<br />
0<br />
0 50 100 150 200 250 300 350<br />
Time (seconds)<br />
Figure 130: Actual versus predicted amp draw on flight test #8<br />
13.2.2.7 Flight Test #9<br />
The purpose of flight test #9 was to fly the aircraft under asymmetric loads. This flight would<br />
test the asymmetric load for the smallest lateral CG shift. The configuration was two rockets: one<br />
inboard on one wing, and the other rocket outboard on the other wing. This resulted in a lateral<br />
CG shift of 0.9”. A diagram of the loading is shown in Figure 131.<br />
Figure 131: Asymmetric loading for flight test #9<br />
During the taxi test before the flight, the pilot noticed a significant lack of ground control. The<br />
nose gear twisted in one direction, and the servo was unable to turn the wheel in the other<br />
direction. To compensate for the lack of steering, it was decided to use elevator on takeoff to<br />
reduce the load on the nose gear and steer using the rudders. This method is commonly used by<br />
small aircraft for soft field takeoffs. However, this caused the aircraft to lift off at 25 mph instead<br />
of the predicted 30 mph takeoff speed. In addition to being slow, the aircraft took off at a very<br />
steep angle. This caused the aircraft to stall shortly after liftoff. The aircraft then rolled the<br />
opposite direction of the pull of the asymmetric load, and then crashed. This resulted in the loss<br />
of the Buff-2A, the aerodynamic prototype.<br />
145
Project Final Report – CUDBF April 30 th , 2009<br />
ASEN 4028: <strong>Aerospace</strong> <strong>Senior</strong> <strong>Projects</strong><br />
The cause of the crash was due to a weakened nose gear servo from previous flight test crashes.<br />
This resulted in the aircraft unable to steer on takeoff, resulting in a slow takeoff and subsequent<br />
stall.<br />
Two major lessons were learned from this flight test. The first is that all aircraft components<br />
should be carefully inspected before every flight. A flight test checklist was created in order to<br />
verify that critical systems are checked before flight. The flight test checklist created is shown in<br />
Figure 132. Another major lesson learned was to “Fix the problem, not compensate for it.” This<br />
lesson was applied throughout the rest of the project.<br />
Figure 132: Flight test checklist<br />
13.2.2.8 Flight Test #10<br />
The purpose of flight test #10 was to assess the general flying qualities of the new aircraft, the<br />
Buff-2B. In addition, this flight test would be the first flight test utilizing the NiMH battery pack.<br />
A series of events contributed to a crash on landing. First, the transmitter used for previous flight<br />
tests was under recall. The transmitter that was substituted for this flight did not have the dual<br />
rate control surface deflections programmed into it. Dual rate control surface deflections allow<br />
the pilot to have full control surface deflection for takeoff and landing, and then limit deflection<br />
once airborne in order to avoid over-controlling. Since the aircraft was not carrying any payload,<br />
the pilot decided it would be better to select the limited control surface deflections, assuming he<br />
would still have sufficient control for takeoff and landing. Another issue was that the ailerons on<br />
the first aircraft had been trimmed slightly up for some additional nose up control. The ailerons<br />
could not be digitally trimmed up on the transmitter being used. Finally, a wire on the battery<br />
146
Project Final Report – CUDBF April 30 th , 2009<br />
ASEN 4028: <strong>Aerospace</strong> <strong>Senior</strong> <strong>Projects</strong><br />
pack was frayed during loading. This meant that the battery pack could not deliver full power<br />
during flight. A picture of the damaged battery pack is show in Figure 133. The green box shows<br />
an intact wire, while the red box shows the frayed wire.<br />
Figure 133: Frayed wire on NiMH battery pack<br />
The aircraft approached nose low on landing, the pilot lacked full control surface authority, the<br />
usual nose up trim, and was unable to provide full power for a go around. This resulted in the<br />
aircraft striking the ground extremely hard and nose gear first. Fortunately, only minor damage<br />
was suffered. The propellers and motor mounts required replacement, and additional screws<br />
needed to be replaced on a wingtip hinge. Despite hitting the ground nose gear first, there was<br />
absolutely no damage to the nose gear. This hard impact proved that the nose gear design is<br />
effective at withstanding hard nose gear first landings and proved to be a vast improvement from<br />
the original design.<br />
13.2.2.9 Flight Test #11 and 12<br />
The purpose of flight test 11 and 12 was to get the Buff-2B airborne following the crash. Flight<br />
test 11 utilized a LiPo battery. This allowed the pilot to assess the aircraft handling qualities<br />
without introducing any propulsion battery issues into the mix. After a successful landing, the<br />
LiPo battery was replaced with the repaired NiMH battery pack. The goal of flight test 12 was to<br />
test the aircraft handling characteristics of the Buff-2B with the NiMH battery pack. The pilot<br />
reported he had sufficient power throughout the flight. This confirmed that the frayed battery<br />
wire caused the lack of power on flight test 10. After these successful flight tests, the aircraft was<br />
cleared to start flying actual competition missions. A picture of the Buff-2B airborne during<br />
flight test #12 is shown in Figure 134.<br />
147
Project Final Report – CUDBF April 30 th , 2009<br />
ASEN 4028: <strong>Aerospace</strong> <strong>Senior</strong> <strong>Projects</strong><br />
Figure 134: Buff-2B airborne during flight test #12<br />
13.2.2.10 Flight Test #13, 14, 15, and 16<br />
The purpose of flight test #13 was to assess the aerodynamic handling qualities of the Buff-2B<br />
with the empty water bottle payload (1.0 lbs of payload). Another goal was to trim the aircraft<br />
out for future flights with the water bottle payload.<br />
After the successful flight test #13, the competition course was marked out in order to begin<br />
simulating competition mission #1. Competition mission #1 consisted of two laps flown as fast<br />
as possible with the empty water bottle payload. The goal of flight test #14, 15, and 16 was to fly<br />
the competition course as fast as possible, compare lap time to the predicted value of 1:00 per<br />
lap, and verify the predicted power draw with the empty water bottle payload. The following<br />
times represent the time it took to fly two laps from takeoff until crossing the finish line of the<br />
second lap while airborne.<br />
Flight test #14 = 2:02<br />
Flight test #15 = 2:00<br />
Flight test #16 = 1:58<br />
These flight times closely matched the predicted value of 1:00 per lap, with the pilot improving<br />
after each flight attempt. The average power draw was recorded on flight test #15 and was 198<br />
W for the entire flight. This was very close to the predicted value of 200 W. Figures of current<br />
draw and battery voltage over time are shown in Figure 135. Battery power usage throughout the<br />
flight is shown in Figure 136.<br />
148
Project Final Report – CUDBF April 30 th , 2009<br />
ASEN 4028: <strong>Aerospace</strong> <strong>Senior</strong> <strong>Projects</strong><br />
35<br />
Amp Draw<br />
25<br />
Battery Pack Voltage<br />
30<br />
24<br />
Amp Draw (amps)<br />
25<br />
20<br />
15<br />
10<br />
5<br />
0<br />
0 20 40 60 80 100 120 140 160 180 200<br />
Time (seconds)<br />
Voltage (V)<br />
23<br />
22<br />
21<br />
20<br />
19<br />
18<br />
17<br />
16<br />
15<br />
0 20 40 60 80 100 120 140 160 180 200<br />
Time (seconds)<br />
Figure 135: Battery amp draw and voltage versus time on flight test #15<br />
500<br />
Power Usage<br />
450<br />
400<br />
Power Usage (W)<br />
350<br />
300<br />
250<br />
200<br />
150<br />
100<br />
50<br />
0<br />
0 20 40 60 80 100 120 140 160 180 200<br />
Time (seconds)<br />
Figure 136: Battery power draw versus time on flight test #15<br />
The largest observed discrepancy is the takeoff current draw was much lower than predicted. The<br />
reason for this was the pilot decided it was unnecessary to use full power on takeoff with a very<br />
light aircraft, since takeoff distance is a function of weight squared. This is better for the battery<br />
pack life as it reduces the heat generated on takeoff. The maximum current draw on takeoff was<br />
only 30 amps, compared to 60 amps that can be drawn when needed. Aside from this<br />
discrepency in flying style, all other predictions were very close to the predicted value. Some<br />
photographs from flight test #13-16 are shown in Figure 137.<br />
149
Project Final Report – CUDBF April 30 th , 2009<br />
ASEN 4028: <strong>Aerospace</strong> <strong>Senior</strong> <strong>Projects</strong><br />
Figure 137: Buff-2B carrying empty water bottle payload<br />
13.2.2.11 Flight Test #17<br />
The purpose of flight test #17 was to load the aircraft with ½ the weight of the full bottle, in<br />
order to get the pilot comfortable flying with a heavier load. The payload consisted of 4.0 lbs of<br />
ballast placed in the external battery box, a payload designed for Buff-2B flights with the Lipo<br />
battery. The pilot felt this was necessary due to the extreme change in payload weight from the<br />
empty bottle (1.0 lbs) to full bottle (9.0 lbs) flight. Since the full bottle weighs more than the<br />
entire aircraft, it was important to test the CG shift and flight characteristics at a lower weight.<br />
No quantitative data was measured on this flight since it does not simulate any competition<br />
missions. The flight test was successful, and the pilot felt comfortable moving on to the full<br />
bottle payload. Unfortunately, some ground damage occurred after the flight. The full bottle<br />
flight was pushed back until the next flight test.<br />
13.2.2.12 Flight Test #18 and #19<br />
The purpose of flight test #18 was to fly the aircraft with the empty water bottle payload as a<br />
pilot warm up for the full bottle flight. After a successful landing on flight #18, the pilot was<br />
ready to attempt the full bottle flight.<br />
The goal of flight test #19 was to fly the aircraft with the full water bottle payload (9.0 lb<br />
payload weight). The two requirements that needed to be tested on this flight were the 100 ft<br />
takeoff requirement under full weight, and the average power draw at full weight.<br />
The pilot noticed steering issues during taxi tests before the flight. The weight of the full water<br />
bottle compressed the nose gear significantly, making it difficult to steer the aircraft. The pilot<br />
decided it would be safer to slowly accelerate rather than push to make the 100 ft takeoff<br />
150
Project Final Report – CUDBF April 30 th , 2009<br />
ASEN 4028: <strong>Aerospace</strong> <strong>Senior</strong> <strong>Projects</strong><br />
distance and risk going off the runway and destroying the aircraft. The flight was not scrubbed<br />
because we could still gather the average battery power draw once airborne, and the pilot could<br />
still get experience flying at the maximum payload weight.<br />
The pilot was able to get airborne in 150 ft by slowly accelerating up to takeoff speed. Once<br />
airborne, the pilot did some maneuvering, flew one competition lap, and landed. The average<br />
power draw was 332 W, less than the 350 W of power draw. This was very significant because<br />
this proved that the aircraft could indeed make the four lap range with the full water bottle<br />
payload. A plot of power usage versus time is shown in Figure 138.<br />
800<br />
Power Usage<br />
700<br />
600<br />
Power Usage (W)<br />
500<br />
400<br />
300<br />
200<br />
100<br />
0<br />
0 20 40 60 80 100 120 140 160<br />
Time (seconds)<br />
Figure 138: Power draw for full water bottle payload flight<br />
13.2.2.13 Flight Test #20<br />
The goal of flight test #20 was to fly the aircraft with what would be the best case single rocket<br />
asymmetric load; one rocket inboard on one wing, and no rockets on the other wing. This led to a<br />
lateral CG shift of 4.0”.<br />
On takeoff roll, there was a strong pull to the left (the side on which the asymmetric rocket was<br />
placed). The aircraft almost went off the runway, so the pilot applied full up elevator in order to<br />
lift off before going off the runway. The aircraft rolled more than 90°, stalled, and impacted the<br />
ground. The left wingtip was broken in half, along with damaged motor mounts and propellers.<br />
The cause of the accident was traced to the fact that the asymmetric load on one wingtip caused<br />
one of the main gear to compress significantly, causing the aircraft to pull to the left and almost<br />
go off the runway. The full up elevator applied in order to make the aircraft takeoff only<br />
exacerbated the turn and led to the stall. The pilot also regretted not using opposite aileron during<br />
151
Project Final Report – CUDBF April 30 th , 2009<br />
ASEN 4028: <strong>Aerospace</strong> <strong>Senior</strong> <strong>Projects</strong><br />
the takeoff roll and rotation. For any future asymmetric loads, the pilot decided to use some<br />
opposite aileron input to counteract the asymmetric load.<br />
13.2.2.14 Flight Test #21<br />
Flight test #21 was the first flight of the Buff-2C aircraft. The purpose of this flight test was to<br />
get the aircraft airborne and find out if there were any major issues before competition. The pilot<br />
reported the plane was trimmed, and that the aircraft had plenty of thrust at the lower density<br />
altitude.<br />
13.2.2.15 Flight Test #22 (Competition flight #1)<br />
The goal of this flight test was to successfully complete competition mission #1 at the DBF<br />
competition. The requirement tested was to complete two laps under 2:00. On this flight, the<br />
pilot pushed the aircraft harder than he ever had, and the time to complete two laps from takeoff<br />
to crossing the finish line was 1:43, 15 seconds faster than before. The flight ended in a good<br />
landing. A picture of the Buff-2C shortly after takeoff is shown in Figure 139.<br />
Figure 139: Buff-2C after takeoff on mission #1 at DBF competition<br />
13.2.2.16 Flight Test #23 (Competition flight #2)<br />
The goal of this flight test was to successfully complete competition mission #2 at the DBF<br />
competition. The two requirements to be tested were the 100ft takeoff with full payload weight,<br />
and the four lap range with full payload weight. The aircraft was able to lift off at approximately<br />
90ft, verifying the 100ft takeoff requirement at a 5,000ft density altitude. This was the distance<br />
that the aircraft was designed to takeoff in. After takeoff, the pilot noticed he was holding a lot of<br />
up elevator, and decided to reduce up elevator in order to avoid a stall. This caused the nose of<br />
the aircraft to drop significantly resulting in a crash.<br />
The primary reason for this crash was lack of pilot experience flying with the full water bottle. It<br />
was deemed a very risky flight, and there was very little time available to test fly with this<br />
152
Project Final Report – CUDBF April 30 th , 2009<br />
ASEN 4028: <strong>Aerospace</strong> <strong>Senior</strong> <strong>Projects</strong><br />
payload. The team learned the value of flight testing and gaining flight experience is very<br />
important to project success.<br />
13.2.3 System Requirements Not Tested or Verified<br />
Two requirements were not tested. The first was the four lap aircraft range. This was supposed to<br />
be tested during competition flight #2, however the aircraft crashed shortly after takeoff. While<br />
this requirement was not directly tested, the four lap range was verified using a variety of<br />
subsystem tests.<br />
The average lap time was verified to be 1:00, and the average power draw during the full payload<br />
flight was tested to be 332W. The battery pack was tested on the ground during endurance<br />
testing to provide 350W of power for 4:10, before using the reserve power. This was greater than<br />
the power required, and for a longer period of time than it takes to fly four laps. Therefore, the<br />
four lap range was able to be verified using a variety of ground tests.<br />
The major requirement that could not be tested or verified was the ability of the aircraft to<br />
successfully fly under asymmetric loads. This test was attempted twice. Flight test #9 resulted in<br />
the loss of the Buff-2A, while flight test #20 resulted in major damage to the Buff-2B. Both of<br />
these failures were a result of lack of steering on take-off roll, and not necessarily due to the<br />
asymmetric load. The asymmetric load flight was going to be attempted during competition on<br />
the Buff-2C (which utilized wheels that did not compress as much, and a stronger nose gear<br />
servo for steering). However, the team ran out of time and was unable to attempt this flight test.<br />
153
Project Final Report – CUDBF April 30 th , 2009<br />
ASEN 4028: <strong>Aerospace</strong> <strong>Senior</strong> <strong>Projects</strong><br />
14.0 Project Management Plan<br />
Author: Daniel Colwell<br />
Co-Author: Shivali Bidaiah<br />
14.1 Organizational Responsibilities<br />
This project’s organization begins at the top with the customer, Dr. Brian Argrow. The<br />
customer’s requirements were provided to the project manager. The specialty engineers (safety,<br />
systems and software) take the requirements from the project manager and relay them to the<br />
subsystem technical leads. The safety engineer also oversees both the fabrication and testing<br />
engineers to ensure no test or manufacturing process presents a safety issue to a team member’s<br />
well being. Each technical subsystem consists of a lead engineer and multiple engineers,<br />
including underclassmen. The project’s webmaster and CFO operate in conjunction with the<br />
project manager. Figure 140 illustrates these concepts.<br />
Figure 140: Project Organizational Responsibilities<br />
The team member’s positions were determined with the help of the Myers-Briggs personality<br />
tests. The test resulted in 2 ENTJ (Field Marshal), 1 INFP (Healer), 2 INTJ (Mastermind), 2<br />
ESTJ (Supervisors), and 1 INFJ (Counselor). It was determined that the 2 masterminds (who<br />
also had the most DBF experience) would become the team’s project manager and systems<br />
engineer. A supervisor was chosen as the safety engineer to ensure maximum safety during the<br />
154
Project Final Report – CUDBF April 30 th , 2009<br />
ASEN 4028: <strong>Aerospace</strong> <strong>Senior</strong> <strong>Projects</strong><br />
project’s manufacturing and testing phases. Subsystem technical leads were chosen based on<br />
experience and interest in the given field.<br />
14.2 Work Breakdown Structure<br />
The breakdown of each subsystem’s work structure was determined based on technical<br />
responsibility. The program manager and system engineer focused on team organization and<br />
subsystem integration, respectively. Each subsystem has specific technical objectives which<br />
must be researched and designed to. The technical subsystems communicated with each other<br />
with the assistance of the project manager and systems engineer. Figure 141 is a diagram of this<br />
project’s work breakdown structure.<br />
Figure 141: Work Breakdown Structure<br />
14.3 Construction and Testing Schedule Analysis<br />
At the end of the fall semester, a detailed construction and testing schedule was drafted in order<br />
to organize the team towards completing the major goals of this project. In hindsight, the<br />
predicted schedule and actual schedule differd greatly. Both the actual and predicted timelines<br />
can be seen in Figure 142.<br />
155
Project Final Report – CUDBF April 30 th , 2009<br />
ASEN 4028: <strong>Aerospace</strong> <strong>Senior</strong> <strong>Projects</strong><br />
Figure 142: Predicted (Black) and Actual (Blue) Schedule<br />
14.3.1 Buff-2A Construction and Testing Schedule<br />
The aerodynamic model, the Buff-2A, was constructed and test flown on time. Due to the time<br />
required to make numerous nose gear repairs, the duration of the Buff-2A’s flight testing was<br />
carried out longer than originally anticipated. The tests that the team wished to complete with<br />
the Buff-2A therefore extended past its predicted time and the work spent on repairs caused<br />
delays for other aspects of the project.<br />
14.3.2 Buff-2B Construction and Testing Schedule<br />
The initial construction of the Buff-2B was delayed for two reasons. First, the numerous repairs<br />
to the Buff-2A drew attention away from early construction on the Buff-2B. Second, the foam<br />
cores, which initially were to be ordered before the Winter Break, were instead ordered after.<br />
Waiting for these materials to arrive delayed the start of construction. The construction duration<br />
also took longer than anticipated. It was originally assumed that lessons learned from the<br />
aerodynamic model would allow the construction of the Buff-2B to be faster. Instead,<br />
construction techniques needed to be learned in order to construct the elements not included in<br />
the Buff-2A. This led to a much longer construction time than originally expected and thus<br />
delayed the flight schedule.<br />
14.3.3 Buff-2C Construction and Testing Schedule<br />
The construction of the Buff-2C was delayed due to the delay of the Buff-2B. The construction<br />
duration of the Buff-2C was similar to the predicted duration. This unfortunately left little test<br />
flight time for the Buff-2C before competition.<br />
14.4 Project Budget Analysis<br />
The overall project budget was estimated from past projects as well as quotes provided by<br />
suppliers. The budget was divided into two equally important components of aircraft<br />
construction and travel as both are needed for the project.<br />
156
Project Final Report – CUDBF April 30 th , 2009<br />
ASEN 4028: <strong>Aerospace</strong> <strong>Senior</strong> <strong>Projects</strong><br />
The funding available for the project was provided by the <strong>Aerospace</strong> <strong>Engineering</strong> <strong>Sciences</strong><br />
Department at the University of Colorado, the <strong>Engineering</strong> Excellence Fund, and Lockheed<br />
Martin Corporation. Each internally funded project receives $4,000 funding from AES. Since<br />
this funding was inadequate for the entire project, additional funding was sought from EEF and<br />
Lockheed Martin. The team applied for and received funding from EEF on the order of $2,000.<br />
Lockheed Martin, a longtime supporter of CUDBF and RECUV, also supported the project by<br />
providing a generous donation of $10,000. Funding under these sponsors brought the CUDBF<br />
budget to a maximum of $16,000.<br />
Aircraft construction was composed of four major categories: wing, propulsion, avionics, and<br />
missions. A breakdown of the entire project budget can be observed in Figure 143 on page 158<br />
and Table 26 on page 159. The total estimated cost of the project was $15,162 including a 25%<br />
margin added to all spending. This placed the project under the $16,000 limit by $838. The<br />
actual cost of the budget was $13,955.<br />
13.4.1 Wing Budget<br />
The major components for the wing construction were the foam wing cores and the balsa<br />
sheeting. Based on previous contact with FlyingFoam.com, the estimated cost for custom cut<br />
foam cores is approximately $1,500 for 12 sets of wings. Balsa sheeting will be purchased from<br />
Specialized Balsa and is quoted to cost $957. The reinforcements and other structural<br />
components will cost approximately $450 while adhesives cost an estimated $300. The total cost<br />
to build all the wings is approximately $3,291. Due to an overestimation of the foam core costs<br />
from FlyingFoam.com, the total cost of the wing construction was cheaper than expected. The<br />
actual cost of the wing construction was $3,107.<br />
13.4.2 Propulsion Budget<br />
Propulsion components were comprised of the battery cells, motors, gearboxes, and ESCs.<br />
Competition battery cells were been ordered from CheapBatteryPacks.com with a discount value<br />
of 25% for a total of $180. An additional LiPo battery was ordered to allow for longer test<br />
flights for $200. Neu Motors agreed to a 50% discount on all parts, bringing the motor and<br />
gearbox costs to $375 and $300, respectively. A 30% discount was received from Castle<br />
Creations, allowing the purchase of ESCs to cost $686. With the addition of propellers and<br />
wiring, the total propulsion team cost was estimated to be $1,841. The actual costs of propulsion<br />
were much higher than anticipated. Backup motors, batteries, propellers, and speed controllers<br />
were ordered to replace broken items during testing. Additional shipping costs also inflated the<br />
expenditures. The total budget for propulsion was $3,128.<br />
13.4.3 Avionics Budget<br />
The avionics system was comprised of the transmitter, receiver and servos. The team needed to<br />
purchase a DX6i transmitter and BR7000 receiver from Spektrum for $320. Servos and<br />
connectors were purchased from ServoCity.com for about $680. The total budget for avionics<br />
was estimated to be $1,000. The actual costs of avionics was $1,551. This was due to ordering a<br />
157
Project Final Report – CUDBF April 30 th , 2009<br />
ASEN 4028: <strong>Aerospace</strong> <strong>Senior</strong> <strong>Projects</strong><br />
backup BR6000 receiver, and multiple new servos to replace malfunctioning servos during the<br />
testing phase.<br />
13.4.4 Missions Budget<br />
The team needed to purchase payloads as well as construct the payload release system. Estes<br />
rockets were ordered from ACSupplyco.com for a discounted price of $10 per rocket. Eight<br />
rockets were ordered in order to have a full flying set as well as replacements. Two water bottles<br />
were ordered from McMaster-Carr for a total price of $50. The components for the release<br />
system were ordered from McMaster-Carr for approximately $80. Finally, balsa material was<br />
ordered from Specialized Balsa for an estimated price of $200. The total cost of the missions<br />
and payload is estimated to be $410. The actual missions costs was $681. Similar to avionics,<br />
the missions team needed to order new servos in order to replace malfunctioning servos.<br />
13.4.5 Travel Budget<br />
The total cost of travel consists of food, hotel, and transportation costs. The team will depart<br />
Boulder on Thursday, April 16 th and leave Tucson on Sunday, April 19 th . A $40 food budget is<br />
required to be supplied to each person per day by law. Each student traveling will therefore<br />
require $160 for the entire trip. A hotel reservation for a two bedroom at the Days Inn in Tucson<br />
is $72 per night, totaling $108 per person for the entire stay. Therefore taking 16 students to<br />
competition will cost $4,288.<br />
Renting a large van for the duration of the trip will cost approximately $300. The RECUV trailer<br />
will be towed to the competition site by Eric Hall’s GMC Sierra 150. The drive from Tucson to<br />
Boulder is 921 miles. After adding travel within Tucson of 180 miles, the total round trip will be<br />
approximately 2,022 miles. Assuming gasoline prices of $2.50 per gallon and gas mileage of<br />
12.5 miles per gallon, the total gas cost is estimated to be $808. The total cost of the trip<br />
combining student and transportation costs is currently estimated to be $5,388.<br />
Cost Breakdown<br />
Propulsion<br />
22%<br />
Travel<br />
36%<br />
Avionics<br />
11%<br />
Missions<br />
5%<br />
Wing<br />
Construction<br />
22%<br />
Administrative<br />
4%<br />
Figure 143: Project Budget Breakdown<br />
158
Project Final Report – CUDBF April 30 th , 2009<br />
ASEN 4028: <strong>Aerospace</strong> <strong>Senior</strong> <strong>Projects</strong><br />
Table 26: Project Budget Breakdown<br />
Item Predicted Cost ($) Actual Cost ($)<br />
Propulsion 1,841.00 3,128.71<br />
Wing Construction 3,291.00 3,107.62<br />
Administrative 200.00 486.35<br />
Missions 410.00 681.40<br />
Avionics 1,000.00 1,551.04<br />
Travel 5,388.00 5,000.00<br />
Total 12,130.00 13,955.12<br />
Figure 144 shows the costs incurred over the project lifecycle. As expected, the costs incurred by<br />
the project were lowest in the conceptual phase and increased as the project evolved into the<br />
feasibility, detailed design and implementation phases. The costs in the implementation phase<br />
were the highest as this was the fabrication and test phase of the project. In the termination<br />
phase, the costs leveled out with the project closure, as expected.<br />
Cost Over the Project Lifecycle<br />
3,500.00<br />
3,000.00<br />
Conceptua<br />
l Phase<br />
Feasibility<br />
Phase<br />
Detailed<br />
<strong>Design</strong> Phase<br />
Implementation<br />
Phase<br />
Termination<br />
Phase<br />
2,500.00<br />
Cost ($)<br />
2,000.00<br />
1,500.00<br />
1,000.00<br />
500.00<br />
0.00<br />
Resources<br />
Used<br />
SEP 08 OCT 08 NOV 08 DEC 08 JAN 09 FEB 09 MAR 09 APR 09<br />
Cost<br />
Figure 144: Costs over Project Life Cycle<br />
14.5 Specialized Facilities and Resources<br />
14.5.1 RECUV Fabrication Lab<br />
As requested by our customer Dr. Brian Argrow, the CUDBF team will operate primarily out of<br />
the RECUV Fabrication Lab. All team members were given access to the lab in order to be able<br />
to work without restrictions. The lab offered a place for the team to meet as well as assemble<br />
and store the aircraft. The lab has three foam cutting wires of 28 inches, 40 inches, and 52<br />
inches in length as well as two power supplies to heat the wire. In the back room of the lab there<br />
are two belt/disc sanders, table sander, jig saw, band saw, and a drill press capable of satisfying<br />
most of the team’s wood and metal working needs. Finally, the lab has electronic capabilities<br />
159
Project Final Report – CUDBF April 30 th , 2009<br />
ASEN 4028: <strong>Aerospace</strong> <strong>Senior</strong> <strong>Projects</strong><br />
required for assembling the aircraft propulsion system and battery chargers needed for the<br />
battery packs.<br />
14.5.2 Boulder Aeromodeling Society Airfield<br />
In order to test fly the aircraft safely under AMA requirements, the aircraft needs to be test flown<br />
at an AMA approved airfield. The BAS airfield was the closest and most accommodating<br />
airfield for the project. A requirement to use the airfield is to be a member of the AMA. Four<br />
team members were AMA members. Two members were also BAS members, which allowed<br />
the team to have copies of the key to the lock at the airfield, providing access at all times.<br />
14.5.3 AES Machine and Electronics Shop<br />
The team had access to the AES Machine Shop operated by Matt Rhode and the AES Electronics<br />
Shop operated by Trudy Schwartz. This provided the team access to specialized machines not<br />
available in the RECUV Fabrication Lab during regular business hours.<br />
160
Project Final Report – CUDBF April 30 th , 2009<br />
ASEN 4028: <strong>Aerospace</strong> <strong>Senior</strong> <strong>Projects</strong><br />
15.0 Lessons Learned<br />
Author: Shivali Bidaiah<br />
15.1 Manufacturing Lessons Learned<br />
Since most components were built without the use of a CNC, the importance of precision and<br />
detail in the manufacturing process was a lesson learned among the team. The precision of<br />
several parts also improved between the three aircraft that were built. Another useful lesson<br />
learned was developing a naming convention when labeling SolidWorks files. Since several<br />
SolidWorks files were used to determine the dimensions to build parts, it became apparent that<br />
having a standard naming convention would make the process seamless, without requiring the<br />
presence of other team members to obtain dimensions. A manufacturing checklist would have<br />
kept the team up-to-date on the status of each component and it might have made the<br />
manufacturing process more efficient. Another important lesson learned during manufacturing<br />
was to improve knowledge redundancy across the team. For example, certain members<br />
developed expertise in building specific components. If more than one member had this<br />
expertise, it would have allowed for a more flexible schedule. Finally, a very important lesson<br />
learned was to be prepared for the worst during the process which include but are not limited to<br />
mishaps with gorilla glue, machining mistakes, and accidents.<br />
15.2 Testing Lessons Learned<br />
Since testing was a large part of assessing the system performance, the team learned that it is<br />
very important to be prepared before every flight test. A flight test checklist was created to<br />
ensure that all components were inspected before flying to avoid a crash. Another important<br />
lesson learned during testing was that any problems that arose had to be fixed rather than<br />
compensated for, and all assumptions and initial calculations that were performed needed to be<br />
re-visited. The most important lesson learned in testing was that flight tests needed to happen<br />
frequently because it allowed the team to assess the overall performance of the system. The test<br />
schedule must have a buffer to account for unpredictable weather.<br />
15.3 General Lessons Learned<br />
The major lessons learned for the project overall were to have a better schedule, improve team<br />
communication and to prepare for the worst. At the end of the project, there was a large<br />
discrepancy between the actual and predicted timelines in the project schedule. In order to<br />
prevent this in the future, it will be helpful to have a day-to-day schedule with each team<br />
member’s task. This will help evaluate each team member’s performance and will also<br />
demonstrate the work that each member is accountable for. It was also learned throughout this<br />
project that many unexpected events occur in the project life-cycle and it is extremely difficult to<br />
account for these events in an initial risk assessment. Therefore, it is always good to be prepared<br />
for the worst so that unexpected events can be handled appropriately.<br />
161
Project Final Report – CUDBF April 30 th , 2009<br />
ASEN 4028: <strong>Aerospace</strong> <strong>Senior</strong> <strong>Projects</strong><br />
16.0 Acknowledgements<br />
16.1 Professional Advisors<br />
The CUDBF team would like to thank Dr. Brian Argrow for being the team’s customer and a<br />
faculty advisor. The faculty advisors Dr. Donna Gerren and Kurt Maute, <strong>Senior</strong> Instructor Trudy<br />
Schwartz, and Facilities Coordinator Matt Rhode have given their valuable time and years of<br />
experience to help the team succeed this semester. Finally, the team would like to thank Scott<br />
Eichelberger and Kelvin Quarels for their advice throughout the semester.<br />
16.2 Graduate Advisors<br />
The team would like to thank graduate advisors Josh Fromm, Jason Roadman and Spencer Riggs<br />
for their valuable input throughout the design process. CUDBF would also like to thank Stefan<br />
Elsener and Oleg Usmanov, alumni of both CUDBF and the University of Colorado, for their<br />
assistance.<br />
16.3 Undergraduate Assistants<br />
CUDBF would like to thank our many underclass assistants. Their involvement is a project<br />
requirement and their contributions have been invaluable. Aaron Russert, Alex Wilkins,<br />
Alexander Granrud, Brandon Bosomworth, Caleb Bloodworth, Cameron Trussel, Cassie Clark,<br />
Colin Apke, Elliott Richerson, Emily Howard, Jacob Varhus, Josh Yeaton, Robert Rogers, Scott<br />
Brown, Tom Wormer, Vu Nguyen, Wences Shaw-Cortez, and Zach Dischner.<br />
16.4 Student Assistance<br />
The CUDBF team would like thank Jeff Mullen for his assistance in using PowerFLOW<br />
software. Nate Weigle also deserves thanks for his assistance for testing the nature of the foamcomposite<br />
material. Special thanks to David Berman for his assistance on the AutoIt software.<br />
16.5 Experienced RC Advisors<br />
This project would like to thank James Mack for his input and agreeing to pilot our aircraft. The<br />
team also thanks RC extraordinaire Frank Dilatush for his advice.<br />
16.6 Sponsors<br />
The CUDBF team would like to thank Lockheed Martin Corp. and EEF for their sponsorship on<br />
this project. This project would not be possible without their generous help. A special thanks to<br />
Neu Motors, Castle Creations, RC Hobbies, TruFire, and Cheap Battery Packs for discounts on<br />
their products.<br />
162
Project Final Report – CUDBF April 30 th , 2009<br />
ASEN 4028: <strong>Aerospace</strong> <strong>Senior</strong> <strong>Projects</strong><br />
17.0 References<br />
1 "DBF Rules." AIAA Student <strong>Design</strong>/Build/Fly Competition. 13 Dec. 2008<br />
.<br />
2 "McMaster-Carr." McMaster-Carr. 13 Dec. 2008 .<br />
3 "AC Supply Wholesale Educational products." Welcome to AC Supply Co. 13 Dec. 2008<br />
.<br />
4 " TerraBreak.org: An independent <strong>Design</strong>/Build/Fly support site ." TerraBreak.org: An<br />
independent <strong>Design</strong>/Build/Fly support site . 13 Dec. 2008 .<br />
5 Drela, Mark, and Harold Youngren. Athena Vortex Lattice (AVL). Computer software. AVL. 4<br />
Aug. 2008. 13 Dec. 2008 .<br />
6 The MathWorks. Matlab. Vers. R2008b. Computer software.<br />
7 Bennett, Jonathan. "AutoIT V3."AutoIT. 13 Dec. 2008<br />
.<br />
8 Drela, Mark, and Harold Youngren. XFOIL. Vers. 6.97. Computer software. XFOIL. 7 Apr.<br />
2008. 13 Dec. 2008 .<br />
9 "T&J Models - Hughes H-1." T&J Models - homepage. 13 Dec. 2008<br />
.<br />
10 Gerren, Donna. "Aircraft <strong>Design</strong>." Aircraft <strong>Design</strong>. University of Colorado, Boulder, CO.<br />
11 Roskam, Jan. Airplane <strong>Design</strong>: Layout <strong>Design</strong> of Landing Gear & Systems. Lawremce,<br />
Kansas: <strong>Design</strong> Analysis & Research, 2000.<br />
12 National Instruments. LabView. Vers. 8.6. Computer software.<br />
13 "Eagle Tree Systems." 2005. 13 Dec. 2008 .<br />
14 "Neu Motors." Brantuas. 13 Dec. 2008 .<br />
1 5 "Servos." JR Radios. Horizon Hobbies. .<br />
16 Exa Corporation. PowerFLOW. Vers. 2008. Computer software.<br />
17 Exa Corporation. PowerCASE. Vers. 2008. Computer software.<br />
18 Exa Corporation. PowerVIZ. Vers. 2008. Computer software.<br />
19 "Terminal Velocity (gravity and drag)." Space Flight Systems Directorate / Glenn Research<br />
Center. 13 Dec. 2008 .<br />
163
Project Final Report – CUDBF April 30 th , 2009<br />
ASEN 4028: <strong>Aerospace</strong> <strong>Senior</strong> <strong>Projects</strong><br />
20 Hoerner, Sighard F.. Aerodynamic Drag: Practical Data on Aerodynamic Drag. Brick Town,<br />
N.J.: Sighard F. Hoerner, 1951.<br />
21 "Strong Neodymium Magnets Rare Earth K&J Magnetics."Strong Neodymium Magnets Rare<br />
Earth K&J Magnetics. 13 Dec. 2008 .<br />
22 COSMOSWorks. Computer software. SolidWorks. 28 Oct. 2008<br />
.<br />
23 SLKelectronics. ElectriCalc. Vers. 2.2. Computer software. ElectriCalc. 26 Aug. 2006. 13<br />
Dec. 2008 .<br />
24 Maute, Kurt. Lecture. Advisor Meetings. University of Colorado, Boulder, CO.<br />
25 Ashby, Michael, David Cebon, and Hugh Shercliff. Materials: <strong>Engineering</strong>, Science,<br />
Processing and <strong>Design</strong>. St. Louis: Butterworth-Heinemann, 2007.<br />
26 "Young's Modulus - Density." Cambridge University <strong>Engineering</strong> Dept - Materials Group. 27<br />
Nov. 2008 .<br />
27 Dassault Systems SolidWorks Corporation. SolidWorks. Vers. 2008. Computer software.<br />
28 "IKEA | Built-in kitchens | AKURUM/RATIONELL system | INTEGRAL | Hinge." Welcome<br />
to IKEA.com. 28 Nov. 2008 .<br />
29 Advanced Aircraft Analysis 3.12. Released by <strong>Design</strong>, Analysis, Research Corporation<br />
(DARCorporation). 2008<br />
30 Vable, Madhukar. Mechanics of Materials. New York: Oxford University Press, USA, 2002.<br />
31 "Cooper Bussmann - Cooper Bussmann Home." Cooper Bussmann - Cooper Bussmann<br />
Home. 13 Dec. 2008 .<br />
32 "Spektrum RC." 2005. Horizon Hobby, Inc. 13 Dec. 2008 .<br />
33 "Hitec RCD." 2007. 13 Dec. 2008 .<br />
164