Modified Academic Achievement Standards (AA-MAS) Topics ...
Modified Academic Achievement Standards (AA-MAS) Topics ...
Modified Academic Achievement Standards (AA-MAS) Topics ...

You also want an ePaper? Increase the reach of your titles
YUMPU automatically turns print PDFs into web optimized ePapers that Google loves.
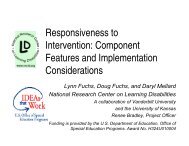
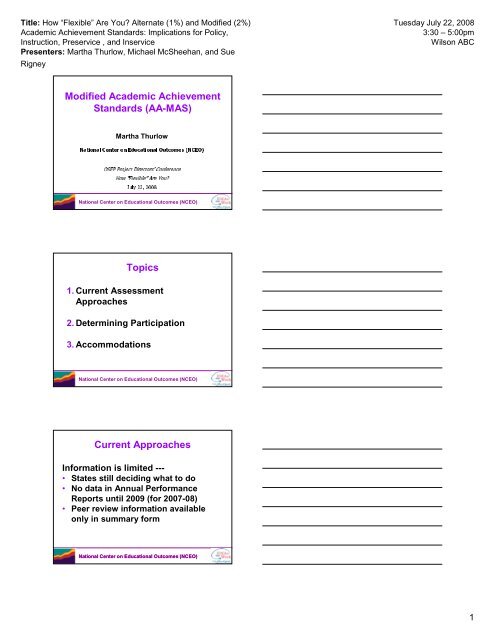
Title: How “Flexible” Are You Alternate (1%) and <strong>Modified</strong> (2%)<br />
<strong>Academic</strong> <strong>Achievement</strong> <strong>Standards</strong>: Implications for Policy,<br />
Instruction, Preservice , and Inservice<br />
Presenters: Martha Thurlow, Michael McSheehan, and Sue<br />
Rigney<br />
Tuesday July 22, 2008<br />
3:30 – 5:00pm<br />
Wilson ABC<br />
<strong>Modified</strong> <strong>Academic</strong> <strong>Achievement</strong><br />
<strong>Standards</strong> (<strong>AA</strong>-<strong>MAS</strong>)<br />
Martha Thurlow<br />
on National Center on Educational Outcomes (NCEO)<br />
Project Directors’Conference OSEP<br />
<strong>Topics</strong><br />
“Flexible”Are You July 22, 2008 How<br />
1. Current Assessment<br />
Approaches<br />
2. Determining Participation<br />
3. Accommodations<br />
National Center on Educational Outcomes (NCEO)<br />
Current Approaches<br />
Information is limited ---<br />
• States still deciding what to do<br />
• No data in Annual Performance<br />
Reports until 2009 (for 2007-08)<br />
• Peer review information available<br />
only in summary form<br />
National Center on Educational Outcomes (NCEO)<br />
1
Title: How “Flexible” Are You Alternate (1%) and <strong>Modified</strong> (2%)<br />
<strong>Academic</strong> <strong>Achievement</strong> <strong>Standards</strong>: Implications for Policy,<br />
Instruction, Preservice , and Inservice<br />
Presenters: Martha Thurlow, Michael McSheehan, and Sue<br />
Rigney<br />
Tuesday July 22, 2008<br />
3:30 – 5:00pm<br />
Wilson ABC<br />
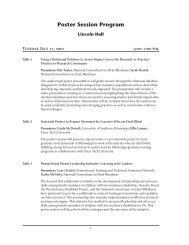
In July 2007 Five States Had an Assessment<br />
that They Believed Was an <strong>AA</strong>-<strong>MAS</strong>:<br />
• Kansas<br />
• Louisiana<br />
• North Carolina<br />
• North Dakota<br />
• Oklahoma<br />
Maryland had information on its Web site<br />
about an <strong>AA</strong>-<strong>MAS</strong> that the state was<br />
developing.<br />
National Center on Educational Outcomes (NCEO)<br />
Type of Assessment/Types of Questions<br />
National Center on Educational Outcomes<br />
State Portfolio Multiple Choice Constructed Response Writing Prompt KS LA X MD NC ND X<br />
(NCEO)<br />
X X Total 1 5 1 2 OK<br />
Number of States That Made Selected Changes<br />
Change<br />
No. of States<br />
Distractor Removed 4<br />
Fewer Items 4<br />
Simplified Language 4<br />
Shorter Passages 3<br />
Segmentation of Passages 1<br />
National Center on Educational Outcomes (NCEO)<br />
2
Title: How “Flexible” Are You Alternate (1%) and <strong>Modified</strong> (2%)<br />
<strong>Academic</strong> <strong>Achievement</strong> <strong>Standards</strong>: Implications for Policy,<br />
Instruction, Preservice , and Inservice<br />
Presenters: Martha Thurlow, Michael McSheehan, and Sue<br />
Rigney<br />
Tuesday July 22, 2008<br />
3:30 – 5:00pm<br />
Wilson ABC<br />
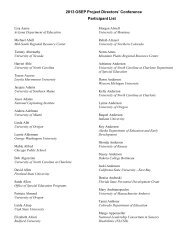
Determining Eligibility Criteria for<br />
<strong>AA</strong>-<strong>MAS</strong><br />
What do we know about the students<br />
for whom the <strong>AA</strong>-<strong>MAS</strong> is appropriate<br />
• Previous Studies<br />
• Current Analyses<br />
• Peer Guidance Suggestions<br />
National Center on Educational Outcomes (NCEO)<br />
Previous Studies<br />
National Center on Improvement of Educational<br />
Outcomes<br />
Colorado Study Requested by<br />
Legislature<br />
Only .06% for Reading and .15% for Math in the gap2005<br />
Simpson, and Gong, Marion, From<br />
Georgia Study of Persistently Low Performing Students<br />
Highlighted again instructional and accommodations<br />
issues<br />
National Center on Educational Outcomes (NCEO)<br />
From Cortiella (2007), Learning Opportunities for Your<br />
Child Through Alternate Assessments – Alternate<br />
Assessments based on <strong>Modified</strong> <strong>Achievement</strong> <strong>Standards</strong><br />
National Center on Educational Outcomes (NCEO)<br />
3
Title: How “Flexible” Are You Alternate (1%) and <strong>Modified</strong> (2%)<br />
<strong>Academic</strong> <strong>Achievement</strong> <strong>Standards</strong>: Implications for Policy,<br />
Instruction, Preservice , and Inservice<br />
Presenters: Martha Thurlow, Michael McSheehan, and Sue<br />
Rigney<br />
Tuesday July 22, 2008<br />
3:30 – 5:00pm<br />
Wilson ABC<br />
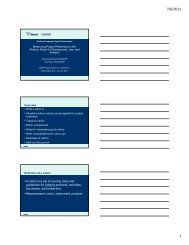
2008 Study<br />
Number of States With Selected Eligibility Criteria<br />
Criteria<br />
National Center on Educational Outcomes (NCEO)<br />
No. of States<br />
Student has IEP 10<br />
Student not progressing at expected rate 8<br />
Student is learning grade-level content 6<br />
Student has attempted/failed other tests 6<br />
Student is not receiving instruction on extended/<br />
alternate standards or functional skills<br />
6<br />
Not based on disability category 5<br />
Not based on attendance 5<br />
Not due to social, cultural, language, economic, or<br />
environmental factors<br />
5<br />
Identifying Accommodations for<br />
<strong>AA</strong>-<strong>MAS</strong><br />
• State Approaches<br />
• Accommodations issues for<br />
regular assessment<br />
• Integration of “accommodations”<br />
and universal design principles<br />
into the regular assessment first,<br />
then in the design of the <strong>AA</strong>-<strong>MAS</strong><br />
National Center on Educational Outcomes (NCEO)<br />
State Approaches – Accommodations Incorporated<br />
into <strong>AA</strong>-<strong>MAS</strong> Design<br />
Accommodation<br />
No. of States<br />
Fewer items/page 3<br />
Larger font size 3<br />
Calculator 2<br />
Breaks as needed 2<br />
Key text underlined/bolded 1<br />
National Center on Educational Outcomes (NCEO)<br />
4
Title: How “Flexible” Are You Alternate (1%) and <strong>Modified</strong> (2%)<br />
<strong>Academic</strong> <strong>Achievement</strong> <strong>Standards</strong>: Implications for Policy,<br />
Instruction, Preservice , and Inservice<br />
Presenters: Martha Thurlow, Michael McSheehan, and Sue<br />
Rigney<br />
Tuesday July 22, 2008<br />
3:30 – 5:00pm<br />
Wilson ABC<br />
Reading Assessment Accommodation Rates in Elementary School: Percentage of<br />
Students with IEPs Taking the Regular Reading Assessment with Accommodations<br />
32<br />
63<br />
54<br />
2005-2006<br />
40<br />
8<br />
72<br />
md<br />
55<br />
47<br />
52<br />
67<br />
41<br />
11<br />
49<br />
52<br />
40<br />
63<br />
35<br />
42<br />
39<br />
71<br />
1<br />
22<br />
md<br />
71<br />
md<br />
53<br />
52<br />
47<br />
77 79<br />
52<br />
61<br />
59<br />
36<br />
80<br />
69<br />
61<br />
24<br />
66<br />
33<br />
57<br />
69<br />
47<br />
45<br />
20 62<br />
94 AS<br />
73<br />
59<br />
BIE<br />
64<br />
65<br />
73<br />
CNMI<br />
Key<br />
≥75% (n=3 regular states and 1 unique states)<br />
50% - 74% (n=25 regular states and 5 unique states)<br />
26% - 49% (n=13 regular states and 1 unique states)<br />
< 25% (n=6 regular states and 0 unique states)<br />
md =missing data (n=3 regular states and<br />
3 unique states)<br />
71<br />
md<br />
67<br />
md<br />
59<br />
md<br />
43<br />
DC<br />
FSM<br />
GU<br />
Palau<br />
PR<br />
RMI<br />
VI<br />
National Center on Educational Outcomes (NCEO)<br />
Reading Assessment Accommodation Rates in High School: Percentage of Students<br />
with IEPs Taking the Regular Reading Assessment with Accommodations<br />
18<br />
43<br />
53<br />
2005-2006<br />
36<br />
5<br />
51<br />
md<br />
53<br />
44<br />
47<br />
37<br />
md<br />
md<br />
66<br />
49<br />
5<br />
23<br />
56<br />
41<br />
22<br />
45<br />
35<br />
59<br />
70<br />
md<br />
59<br />
81<br />
62<br />
42<br />
53<br />
73<br />
27<br />
65<br />
43<br />
46<br />
0<br />
50<br />
57<br />
77 76<br />
38<br />
79<br />
46<br />
59<br />
0<br />
0 61<br />
100<br />
AS<br />
59<br />
22<br />
BIE<br />
39<br />
28<br />
42<br />
CNMI<br />
Key<br />
≥75% (n=4 regular states and 1 unique state)<br />
50% - 74% (n=17 regular states and 2 unique states)<br />
26% - 49% (n=17 regular states and 3 unique states)<br />
< 25% (n=8 regular states and 1 unique state)<br />
md =missing data (n=4 regular states and<br />
3 unique states)<br />
48<br />
md<br />
61<br />
md<br />
46<br />
md<br />
53<br />
DC<br />
FSM<br />
GU<br />
Palau<br />
PR<br />
RMI<br />
VI<br />
National Center on Educational Outcomes (NCEO)<br />
National Center on Educational Outcomes (NCEO)<br />
5