Technology, R&D, and Efficiency - McGraw-Hill Higher Education
Technology, R&D, and Efficiency - McGraw-Hill Higher Education
Technology, R&D, and Efficiency - McGraw-Hill Higher Education

You also want an ePaper? Increase the reach of your titles
YUMPU automatically turns print PDFs into web optimized ePapers that Google loves.
IN THIS CHAPTER YOU WILL LEARN:<br />
1 The differences between invention,<br />
innovation, <strong>and</strong> technological diffusion.<br />
2 How entrepreneurs <strong>and</strong> other innovators<br />
further technological advance.<br />
3 How a firm determines its optimal amount<br />
of research <strong>and</strong> development (R&D).<br />
4 Why firms can benefit from their innovation even<br />
though rivals have an incentive to imitate it.<br />
5 About the role of market structure in<br />
promoting technological advance.<br />
6 How technological advance enhances productive<br />
efficiency <strong>and</strong> allocative efficiency.<br />
Bonus Web Chapter<br />
11<br />
WEB<br />
www.mcconnell18e.com<br />
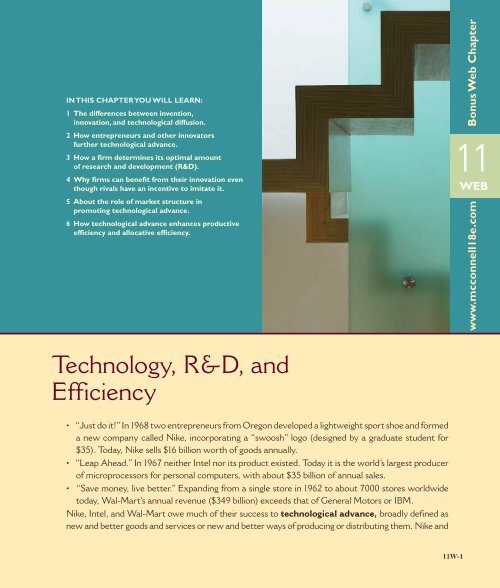
<strong>Technology</strong>, R&D, <strong>and</strong><br />
<strong>Efficiency</strong><br />
• “Just do it!” In 1968 two entrepreneurs from Oregon developed a lightweight sport shoe <strong>and</strong> formed<br />
a new company called Nike, incorporating a “swoosh” logo (designed by a graduate student for<br />
$35). Today, Nike sells $16 billion worth of goods annually.<br />
• “Leap Ahead.” In 1967 neither Intel nor its product existed. Today it is the world’s largest producer<br />
of microprocessors for personal computers, with about $35 billion of annual sales.<br />
• “Save money, live better.” Exp<strong>and</strong>ing from a single store in 1962 to about 7000 stores worldwide<br />
today, Wal-Mart’s annual revenue ($349 billion) exceeds that of General Motors or IBM.<br />
Nike, Intel, <strong>and</strong> Wal-Mart owe much of their success to technological advance, broadly defined as<br />
new <strong>and</strong> better goods <strong>and</strong> services or new <strong>and</strong> better ways of producing or distributing them. Nike <strong>and</strong><br />
11W-1
Intel pioneered innovative new products, <strong>and</strong> Wal-Mart developed creative ways to manage inventories<br />
<strong>and</strong> distribute goods.<br />
Multiply these examples—perhaps on a smaller scale—by thous<strong>and</strong>s in the economy! The pursuit<br />
of technological advance is a major competitive activity among firms. In this chapter, we examine some<br />
of the microeconomics of that activity.<br />
Invention, Innovation,<br />
<strong>and</strong> Diffusion<br />
For economists, technological advance occurs over a theoretical<br />
time period called the very long run, which can be as<br />
short as a few months or as long as many years. Recall that<br />
in our four market models (pure competition, monopolistic<br />
competition, oligopoly, <strong>and</strong> pure monopoly), the short<br />
run is a period in which technology <strong>and</strong> plant <strong>and</strong> equipment<br />
are fixed. In the long run, technology is constant but<br />
firms can change their plant sizes <strong>and</strong> are free to enter or<br />
exit industries. In contrast, the very long run is a period<br />
in which technology can change <strong>and</strong> in which firms can<br />
develop <strong>and</strong> offer entirely new products.<br />
In Chapter 1 we saw that technological advance shifts<br />
an economy’s production possibilities curve outward,<br />
enabling the economy to obtain more goods <strong>and</strong> services.<br />
Technological advance is a three-step process of invention,<br />
innovation, <strong>and</strong> diffusion.<br />
Invention<br />
The basis of technological advance is invention : the discovery<br />
of a product or process through the use of imagination,<br />
ingenious thinking, <strong>and</strong> experimentation <strong>and</strong> the first proof<br />
that it will work. Invention is a process, <strong>and</strong> the result of the<br />
process is also called an invention. The prototypes (basic<br />
working models) of the telephone, the automobile, <strong>and</strong> the<br />
microchip are inventions. Invention usually is based on scientific<br />
knowledge <strong>and</strong> is the product of individuals, working<br />
either on their own or as members of corporate R&D staffs.<br />
Later on you will see how governments encourage invention<br />
by providing the inventor with a patent , an exclusive<br />
right to sell any new <strong>and</strong> useful process, machine, or product<br />
for a set period of time. In 2006 the top 10 firms that<br />
secured the most U.S. patents were IBM (3621), Samsung<br />
(2451), Canon (2366), Matsushita (2229), Hewlet-Packard<br />
(2099), Intel (1959), Sony (1771), Hitachi (1732), Toshiba<br />
(1672), <strong>and</strong> Micron <strong>Technology</strong> (1610). Numbers like these,<br />
of course, do not reveal the quality of the patents received;<br />
some patents are much more significant than other patents.<br />
Patents have a worldwide duration of 20 years from the time<br />
of application for the patent.<br />
Innovation<br />
Innovation draws directly on invention. While invention is<br />
the “discovery <strong>and</strong> first proof of workability,” innovation<br />
is the first successful commercial introduction of a new product,<br />
the first use of a new method, or the creation of a new<br />
form of business enterprise. Innovation is of two types: product<br />
innovation , which refers to new <strong>and</strong> improved products<br />
or services; <strong>and</strong> process innovation , which refers to new<br />
<strong>and</strong> improved methods of production or distribution.<br />
Unlike inventions, innovations cannot be patented.<br />
Nevertheless, innovation is a major factor in competition,<br />
since it sometimes enables a firm to “leapfrog” competitors<br />
by rendering their products or processes obsolete.<br />
For example, personal computers coupled with software<br />
for word processing pushed some major typewriter manufacturers<br />
into obscurity. More recently, innovations in<br />
hardware retailing (large warehouse stores such as Home<br />
Depot) have threatened the existence of smaller, more<br />
traditional hardware stores.<br />
But innovation need not weaken or destroy existing<br />
firms. Aware that new products <strong>and</strong> processes may<br />
threaten their survival, existing firms have a powerful<br />
incentive to engage continuously in R&D of their own.<br />
Innovative products <strong>and</strong> processes often enable such firms<br />
to maintain or increase their profits. The introduction of<br />
disposable contact lenses by Johnson & Johnson, scientific<br />
calculators by Hewlett-Packard, <strong>and</strong> iPhones by Apple are<br />
good examples. Thus, innovation can either diminish or<br />
strengthen market power.<br />
Diffusion<br />
Diffusion is the spread of an innovation to other products or<br />
processes through imitation or copying. To take advantage<br />
of new profit opportunities or to slow the erosion of profit,<br />
both new <strong>and</strong> existing firms emulate the successful innovations<br />
of others. Alamo greatly increased its auto rentals by<br />
offering customers unlimited mileage, <strong>and</strong> Hertz, Avis, Budget,<br />
<strong>and</strong> others eventually followed. DaimlerChrysler profitably<br />
introduced a luxury version of its Jeep Gr<strong>and</strong> Cherokee;<br />
other manufacturers, including Acura, Mercedes, <strong>and</strong> Lexus,<br />
countered with luxury sport-utility vehicles of their own.<br />
11W-2
CHAPTER 11W<br />
<strong>Technology</strong>, R&D, <strong>and</strong> Effi ciency 11W-3<br />
In 1996 Palm introduced its Palm Pilot, a palm-size personal<br />
computer. Microsoft, H<strong>and</strong>spring, OmniSky, <strong>and</strong> other<br />
firms soon brought out similar products.<br />
Other recent examples: Early successful cholesterolreducing<br />
drugs (statins) such as Bristol-Myers Squibb’s<br />
Provochol were soon followed by chemically distinct but<br />
similar statins such as Merck’s Zocor <strong>and</strong> Pfizer’s Lipitor.<br />
Early video game consoles such as those by Atari eventually<br />
gave rise to more popular consoles by Nintendo (Wii), Sony<br />
(PlayStation), <strong>and</strong> Microsoft (Xbox). MySpace, Facebook,<br />
<strong>and</strong> LinkedIn mimicked the social networking innovation<br />
pioneered by Classmates.com.<br />
In each of these cases, other firms incorporated the<br />
new innovation into their own business <strong>and</strong> products<br />
through imitation, modification, <strong>and</strong> extension. The original<br />
innovation thus became commonplace <strong>and</strong> mainly of<br />
historical interest.<br />
Although not as dramatic as invention <strong>and</strong> innovation,<br />
diffusion is a critical element of technological change.<br />
R&D Expenditures<br />
As related to businesses , the term “research <strong>and</strong> development”<br />
is used loosely to include direct efforts toward invention,<br />
innovation, <strong>and</strong> diffusion. However, government also engages<br />
in R&D, particularly R&D having to do with national<br />
defense. In 2006 total U.S. R&D expenditures (business<br />
plus government) were $343 billion. Relative to GDP that<br />
amount was about 2.6 percent, which is a reasonable measure<br />
of the emphasis the U.S. economy puts on technological<br />
advance. As shown in Global Perspective 11W.1, this is a<br />
high percentage of GDP compared to several other nations.<br />
American businesses spent $242 billion on R&D in 2006.<br />
Figure 11W.1 shows how these R&D expenditures were<br />
allocated. Observe that U.S. firms collectively channeled<br />
74 percent of their R&D expenditures to “development”<br />
(innovation <strong>and</strong> imitation, the route to diffusion). They<br />
spent another 22 percent on applied research, or on pursuing<br />
invention. For reasons we will mention later, only 4 percent<br />
of business R&D expenditures went for basic research, the<br />
search for general scientific principles. Of course, industries,<br />
<strong>and</strong> firms within industries, vary greatly in the amount of<br />
emphasis they place on these three processes.<br />
Modern View of Technological<br />
Advance<br />
For decades most economists regarded technological advance<br />
as being external to the economy—a r<strong>and</strong>om outside<br />
force to which the economy adjusted. From time to time<br />
fortuitous advances in scientific <strong>and</strong> technological knowledge<br />
occurred, paving the way for major new products<br />
GLOBAL PERSPECTIVE 11W.1<br />
Total R&D Expenditures as a Percentage of GDP,<br />
Selected Nations<br />
Relative R&D spending varies among leading industrial nations.<br />
From a microeconomic perspective, R&D helps promote economic<br />
efficiency; from a macroeconomic perspective, R&D helps<br />
promote economic growth.<br />
FIGURE 11W.1 The composition of business<br />
R&D outlays in the United States, 2006. Firms<br />
channel the bulk of their R&D spending to innovation <strong>and</strong><br />
imitation, because both have direct commercial value; less<br />
to applied research, that is, invention; <strong>and</strong> a relatively small<br />
amount to basic scientific research.<br />
Basic<br />
research<br />
4%<br />
Sweden<br />
Japan<br />
United States<br />
Germany<br />
France<br />
Canada<br />
United Kingdom<br />
Italy<br />
Russia<br />
Total R&D Expenditures<br />
as Percentage of GDP, 2006<br />
0 1 2 3 4 5<br />
Source: National Science Foundation, www.nsf.gov, <strong>and</strong> Organization for Economic<br />
Cooperation <strong>and</strong> Development, www.oecd.org.<br />
(automobiles, airplanes) <strong>and</strong> new production processes<br />
(assembly lines). Firms <strong>and</strong> industries, each at its own pace,<br />
then incorporated the new technology into their products<br />
Applied<br />
research<br />
(invention)<br />
22%<br />
Development<br />
(innovation <strong>and</strong><br />
imitation)<br />
74%<br />
Source: National Science Foundation, www.nsf.gov.
11W-4<br />
PART TWO<br />
Microeconomics of Product Markets<br />
or processes to enhance or maintain their profit. After making<br />
the appropriate adjustments, they settled back into new<br />
long-run equilibrium positions. Although technological<br />
advance has been vitally important to the economy, economists<br />
believed it was rooted in the independent advance of<br />
science, which is largely external to the market system.<br />
Most contemporary economists have a different view.<br />
They see capitalism itself as the driving force of technological<br />
advance. Invention, innovation, <strong>and</strong> diffusion occur in<br />
response to incentives within the economy, meaning that<br />
technological advance is internal to capitalism. Specifically,<br />
technological advance arises from intense rivalry among<br />
individuals <strong>and</strong> firms that motivates them to seek <strong>and</strong> exploit<br />
new profit opportunities or to exp<strong>and</strong> existing opportunities.<br />
That rivalry occurs both among existing firms <strong>and</strong><br />
between existing firms <strong>and</strong> new firms. Moreover, many<br />
advances in “pure” scientific knowledge are motivated, at<br />
least in part, by the prospect of commercial applicability<br />
<strong>and</strong> eventual profit. In the modern view, entrepreneurs <strong>and</strong><br />
other innovators are at the heart of technological advance.<br />
Role of Entrepreneurs <strong>and</strong><br />
Other Innovators<br />
It will be helpful to distinguish between “entrepreneurs”<br />
<strong>and</strong> “other innovators”:<br />
• Entrepreneurs Recall that the entrepreneur is an<br />
initiator, innovator, <strong>and</strong> risk bearer—the resource<br />
that combines l<strong>and</strong>, labor, <strong>and</strong> capital resources in<br />
new <strong>and</strong> unique ways to produce new goods <strong>and</strong> services.<br />
In the past a single individual, for example,<br />
Andrew Carnegie in steel, Henry Ford in automobiles,<br />
or Levi Strauss in blue jeans, carried out the entrepreneurial<br />
role. Such advances as air conditioning,<br />
the ballpoint pen, cellophane, the jet engine, insulin,<br />
xerography, <strong>and</strong> the helicopter all have an individualistic<br />
heritage. But in today’s more technologically<br />
complex economy, entrepreneurship is just as likely<br />
to be carried out by entrepreneurial teams. Such<br />
teams may include only two or three people working<br />
“as their own bosses” on some new product idea or it<br />
may consist of larger groups of entrepreneurs who<br />
have pooled their financial resources.<br />
• Other innovators This designation includes other<br />
key people involved in the pursuit of innovation who<br />
do not bear personal financial risk. Among them are<br />
key executives, scientists, <strong>and</strong> other salaried<br />
employees engaged in commercial R&D activities.<br />
(They are sometimes referred to as intrapreneurs<br />
since they provide the spirit of entrepreneurship<br />
within existing firms.)<br />
Forming Start-Ups<br />
Entrepreneurs often form small new companies called startups<br />
that focus on creating <strong>and</strong> introducing a new product or<br />
employing a new production or distribution technique. Two<br />
people, working out of their garages, formed such a start-up<br />
in the mid-1970s. Since neither of their employers—Hewlett-<br />
Packard <strong>and</strong> Atari, the developer of Pong (the first video<br />
game)—was interested in their prototype personal computer,<br />
they founded their own computer company: Apple.<br />
Other examples of successful start-ups are Amgen, a biotechnology<br />
firm specializing in new medical treatments;<br />
Starbucks, a seller of gourmet coffee; Amazon, an Internet<br />
retailer; <strong>and</strong> Google, an Internet search provider.<br />
Innovating within Existing Firms<br />
Innovators are also at work within existing corporations, large<br />
<strong>and</strong> small. Such innovators are salaried workers, although<br />
many firms have pay systems that provide them with substantial<br />
bonuses or profit shares. Examples of firms known<br />
for their skillful internal innovators are 3M Corporation,<br />
the U.S. developer of Scotch tape, Post-it Note Pads, <strong>and</strong><br />
Thinsulate insulation; <strong>and</strong> General Electric, the developer<br />
of innovative major kitchen appliances, medical imaging machines,<br />
<strong>and</strong> jet aircraft engines. R&D work in major corporations<br />
has produced significant technological improvements in<br />
such products as television sets, telephones, home appliances,<br />
automobiles, automobile tires, <strong>and</strong> sporting equipment.<br />
Some large firms, aware that excessive bureaucracy can<br />
stifle creative thinking <strong>and</strong> technological advance, have separated<br />
part of their R&D <strong>and</strong> manufacturing divisions to<br />
form new, more flexible, innovative firms. Three significant<br />
examples of such “spin-off firms” are Lucent Technologies,<br />
a telephone equipment <strong>and</strong> R&D firm created by AT&T;<br />
Imation, a high-technology firm spun off by the 3M<br />
Corporation; <strong>and</strong> Yum Br<strong>and</strong>s, which operates restaurant<br />
chains Taco Bell, KFC, <strong>and</strong> Pizza Hut, spun off from Pepsi.<br />
Anticipating the Future<br />
About a half-century ago a writer for Popular Mechanics<br />
magazine boldly predicted, “Computers in the future may<br />
weigh no more than 1.5 tons.” Today’s notebook computers<br />
weigh less than 3 pounds.<br />
Anticipating the future is difficult, but that is what<br />
innovators try to do. Those with strong anticipatory ability<br />
<strong>and</strong> determination have a knack for introducing new <strong>and</strong><br />
improved products or services at just the right time.<br />
The rewards for success are both monetary <strong>and</strong> nonmonetary.<br />
Product innovation <strong>and</strong> development are creative<br />
endeavors, with such intangible rewards as personal<br />
satisfaction. Also, many people simply enjoy participating<br />
in the competitive “contest.” Of course, the “winners” can
CHAPTER 11W<br />
<strong>Technology</strong>, R&D, <strong>and</strong> Effi ciency 11W-5<br />
reap huge monetary rewards in the form of economic profits,<br />
stock appreciation, or large bonuses. Extreme examples<br />
are Bill Gates <strong>and</strong> Paul Allen, who founded Microsoft in<br />
1975, <strong>and</strong> had a net worth in 2007 of $56 billion <strong>and</strong> $18<br />
billion, respectively, mainly in the form of Microsoft stock.<br />
Past successes often give entrepreneurs <strong>and</strong> innovative<br />
firms access to resources for further innovations that anticipate<br />
consumer wants. Although they may not succeed a<br />
second time, the market tends to entrust the production of<br />
goods <strong>and</strong> services to businesses that have consistently succeeded<br />
in filling consumer wants. And the market does not<br />
care whether these “winning” entrepreneurs <strong>and</strong> innovative<br />
firms are American, Brazilian, Japanese, German, or Swiss.<br />
Entrepreneurship <strong>and</strong> innovation are global in scope.<br />
QUICK REVIEW 11W.1<br />
• Broadly defined, technological advance means new or<br />
improved products <strong>and</strong> services <strong>and</strong> new or improved<br />
production <strong>and</strong> distribution processes.<br />
• Invention is the discovery of a new product or method;<br />
innovation is the successful commercial application of some<br />
invention; <strong>and</strong> diffusion is the widespread adoption of the<br />
innovation.<br />
• Many economists view technological advance as mainly a<br />
response to profit opportunities arising within a capitalist<br />
economy.<br />
• Technological advance is fostered by entrepreneurs <strong>and</strong><br />
other innovators <strong>and</strong> is supported by the scientific research<br />
of universities <strong>and</strong> government-sponsored laboratories.<br />
Exploiting University <strong>and</strong><br />
Government Scientific Research<br />
In Figure 11W.1 we saw that only 4 percent of business<br />
R&D spending in the United States goes to basic scientific<br />
research. The reason the percentage is so small is that<br />
scientific principles, as such, cannot be patented, nor do<br />
they usually have immediate commercial uses. Yet new<br />
scientific knowledge is highly important to technological<br />
advance. For that reason, entrepreneurs study the scientific<br />
output of university <strong>and</strong> government laboratories to<br />
identify discoveries with commercial applicability.<br />
Government <strong>and</strong> university labs have been the scene<br />
of many technological breakthroughs, including hybrid<br />
seed corn, nuclear energy, satellite communications, the<br />
computer “mouse,” genetic engineering, <strong>and</strong> the Internet.<br />
Entire high-tech industries such as computers <strong>and</strong> biotechnology<br />
have their roots in major research universities <strong>and</strong><br />
government laboratories. And nations with strong scientific<br />
communities tend to have the most technologically<br />
progressive firms <strong>and</strong> industries.<br />
Also, firms increasingly help fund university research<br />
that relates to their products. Business funding of R&D<br />
at universities has grown rapidly, rising to more than<br />
$2.4 billion in 2006. Today, the separation between university<br />
scientists <strong>and</strong> innovators is narrowing; scientists <strong>and</strong><br />
universities increasingly realize that their work may have<br />
commercial value <strong>and</strong> are teaming up with innovators to<br />
share in the potential profit.<br />
A few firms, of course, find it profitable to conduct<br />
basic scientific research on their own. New scientific<br />
knowledge can give them a head start in creating an invention<br />
or a new product. This is particularly true in the pharmaceutical<br />
industry, where it is not uncommon for firms<br />
to parlay new scientific knowledge generated in their corporate<br />
labs into new, patentable drugs.<br />
A Firm’s Optimal Amount<br />
of R&D<br />
How does a firm decide on its optimal amount of research<br />
<strong>and</strong> development That amount depends on the firm’s perception<br />
of the marginal benefit <strong>and</strong> marginal cost of R&D<br />
activity. The decision rule here flows from basic economics:<br />
To earn the greatest profit, exp<strong>and</strong> a particular activity<br />
until its marginal benefit (MB) equals its marginal cost<br />
(MC). A firm that sees the marginal benefit of a particular<br />
R&D activity, say, innovation, as exceeding the marginal<br />
cost should exp<strong>and</strong> that activity. In contrast, an activity<br />
whose marginal benefit promises to be less than its marginal<br />
cost should be cut back. But the R&D spending decision<br />
is complex since it involves a present sacrifice for a<br />
future expected gain. While the cost of R&D is immediate,<br />
the expected benefits occur at some future time <strong>and</strong><br />
are highly uncertain. So estimating those benefits is often<br />
more art than science. Nevertheless, the MB MC way of<br />
thinking remains relevant for analyzing R&D decisions.<br />
Interest-Rate Cost of Funds<br />
Firms have several ways of obtaining the funds they need<br />
to finance R&D activities:<br />
• Bank loans Some firms are able to obtain a loan<br />
from a bank or other financial institution. Then the<br />
cost of using the funds is the interest paid to the<br />
lender. The marginal cost is the cost per extra dollar<br />
borrowed, which is simply the market interest rate<br />
for borrowed funds.<br />
• Bonds Established, profitable firms may be able to<br />
borrow funds for R&D by issuing bonds <strong>and</strong> selling<br />
them in the bond market. In this case, the cost is the
11W-6<br />
PART TWO<br />
Microeconomics of Product Markets<br />
interest paid to the lenders—the bondholders.<br />
Again the marginal cost of using the funds is the<br />
interest rate. (We discussed corporate bonds in<br />
Chapter 4.)<br />
• Retained earnings A large, well-established firm<br />
may be able to draw on its own corporate savings to<br />
finance R&D. Typically, such a firm retains part of its<br />
profit rather than paying it all out as dividends to<br />
corporate owners. Some of the undistributed corporate<br />
profit, called retained earnings, can be used to<br />
finance R&D activity. The marginal cost of using retained<br />
earnings for R&D is an opportunity cost—the<br />
rate of interest that those funds could have earned as<br />
deposits in a financial institution.<br />
• Venture capital A smaller start-up firm might be able<br />
to attract venture capital to finance its R&D projects.<br />
Venture capital is financial capital, or simply money,<br />
not real capital. Venture capital consists of that part<br />
of household saving used to finance high-risk business<br />
ventures in exchange for shares of the profit if<br />
the ventures succeed. The marginal cost of venture<br />
capital is the share of expected profit that the firm<br />
will have to pay to those who provided the money.<br />
This can be stated as a percentage of the venture<br />
capital, so it is essentially an interest rate.<br />
• Personal savings Finally, individual entrepreneurs<br />
might draw on their own savings to finance the R&D<br />
for a new venture. The marginal cost of the financing<br />
is again the forgone interest rate.<br />
Thus, whatever the source of the R&D funds, we can state<br />
the marginal cost of these funds as an interest rate i . For<br />
simplicity, let’s assume that this interest rate is the same no<br />
matter how much financing is required. Further, we assume<br />
that a certain firm called MedTech must pay an interest rate<br />
of 8 percent for the least expensive funding available to it.<br />
Then a graph of the marginal cost of each funding amount<br />
for this firm is a horizontal line at the 8 percent interest<br />
rate, as shown in Figure 11W.2 . Such a graph is called an<br />
interest-rate cost-of-funds curve . This one tells us that<br />
MedTech can borrow $10, $10,000, $10,000,000, or more<br />
at the 8 percent interest rate. The table accompanying the<br />
graph contains the data used to construct the graph <strong>and</strong><br />
tells us much the same thing.<br />
With these data in h<strong>and</strong>, MedTech wants to determine<br />
how much R&D to finance in the coming year.<br />
Expected Rate of Return<br />
A firm’s marginal benefit from R&D is its expected profit<br />
(or return) from the last (marginal) dollar spent on R&D.<br />
That is, the R&D is expected to result in a new product or<br />
FIGURE 11W.2 The interest-rate cost-of-funds<br />
schedule <strong>and</strong> curve. As it relates to R&D, a firm’s interest-rate<br />
cost-of-funds schedule (the table) <strong>and</strong> curve (the graph) show the interest<br />
rate the firm must pay to obtain any particular amount of funds to finance<br />
R&D. Curve i indicates the firm can finance as little or as much R&D as it<br />
wants at a constant 8 percent rate of interest.<br />
Interest rate, i (percent)<br />
20<br />
16<br />
12<br />
8<br />
4<br />
Interest-rate cost-of-funds<br />
curve<br />
0 20 40 60 80 100<br />
Research <strong>and</strong> development expenditures<br />
(millions of dollars)<br />
R&D,<br />
Millions Interest-Rate Cost of Funds, %<br />
$10 8<br />
20 8<br />
30 8<br />
40 8<br />
50 8<br />
60 8<br />
70 8<br />
80 8<br />
production method that will increase revenue, reduce<br />
production costs, or both (in ways we will soon explain).<br />
This return is expected, not certain—there is risk in<br />
R&D decisions. Let’s suppose that after considering<br />
such risks, MedTech anticipates that an R&D expenditure<br />
of $1 million will result in a new product that will<br />
yield a one-time added profit of $1.2 million a year later.<br />
The expected rate of return r on the $1 million R&D<br />
expenditure (after the $1 million has been repaid) is 20 percent<br />
( $200,000$1,000,000). This is the marginal benefit<br />
of the first $1 million of R&D. (Stretching the return over<br />
several years complicates the computation of r, but it does<br />
not alter the basic analysis. We discuss this “present-value<br />
complication” in Chapter 15.)<br />
i
CHAPTER 11W<br />
<strong>Technology</strong>, R&D, <strong>and</strong> Effi ciency 11W-7<br />
FIGURE 11W.3 The expected-rate-of-return schedule<br />
<strong>and</strong> curve. As they relate to R&D, a firm’s expected-rate-of-return<br />
schedule (the table) <strong>and</strong> curve (the graph) show the firm’s expected<br />
gain in profit, as a percentage of R&D spending, for each level of R&D<br />
spending. Curve r slopes downward because the firm assesses its<br />
potential R&D projects in descending order of expected rates of return.<br />
20<br />
FIGURE 11W.4 A firm’s optimal level of R&D<br />
expenditures. The firm’s optimal level of R&D expenditures ($60 million)<br />
occurs where its expected rate of return equals the interest-rate cost of funds,<br />
as shown in both the table <strong>and</strong> the graph. At $60 million of R&D spending,<br />
the firm has taken advantage of all R&D opportunities for which the expected<br />
rate of return, r, exceeds or equals the 8 percent interest cost of borrowing, i.<br />
20<br />
Expected rate of return, r (percent)<br />
16<br />
12<br />
8<br />
4<br />
Expected-rate-ofreturn<br />
curve<br />
r<br />
Expected rate of return, r, <strong>and</strong><br />
interest rate, i (percent)<br />
16<br />
12<br />
8<br />
4<br />
r = i<br />
r<br />
i<br />
0 20 40 60 80 100<br />
Research <strong>and</strong> development expenditures<br />
(millions of dollars)<br />
0 20 40 60 80 100<br />
Research <strong>and</strong> development expenditures<br />
(millions of dollars)<br />
R&D,<br />
Millions Expected Rate of Return, %<br />
$10 18<br />
20 16<br />
30 14<br />
40 12<br />
50 10<br />
60 8<br />
70 6<br />
80 4<br />
Expected R&D, Interest-Rate Cost<br />
Rate of Return, % Millions of Funds, %<br />
18 $10 8<br />
16 20 8<br />
14 30 8<br />
12 40 8<br />
10 50 8<br />
8 60 8<br />
6 70 8<br />
4 80 8<br />
MedTech can use this same method to estimate the<br />
expected rates of return for R&D expenditures of $2<br />
million, $3 million, $4 million, <strong>and</strong> so on. Suppose those<br />
marginal rates of return are the ones indicated in the table in<br />
Figure 11W.3 , where they are also graphed as the expectedrate-of-return<br />
curve . This curve shows the expected rate<br />
of return, which is the marginal benefit of each dollar of<br />
expenditure on R&D. The curve slopes downward because<br />
of diminishing returns to R&D expenditures. A firm will<br />
direct its initial R&D expenditures to the highest expectedrate-of-return<br />
activities <strong>and</strong> then use additional funding for<br />
activities with successively lower expected rates of return.<br />
That is, the firm will experience lower <strong>and</strong> lower expected<br />
rates of return as it exp<strong>and</strong>s its R&D spending.<br />
Optimal R&D Expenditures<br />
Figure 11W.4 combines the interest-rate cost-of-funds<br />
curve ( Figure 11W.2 ) <strong>and</strong> the expected-rate-of-return curve<br />
( Figure 11W.3 ). The curves intersect at MedTech’s optimal<br />
amount of R&D, which is $60 million. This amount can<br />
also be determined from the table as the amount of funding<br />
for which the expected rate of return <strong>and</strong> the interest cost of<br />
borrowing are equal (here, 8 percent).<br />
Both the curve <strong>and</strong> the table in Figure 11W.4 tell us<br />
that at $60 million of R&D expenditures, the marginal benefit<br />
<strong>and</strong> marginal cost of the last dollar spent on R&D are<br />
equal. MedTech should undertake all R&D expenditures up<br />
to $60 million since those outlays yield a higher marginal<br />
benefit or expected rate of return, r , than the 8 percent
11W-8<br />
PART TWO<br />
Microeconomics of Product Markets<br />
WORKED PROBLEMS<br />
marginal cost or interestrate<br />
cost of borrowing, i .<br />
W 11W.1<br />
But it should not undertake<br />
R&D expendi-<br />
Optimal R&D expenditures<br />
tures beyond $60 million;<br />
for these outlays, r (marginal benefit) is less than i (marginal<br />
cost). Only at $60 million do we have r i , telling<br />
us that MedTech will spend $60 million on R&D.<br />
Our analysis reinforces three important points:<br />
• Optimal versus affordable R&D From earlier<br />
discussions we know there can be too much, as well<br />
as too little, of a “good thing.” So it is with R&D<br />
<strong>and</strong> technological advance. Figure 11W.4 shows that<br />
R&D expenditures make sense to a firm only as long<br />
as the expected return from the outlay equals or<br />
exceeds the cost of obtaining the funds needed to<br />
finance it. Many R&D expenditures may be affordable<br />
but not worthwhile because their marginal<br />
benefit is likely to be less than their marginal cost.<br />
• Expected, not guaranteed, returns The outcomes<br />
from R&D are expected, not guaranteed. With 20-20<br />
hindsight, a firm can always look back <strong>and</strong> decide<br />
whether a particular expenditure for R&D was<br />
worthwhile. But that assessment is irrelevant to<br />
the original decision. At the time of the decision, the<br />
expenditure was thought to be worthwhile on the<br />
basis of existing information <strong>and</strong> expectations. Some<br />
R&D decisions may be more like an informed gamble<br />
than the typical business decision. Invention <strong>and</strong><br />
innovation, in particular, carry with them a great deal<br />
of risk. For every successful outcome, there are<br />
scores of costly disappointments.<br />
• Adjustments Firms adjust their R&D expenditures<br />
when expected rates of return on various projects<br />
change (when curves such as r in Figure 11W.4 shift).<br />
The U.S. war on terrorism, for example, increased the<br />
expected rate of return on R&D for improved security<br />
devices used at airports, train stations, harbors, <strong>and</strong><br />
other public places. It also increased the expected<br />
return on new methods of detecting <strong>and</strong> responding to<br />
potential bioterrorism. The revised realities prompted<br />
many firms to increase their R&D expenditures for<br />
these purposes. (Key Questions 4 <strong>and</strong> 5)<br />
Increased Profit via Innovation<br />
In discussing how a firm determines its optimal amount<br />
of R&D spending, we sidestepped the question of<br />
how technological change can increase a firm’s profit.<br />
Although the answer may seem obvious—by increasing<br />
revenue or reducing production costs—insights can<br />
be gained by exploring these two potential outcomes in<br />
some detail.<br />
Increased Revenue via<br />
Product Innovation<br />
Firms here <strong>and</strong> abroad have profitably introduced hundreds<br />
of new products in the past two or three decades. Examples<br />
include roller blades, microwave popcorn, cordless drills,<br />
digital cameras, camcorders, <strong>and</strong> high- definition TVs.<br />
Other new products are snowboards, cellular phones, MP3<br />
players, <strong>and</strong> automobile air bags. All these items reflect<br />
technological advance in the form of product innovation.<br />
How do such new products gain consumer acceptance<br />
As you know from Chapter 7, to maximize their satisfaction,<br />
consumers purchase products that have the highest<br />
marginal utility per dollar. They determine which products<br />
to buy in view of their limited money incomes by comparing<br />
the ratios of MU/price for the various goods. They first<br />
select the unit of the good with the highest MU/price ratio,<br />
then the one with the next highest, <strong>and</strong> so on, until their<br />
incomes are used up.<br />
The first five columns of Table 11W.1 repeat some of<br />
the information in Table 7.1. Before the introduction of new<br />
product C, the consumer maximized the total utility she<br />
could get from $10 of income by buying 2 units of A at $1 per<br />
unit <strong>and</strong> 4 units of B at $2 per unit. The total $10 budget was<br />
thus expended, with $2 spent on A <strong>and</strong> $8 on B. As shown in<br />
columns 2b <strong>and</strong> 3b, the marginal utility per dollar spent on<br />
the last unit of each product was 8 ( 8$1 16$2). The<br />
total utility, derived from columns 2a <strong>and</strong> 3a, was 96 utils<br />
( 10 8 from the first 2 units of A plus 24 20 18 16<br />
from the first 4 units of B). (If you are uncertain about this<br />
outcome, please review the discussion of Table 7.1.)<br />
Now suppose an innovative firm offers new product C<br />
(columns 4a <strong>and</strong> 4b in Table 11W.1 ), priced at $4 per unit.<br />
Note that the first unit of C has a higher marginal utility<br />
per dollar (13) than any unit of A <strong>and</strong> B <strong>and</strong> that the second<br />
unit of C <strong>and</strong> the first unit of B have equal MU/price ratios<br />
of 12. To maximize satisfaction, the consumer now buys<br />
2 units of C at $4 per unit, 1 unit of B at $2 per unit, <strong>and</strong><br />
zero units of A. Our consumer has spent the entire $10 of<br />
income ($8 on C <strong>and</strong> $2 on B), <strong>and</strong> the MU/price ratios of<br />
the last units of B <strong>and</strong> C are equal at 12. But as determined<br />
via columns 3a <strong>and</strong> 4a, the consumer’s total utility is now 124<br />
utils ( 24 from the first unit of B plus 52 48 from the first<br />
2 units of C).<br />
Total utility has increased by 28 utils ( 124 utils 96<br />
utils), <strong>and</strong> that is why product C was purchased. Consumers<br />
will buy a new product only if it increases the total utility<br />
they obtain from their limited incomes.
CHAPTER 11W<br />
<strong>Technology</strong>, R&D, <strong>and</strong> Effi ciency 11W-9<br />
TABLE 11W.1 Utility Maximization with the Introduction of a New Product (Income $10)*<br />
(2) (3) (4)<br />
Product A: Price $1 Product B: Price $2 New Product C: Price $4<br />
(b) (b) (b)<br />
(1) (a) Marginal Utility (a) Marginal Utility (a) Marginal Utility<br />
Unit of Marginal per Dollar Marginal per Dollar Marginal per Dollar<br />
Product Utility, Utils (MU/Price) Utility, Utils (MU/Price) Utility, Utils (MU/Price)<br />
First 10 10 24 12 52 13<br />
Second 8 8 20 10 48 12<br />
Third 7 7 18 9 44 11<br />
Fourth 6 6 16 8 36 9<br />
Fifth 5 5 12 6 32 8<br />
*It is assumed in this table that the amount of marginal utility received from additional units of each of the three products is independent of the quantity purchased of the other<br />
products. For example, the marginal-utility schedule for product C is independent of the amount of A <strong>and</strong> B purchased by the consumer.<br />
From the innovating firm’s perspective, these “dollar<br />
votes” represent new product dem<strong>and</strong> that yields increased<br />
revenue. When per-unit revenue exceeds per-unit cost, the<br />
product innovation creates per-unit profit. Total profit rises<br />
by the per-unit profit multiplied by the number of units<br />
sold. As a percentage of the original R&D expenditure, the<br />
rise in total profit is the return on that R&D expenditure.<br />
It was the basis for the expected-rate-of-return curve r in<br />
Figure 11W.4 .<br />
Other related points:<br />
• Importance of price Consumer acceptance of a new<br />
product depends on both its marginal utility <strong>and</strong> its<br />
price. (Confirm that the consumer represented in<br />
Table 11W.1 would buy zero units of new product C<br />
if its price were $8 rather than $4.) To be successful,<br />
a new product must not only deliver utility to<br />
consumers but do so at an acceptable price.<br />
• Unsuccessful new products For every successful new<br />
product, hundreds do not succeed; the expected return<br />
that motivates product innovation is not always realized.<br />
Examples of colossal product flops are Ford’s Edsel<br />
automobile, quadraphonic stereo, New Coke by Coca-<br />
Cola, Kodak disc cameras, <strong>and</strong> XFL football. Less dramatic<br />
failures include the hundreds of “dot-com” firms<br />
that have gone out of business in the last decade. In<br />
each case, millions of dollars of R&D <strong>and</strong> promotion<br />
expense ultimately resulted in loss, not profit.<br />
• Product improvements Most product innovation<br />
consists of incremental improvements to existing<br />
products rather than radical inventions. Examples:<br />
more fuel-efficient automobile engines, new varieties<br />
of pizza, lighter-weight shafts for golf clubs, more<br />
flavorful bubble-gum, “rock shocks” for mountain<br />
bikes, <strong>and</strong> clothing made of wrinkle-free fabrics.<br />
(Key Question 6)<br />
Reduced Cost via Process Innovation<br />
The introduction of better methods of producing<br />
products—process innovation—is also a path toward<br />
enhanced profit <strong>and</strong> a positive return on R&D expenditures.<br />
Suppose a firm introduces a new <strong>and</strong> better production<br />
process, say, assembling its product by teams rather than<br />
by a st<strong>and</strong>ard assembly line. Alternatively, suppose this firm<br />
replaces old equipment with more productive equipment<br />
embodying technological advance. In either case, the innovation<br />
yields an upward shift in the firm’s total-product<br />
curve from TP 1 to TP 2 in Figure 11W.5 a. Now more<br />
units of output can be produced at each level of resource<br />
usage. Note from the figure, for example, that this firm can<br />
now produce 2500 units of output, rather than 2000 units,<br />
when using 1000 units of labor. So its average product has<br />
increased from 2 ( 2000 units of output1000 units of<br />
labor) to 2.5 ( 2500 units of output1000 units of labor).<br />
The result is a downward shift in the firm’s averagetotal-cost<br />
curve, from ATC 1 to ATC 2 in Figure 11W.5b.<br />
To underst<strong>and</strong> why, let’s assume this firm pays $1000<br />
for the use of its capital <strong>and</strong> $9 for each unit of labor.<br />
Since it uses 1000 units of labor, its labor cost is $9000<br />
( $9 1000); its capital cost is $1000; <strong>and</strong> thus its total<br />
cost is $10,000. When its output increases from 2000 to<br />
2500 units as a result of the process innovation, its total<br />
cost remains $10,000. So its average total cost declines<br />
from $5 ( $10,0002000) to $4 ( $10,0002500).<br />
Alternatively, the firm could produce the original 2000<br />
units of output with fewer units of labor at an even lower<br />
average total cost.<br />
This reduction in average total cost enhances the<br />
firm’s profit. As a percentage of the R&D expenditure<br />
that fostered it, this extra profit is the expected return r ,<br />
the basis for the rate-of-return curve in Figure 11W.3.<br />
In this case, the expected rate of return arose from the
11W-10<br />
PART TWO<br />
Microeconomics of Product Markets<br />
FIGURE 11W.5 Process innovation, total product, <strong>and</strong> average total cost. (a) Process innovation shifts a firm’s totalproduct<br />
curve upward from TP 1 to TP 2 , meaning that with a given amount of capital the firm can produce more output at each level of labor<br />
input. As shown, with 1000 units of labor it can produce 2500 rather than 2000 units of output. (b) The upward shift in the total-product curve<br />
results in a downward shift in the firm’s average-total-cost curve, from ATC 1 to ATC 2 . This means the firm can produce any particular unit of<br />
output at a lower average total cost than it could previously. For example, the original 2000 units can be produced at less than $4 per unit, versus<br />
$5 per unit originally. Or 2500 units can now be produced at $4 per unit.<br />
Total product<br />
2500<br />
2000<br />
TP 2<br />
TP 1<br />
Average total cost<br />
$5<br />
4<br />
ATC 1<br />
ATC 2<br />
0<br />
1000<br />
Units of labor<br />
(a)<br />
Upward shift of the total-product curve<br />
0<br />
2000 2500<br />
Units of output<br />
(b)<br />
Downward shift of the<br />
average-total-cost curve<br />
WORKED PROBLEMS<br />
prospect of lower production<br />
costs through<br />
W 11W.2<br />
process innovation.<br />
Process innovation<br />
Example: Computerbased<br />
inventory control<br />
systems, such as those pioneered by Wal-Mart, enabled innovators<br />
to reduce the number of people keeping track of<br />
inventories <strong>and</strong> placing reorders of sold goods. They also<br />
enabled firms to keep goods arriving “just in time,” reducing<br />
the cost of storing inventories. The consequence Significant<br />
increases in sales per worker, declines in average<br />
total cost, <strong>and</strong> increased profit. (Key Question 8)<br />
Imitation <strong>and</strong> R&D Incentives<br />
Our analysis of product <strong>and</strong> process innovation explains<br />
how technological advance enhances a firm’s profit.<br />
But it also hints at a potential imitation problem : A<br />
firm’s rivals may be able to imitate its new product or<br />
process, greatly reducing the originator’s profit from<br />
its R&D effort. As just one example, in the 1980s U.S.<br />
auto firms took apart Japanese Honda Accords, piece by<br />
piece, to discover the secrets of their high quality. This<br />
reverse engineering—which ironically was perfected<br />
earlier by the Japanese—helped the U.S. firms incorporate<br />
innovative features into their own cars. This type<br />
of imitation is perfectly legitimate <strong>and</strong> fully anticipated;<br />
it is often the main path to widespread diffusion of an<br />
innovation.<br />
In fact, a dominant firm that is making large profits from<br />
its existing products may let smaller firms in the industry<br />
incur the high costs of product innovation while it closely<br />
monitors their successes <strong>and</strong> failures. The dominant firm<br />
then moves quickly to imitate any successful new product;<br />
its goal is to become the second firm to embrace the innovation.<br />
In using this so-called fast-second strategy , the dominant<br />
firm counts on its own product-improvement abilities,<br />
marketing prowess, or economies of scale to prevail.<br />
Examples abound: Royal Crown introduced the first<br />
diet cola, but Diet Coke <strong>and</strong> Diet Pepsi dominate diet-cola<br />
sales today. Meister-Brau introduced the first low-calorie<br />
beer, but Miller popularized the product with its Miller<br />
Lite. Gillette moved quickly with its own stainless-steel<br />
razor blade only after a smaller firm, Wilkinson, introduced<br />
this product innovation. Creative <strong>Technology</strong> (the<br />
maker of Sound Blaster audio cards for personal computers)<br />
introduced the first miniature MP3 player, but Apple<br />
popularized the product with its iPod.<br />
Benefits of Being First<br />
Imitation <strong>and</strong> the fast-second strategy raise an important<br />
question: What incentive is there for any firm to bear the<br />
expenses <strong>and</strong> risks of innovation if competitors can imitate its<br />
new or improved product Why not let others bear the costs<br />
<strong>and</strong> risks of product development <strong>and</strong> then just imitate the<br />
successful innovations Although we have seen that this may<br />
be a plausible strategy in some situations, there are several<br />
protections for, <strong>and</strong> potential advantages to, taking the lead.
CHAPTER 11W<br />
<strong>Technology</strong>, R&D, <strong>and</strong> Effi ciency 11W-11<br />
Patents Some technological breakthroughs, specifically<br />
inventions, can be patented. Once patented, they cannot<br />
be legally imitated for two decades from time of patent application.<br />
The purpose of patents is, in fact, to reduce imitation<br />
<strong>and</strong> its negative effect on the incentive for engaging<br />
in R&D. Example: Polaroid’s patent of its instant camera<br />
enabled it to earn high economic profits for many years.<br />
When Kodak “cloned” the camera, Polaroid won a patentinfringement<br />
lawsuit against its rival. Kodak not only had<br />
to stop producing its version of the camera but had to buy<br />
back the Kodak instant cameras it had sold <strong>and</strong> pay millions<br />
of dollars in damages to Polaroid.<br />
There are hundreds of other examples of long-run profits<br />
based on U.S. patents; they involve products from prescription<br />
drugs to pop-top cans to weed trimmers. As shown<br />
in Global Perspective 11W.2, foreign citizens <strong>and</strong> firms hold<br />
U.S. patents along with American citizens <strong>and</strong> firms.<br />
Copyrights <strong>and</strong> Trademarks Copyrights protect<br />
publishers of books, computer software, movies, videos,<br />
<strong>and</strong> musical compositions from having their works<br />
copied. Trademarks give the original innovators of products<br />
the exclusive right to use a particular product name<br />
(“M&Ms,” “Barbie Doll,” “Wheaties”). By reducing the<br />
problem of direct copying, these legal protections increase<br />
the incentive for product innovation. They have been<br />
GLOBAL PERSPECTIVE 11W.2<br />
Distribution of U.S. Patents, by Foreign Nation<br />
Foreign citizens, corporations, <strong>and</strong> governments hold 41<br />
percent of U.S. patents. The top 10 foreign countries in terms<br />
of U.S. patent holdings since 1963 are listed below, with the<br />
number of U.S. patents (through 2006) in parentheses.<br />
Top 10 Foreign Countries<br />
Japan (658,827)<br />
Germany (295,110)<br />
U. K. (123,371)<br />
France (110,839)<br />
Canada (77,594)<br />
Taiwan (58,162)<br />
Switzerl<strong>and</strong> (52,201)<br />
South Korea (44,125)<br />
Italy (43,668)<br />
Sweden (38,456)<br />
Source: U.S. Patent <strong>and</strong> Trademark Offi ce, www.uspto.gov.<br />
strengthened worldwide through recent international<br />
trade agreements.<br />
Br<strong>and</strong>-Name Recognition Along with trademark<br />
protection, br<strong>and</strong>-name recognition may give the original<br />
innovator a major marketing advantage for years or even<br />
decades. Consumers often identify a new product with the<br />
firm that first introduced <strong>and</strong> popularized it in the mass<br />
market. Examples: Levi’s blue jeans, Kleenex soft tissues,<br />
Johnson <strong>and</strong> Johnson’s B<strong>and</strong>-Aids, Sony’s Walkman, <strong>and</strong><br />
Kellogg’s Corn Flakes.<br />
Trade Secrets <strong>and</strong> Learning by Doing Some<br />
innovations involve trade secrets, without which competitors<br />
cannot imitate the product or process. Example: Coca-Cola<br />
has successfully kept its formula for Coke a secret from<br />
potential rivals. Many other firms have perfected special<br />
production techniques known only to them. In a related<br />
advantage, a firm’s head start with a new product often allows<br />
it to achieve substantial cost reductions through learning by<br />
doing. The innovator’s lower cost may enable it to continue<br />
to profit even after imitators have entered the market.<br />
Time Lags Time lags between innovation <strong>and</strong> diffusion<br />
often enable innovating firms to realize a substantial<br />
economic profit. It takes time for an imitator to<br />
gain knowledge of the properties of a new innovation. And<br />
once it has that knowledge, the imitator must design a substitute<br />
product, gear up a factory for its production, <strong>and</strong><br />
conduct a marketing campaign. Various entry barriers, such<br />
as large financial requirements, economies of scale, <strong>and</strong><br />
price-cutting, may extend the time lag between innovation<br />
<strong>and</strong> imitation. In practice, it may take years or even decades<br />
before rival firms can successfully imitate a profitable new<br />
product <strong>and</strong> cut into the market share of the innovator. In<br />
the meantime, the innovator continues to profit.<br />
Profitable Buyouts A final advantage of being<br />
first arises from the possibility of a buyout (outright purchase)<br />
of the innovating firm by a larger firm. Here, the<br />
innovative entrepreneurs take their rewards immediately,<br />
as cash or as shares in the purchasing firm, rather than<br />
waiting for perhaps uncertain long-run profits from their<br />
own production <strong>and</strong> marketing efforts.<br />
Examples: Once the popularity of cellular communications<br />
became evident, AT&T bought out<br />
McCaw Communications, an early leader in this new<br />
technology. When Minnetonka’s Softsoap became a huge<br />
success, it sold its product to Colgate-Palmolive. More<br />
recently, Swiss conglomerate Nestlé bought out Chef<br />
America, the highly successful maker of Hot Pockets<br />
frozen meat-<strong>and</strong>-cheese s<strong>and</strong>wiches. Such buyouts are
11W-12<br />
PART TWO<br />
Microeconomics of Product Markets<br />
CONSIDER THIS . . .<br />
Trade Secrets<br />
Trade secrets have long played<br />
an important role in maintaining<br />
returns from research <strong>and</strong><br />
development (R&D). Long before<br />
Coca-Cola’s secret formula or<br />
Colonel S<strong>and</strong>ers’ secret herbs<br />
<strong>and</strong> spices, legend has it that the<br />
Roman citizen Erasmo (c. A. D.130)<br />
had a secret ingredient for violin<br />
strings.* As the dem<strong>and</strong> for his<br />
new product grew, he falsely<br />
identified his strings as catgut, when they were actually made<br />
of sheep intestines. Why the deception At the time, it was<br />
considered to be extremely bad luck to kill a cat. By identifying<br />
his strings as catgut, he hoped that nobody would imitate his<br />
product <strong>and</strong> reduce his monopoly profit. Moreover, his product<br />
name would help him preserve his valuable trade secret.<br />
*We found this anecdote in Dennis W. Carleton <strong>and</strong> Jeffrey Perloff,<br />
Modern Industrial Organization, 2d ed. (New York: HarperCollins, 1994),<br />
p. 139. Their source, in turn, was L. Boyd, San Francisco Chronicle, October<br />
27, 1984, p. 35.<br />
legal under current antitrust laws as long as they do not<br />
substantially lessen competition in the affected industry.<br />
For this to be the case, there must be other strong competitors<br />
in the market. That was not true, for example,<br />
when Microsoft tried to buy out Intuit (maker of Quicken,<br />
the best-selling financial software). That buyout was disallowed<br />
because Intuit <strong>and</strong> Microsoft were the two main<br />
suppliers of financial software for personal computers.<br />
In short, despite the imitation problem, significant<br />
protections <strong>and</strong> advantages enable most innovating firms to<br />
profit from their R&D efforts, as implied by the continuing<br />
high levels of R&D spending by firms year after year.<br />
As shown in Figure 11W.6 , business R&D spending in the<br />
United States not only remains substantial but has grown<br />
over the past quarter-century. The high levels of spending<br />
simply would not continue if imitation consistently <strong>and</strong><br />
severely depressed rates of return on R&D expenditures.<br />
QUICK REVIEW 11W.2<br />
• A firm’s optimal R&D expenditure is the amount at which<br />
the expected rate of return (marginal benefit) from the<br />
R&D expenditure just equals the interest-rate cost of borrowing<br />
(marginal cost) required to finance it.<br />
• Product innovation can entice consumers to substitute a new<br />
product for existing products to increase their total utility,<br />
thereby increasing the innovating firm’s revenue <strong>and</strong> profit.<br />
• Process innovation can lower a firm’s production costs <strong>and</strong><br />
increase its profit by increasing total product <strong>and</strong> decreasing<br />
average total cost.<br />
• A firm faces reduced profitability from R&D if competitors<br />
can successfully imitate its new product or process.<br />
Nevertheless, there are significant potential protections <strong>and</strong><br />
benefits to being first, including patents, copyrights, <strong>and</strong><br />
trademarks; br<strong>and</strong>-name recognition; trade secrets; cost<br />
reductions from learning by doing; <strong>and</strong> major time lags<br />
between innovation <strong>and</strong> imitation.<br />
Business R&D expenditures<br />
in the United States<br />
(billions of 2000 dollars)<br />
$225<br />
200<br />
175<br />
150<br />
125<br />
100<br />
75<br />
Business R&D<br />
expenditures<br />
FIGURE 11W.6 The growth of business R&D expenditures<br />
in the United States, 1980–2006. Inflation-adjusted R&D expenditures<br />
by firms are substantial <strong>and</strong> growing, suggesting that R&D continues to be<br />
profitable for firms, even in the face of possible imitation.<br />
50<br />
1980 1985 1990<br />
Source: National Science Foundation, www.nsf.gov.<br />
1995 2000 2005<br />
Year
Role of Market Structure<br />
In view of our discussion of market structures in the last<br />
three chapters, asking whether some particular market<br />
structure or firm size is best suited to technological<br />
progress is logical. Is a highly competitive industry<br />
consisting of thous<strong>and</strong>s of relatively small firms preferable<br />
to an industry comprising only two or three large firms<br />
Or is some intermediate structure best<br />
Market Structure <strong>and</strong><br />
Technological Advance<br />
As a first step toward answering these questions, we survey<br />
the strengths <strong>and</strong> shortcomings of our four market models<br />
as related to technological advance.<br />
Pure Competition Does a pure competitor have a<br />
strong incentive <strong>and</strong> strong ability to undertake R&D On<br />
the positive side, strong competition provides a reason for<br />
such firms to innovate; competitive firms tend to be less<br />
complacent than monopolists. If a pure competitor does not<br />
seize the initiative, one or more rivals may introduce a new<br />
product or cost-reducing production technique that could<br />
drive it from the market. As a matter of short-term profit<br />
<strong>and</strong> long-term survival, the pure competitor is under continual<br />
pressure to improve products <strong>and</strong> lower costs through<br />
innovation. Also, where there are many competing firms,<br />
there is less chance that an idea for improving a product or<br />
process will be overlooked by a single firm.<br />
On the negative side, the expected rate of return on<br />
R&D may be low or even negative for a pure competitor.<br />
Because of easy entry, its profit rewards from innovation<br />
may quickly be competed away by existing or entering firms<br />
that also produce the new product or adopt the new technology.<br />
Also, the small size of competitive firms <strong>and</strong> the fact<br />
that they earn only a normal profit in the long run lead to<br />
serious questions as to whether they can finance substantial<br />
R&D programs. Observers have noted that the high rate<br />
of technological advance in the purely competitive agricultural<br />
industry, for example, has come not from the R&D<br />
of individual farmers but from government-sponsored<br />
research <strong>and</strong> from the development of fertilizers, hybrid<br />
seed, <strong>and</strong> farm implements by oligopolistic firms.<br />
Monopolistic Competition Like pure competitors,<br />
monopolistic competitors cannot afford to be complacent.<br />
But unlike pure competitors, which sell st<strong>and</strong>ardized<br />
products, monopolistic competitors have a strong profit incentive<br />
to engage in product innovation. This incentive to<br />
differentiate products from those of competitors stems from<br />
the fact that sufficiently novel products may create monopoly<br />
CHAPTER 11W<br />
<strong>Technology</strong>, R&D, <strong>and</strong> Effi ciency 11W-13<br />
power <strong>and</strong> thus economic profit. There are many examples of<br />
innovative firms (McDonald’s, Blockbuster Video, Starbuck’s<br />
Coffee Company) that started out as monopolistic competitors<br />
in localized markets but soon gained considerable<br />
national market power, with the attendant economic profit.<br />
For the typical firm, however, the shortcomings of monopolistic<br />
competition in relation to technological advance<br />
are the same as those of pure competition. Most monopolistic<br />
competitors remain small, which limits their ability to secure<br />
inexpensive financing for R&D. In addition, monopolistic<br />
competitors find it difficult to extract large profits from<br />
technological advances. Any economic profits from innovation<br />
are usually temporary because entry to monopolistically<br />
competitive industries is relatively easy. In the long run, new<br />
entrants with similar goods reduce the dem<strong>and</strong> for the innovator’s<br />
product, leaving the innovator with only a normal<br />
profit. Monopolistic competitors therefore usually have relatively<br />
low expected rates of return on R&D expenditures.<br />
Oligopoly Many of the characteristics of oligopoly are<br />
conducive to technological advance. First, the large size of<br />
oligopolists enables them to finance the often large R&D<br />
costs associated with major product or process innovation.<br />
In particular, the typical oligopolist realizes an ongoing economic<br />
profit, a part of which is retained. This undistributed<br />
profit serves as a major source of readily available, relatively<br />
low-cost funding for R&D. Moreover, the existence of barriers<br />
to entry gives the oligopolist some assurance that it<br />
can maintain any economic profit it gains from innovation.<br />
Then, too, the large sales volume of the oligopolist enables it<br />
to spread the cost of specialized R&D equipment <strong>and</strong> teams<br />
of specialized researchers over a great many units of output.<br />
Finally, the broad scope of R&D activity within oligopolistic<br />
firms helps them offset the inevitable R&D “misses” with<br />
more-than-compensating R&D “hits.” Thus, oligopolists<br />
clearly have the means <strong>and</strong> incentive to innovate.<br />
But there is also a negative side to R&D in oligopoly. In<br />
many instances, the oligopolist’s incentive to innovate may<br />
be far less than we have implied above because oligopoly<br />
tends to breed complacency. An oligopolist may reason<br />
that introducing costly new technology <strong>and</strong> producing<br />
new products makes little sense when it currently is earning<br />
a sizable economic profit without them. The oligopolist<br />
wants to maximize its profit by exploiting fully all its capital<br />
assets. Why rush to develop a new product (say, batteries for<br />
electric automobiles) when that product’s success will render<br />
obsolete much of the firm’s current equipment designed to<br />
produce its existing product (say, gasoline engines) It is not<br />
difficult to cite oligopolistic industries in which the largest<br />
firms’ interest in R&D has been quite modest. Examples:<br />
the steel, cigarette, <strong>and</strong> aluminum industries.
11W-14<br />
PART TWO<br />
Microeconomics of Product Markets<br />
Pure Monopoly In general, the pure monopolist has<br />
little incentive to engage in R&D; it maintains its high profit<br />
through entry barriers that, in theory, are complete. The<br />
only incentive for the pure monopolist to engage in R&D is<br />
defensive: to reduce the risk of being blindsided by some new<br />
product or production process that destroys its monopoly. If<br />
such a product is out there to be discovered, the monopolist<br />
may have an incentive to find it. By so doing, it can either<br />
exploit the new product or process for continued monopoly<br />
profit or suppress the product until the monopolist has extracted<br />
the maximum profit from its current capital assets.<br />
But, in general, economists agree that pure monopoly is the<br />
market structure least conducive to innovation.<br />
Inverted-U Theory of R&D<br />
Analysis like this has led some experts on technological<br />
progress to postulate a so-called inverted-U theory of<br />
R&D, which deals with the relationship between market<br />
structure <strong>and</strong> technological advance. This theory is illustrated<br />
in Figure 11W.7 , which relates R&D spending as<br />
a percentage of a firm’s sales (vertical axis) to the industry’s<br />
four-firm concentration ratio (horizontal axis). The<br />
“inverted-U” shape of the curve suggests that R&D effort<br />
is at best weak in both very-low-concentration industries<br />
(pure competition) <strong>and</strong> very-high-concentration industries<br />
(pure monopoly). Starting from the lowest concentrations,<br />
R&D spending as a percentage of sales rises with<br />
concentration until a concentration ratio of 50 percent or<br />
so is reached, meaning that the four largest firms account<br />
for about one-half the total industry output. Beyond that,<br />
relative R&D spending decreases as concentration rises.<br />
FIGURE 11W.7 The inverted-U theory of R&D<br />
expenditures. The inverted-U theory suggests that R&D expenditures<br />
as a percentage of sales rise with industry concentration until the four-firm<br />
concentration ratio reaches about 50 percent. Further increases in industry<br />
concentration are associated with lower relative R&D expenditures.<br />
R&D expenditures as a<br />
percentage of sales<br />
More competition<br />
Less competition<br />
The logic of the inverted-U theory follows from our<br />
discussion. Firms in industries with very low concentration<br />
ratios are mainly competitive firms. They are small, <strong>and</strong> this<br />
makes it difficult for them to finance R&D. Moreover, entry<br />
to these industries is easy, making it difficult to sustain economic<br />
profit from innovations that are not supported by<br />
patents. As a result, firms in these industries spend little on<br />
R&D relative to their sales. At the other end (far right) of the<br />
curve, where concentration is exceptionally high, monopoly<br />
profit is already high <strong>and</strong> innovation will not add much more<br />
profit. Furthermore, innovation typically requires costly<br />
retooling of very large factories, which will cut into whatever<br />
additional profit is realized. As a result, the expected rate of<br />
return from R&D is quite low, as are expenditures for R&D<br />
relative to sales. Finally, the lack of rivals makes the monopolist<br />
quite complacent about R&D.<br />
The optimal industry structure for R&D is one in which<br />
expected returns on R&D spending are high <strong>and</strong> funds to<br />
finance it are readily available <strong>and</strong> inexpensive. From our<br />
discussion, those factors seem to occur in industries where<br />
a few firms are absolutely <strong>and</strong> relatively large but where<br />
the concentration ratio is not so high as to prohibit vigorous<br />
competition by smaller rivals. Rivalry among the larger<br />
oligopolistic firms <strong>and</strong> competition between the larger <strong>and</strong><br />
the smaller firms then provide a strong incentive for R&D.<br />
The inverted-U theory of R&D, as represented by Figure<br />
11W.7 , also points toward this “loose” oligopoly as the optimal<br />
structure for R&D spending.<br />
Market Structure <strong>and</strong> Technological<br />
Advance: The Evidence<br />
Various industry studies <strong>and</strong> cross-industry studies collectively<br />
support the inverted-U theory of R&D. 1 Other<br />
things equal, the optimal market structure for technological<br />
advance seems to be an industry in which there is a mix of<br />
large oligopolistic firms (a 40 to 60 percent concentration<br />
ratio), with several highly innovative smaller firms.<br />
But our “other-things-equal” qualification is quite<br />
important here. Whether or not a particular industry is<br />
highly technical may well be a more important determinant<br />
of R&D than its structure. While some concentrated<br />
industries (electronics, aircraft, <strong>and</strong> petroleum) devote large<br />
quantities of resources to R&D <strong>and</strong> are very innovative,<br />
others (cigarettes, aluminum, gypsum products) are not.<br />
The level of R&D spending within an industry seems to depend<br />
as much on its technical character <strong>and</strong> “technological<br />
0 25 50 75 100<br />
Concentration ratio (percent)<br />
1 One such recent study is that by Philippe Aghion et al., “Competition<br />
<strong>and</strong> Innovation: An Inverted-U Relationship,” Quarterly Journal of<br />
Economics, May 2005, pp. 701–728.
CHAPTER 11W<br />
<strong>Technology</strong>, R&D, <strong>and</strong> Effi ciency 11W-15<br />
opportunities” as on its market structure. There simply<br />
may be more opportunities to innovate in the computer <strong>and</strong><br />
pharmaceutical industries, for example, than in the brickmaking<br />
<strong>and</strong> coal-mining industries.<br />
Conclusion: The inverted-U curve shown in<br />
Figure 11W.7 is a useful depiction of the general relationship<br />
between R&D spending <strong>and</strong> market structure, other<br />
things equal.<br />
Technological Advance <strong>and</strong><br />
<strong>Efficiency</strong><br />
Technological advance contributes significantly to<br />
economic efficiency. New <strong>and</strong> better processes <strong>and</strong> products<br />
enable society to produce more output, as well as a<br />
higher-valued mix of output.<br />
Productive <strong>Efficiency</strong><br />
Technological advance as embodied in process innovation<br />
improves productive efficiency by increasing the productivity<br />
of inputs (as indicated in Figure 11W.5 a) <strong>and</strong> by reducing<br />
average total costs (as in Figure 11W.5 b). In other words, it<br />
enables society to produce the same amount of a particular<br />
good or service while using fewer scarce resources, thereby<br />
freeing the unused resources to produce other goods <strong>and</strong><br />
services. Or if society desires more of the now less expensive<br />
good, process innovation enables it to have that greater<br />
quantity without sacrificing other goods. Viewed either<br />
way, process innovation enhances productive efficiency: It<br />
reduces society’s per-unit cost of whatever mix of goods <strong>and</strong><br />
services it chooses. It thus is an important means of shifting<br />
an economy’s production possibilities curve rightward.<br />
Allocative <strong>Efficiency</strong><br />
Technological advance as embodied in product (or service)<br />
innovation enhances allocative efficiency by giving society<br />
a more preferred mix of goods <strong>and</strong> services. Recall from<br />
our earlier discussion that consumers buy a new product<br />
rather than an old product only when buying the new<br />
one increases the total utility obtained from their limited<br />
incomes. Obviously, then, a popular new product—<strong>and</strong><br />
the new mix of products it implies—creates a higher level<br />
of total utility for society.<br />
In terms of markets, the dem<strong>and</strong> for the new product<br />
rises <strong>and</strong> the dem<strong>and</strong> for the old product declines. The high<br />
economic profit engendered by the new product attracts<br />
resources away from less valued uses <strong>and</strong> to the production<br />
of the new product. In theory, such shifting of resources<br />
continues until the price of the new product equals its marginal<br />
cost.<br />
There is a caveat here, however. Innovation (either<br />
product or process) can create monopoly power through<br />
patents or through the many advantages of being first.<br />
When new monopoly power results from an innovation,<br />
society may lose part of the improved efficiency it otherwise<br />
would have gained from that innovation. The reason is<br />
that the profit-maximizing monopolist restricts output<br />
to keep its product price above marginal cost. For example,<br />
Microsoft’s innovative Windows product has resulted<br />
in dominance in the market for Intel-compatible operating<br />
systems for personal computers. Microsoft’s substantial<br />
monopoly power permits it to charge prices that are well<br />
above marginal cost <strong>and</strong> minimum average total cost.<br />
Creative Destruction<br />
Although innovation can create monopoly power, it also<br />
can reduce or eliminate it. By increasing competition<br />
where it previously was weak, innovation can push prices<br />
down toward marginal cost. For example, Intel’s microprocessor<br />
enabled personal computers, <strong>and</strong> their ease of<br />
production eventually diminished IBM’s monopoly power<br />
in the sale of computer hardware. More recently, Linux’s<br />
new computer operating system has provided some promising<br />
competition for Microsoft Windows.<br />
At the extreme, innovation may cause creative<br />
destruction , where the creation of new products <strong>and</strong> new<br />
production methods simultaneously destroys the monopoly<br />
market positions of firms committed to existing products<br />
<strong>and</strong> old ways of doing business. As stated many years<br />
ago by Joseph Schumpeter, who championed this view:<br />
In capitalist reality . . . it is . . . competition from the new<br />
commodity, the new technology, the new source of supply,<br />
the new type of business organization—competition which<br />
comm<strong>and</strong>s a decisive cost or quality advantage <strong>and</strong> which<br />
strikes not at the margins of profits of the existing firms<br />
but at their foundation <strong>and</strong> their very lives. This kind of<br />
competition is . . . so . . . important that it becomes a matter<br />
of comparative indifference whether competition in the<br />
ordinary sense functions more or less promptly; the powerful<br />
lever that in the [very] long run exp<strong>and</strong>s output <strong>and</strong><br />
brings down prices is in any case made of other stuff. 2<br />
There are many examples of creative destruction:<br />
In the 1800s wagons, ships, <strong>and</strong> barges were the only<br />
means of transporting freight until the railroads broke<br />
up their monopoly; the dominant market position of the<br />
railroads was, in turn, undermined by trucks <strong>and</strong>, later,<br />
by airplanes. Movies brought new competition to live<br />
theater, at one time the “only show in town,” but movies<br />
2 Joseph A. Schumpeter, Capitalism, Socialism, <strong>and</strong> Democracy, 3d ed.<br />
(New York: Harper & Row, 1950), pp. 84–85.
LAST Word<br />
PART TWO<br />
11W-16<br />
Microeconomics of Product Markets<br />
On the Path to the Personal Computer <strong>and</strong> Internet<br />
Technological Advance Is Clearly Evident in the<br />
Development of the Modern Personal Computer<br />
<strong>and</strong> the Emergence of the Internet. Here Is a Brief<br />
History of Those Events.<br />
1945 Grace Murray Hopper finds a dead moth between<br />
relay contacts in the experimental Mark II computer<br />
at Harvard University. Whenever the computer<br />
subsequently malfunctions, workers set out to “debug”<br />
the device.<br />
1946 ENIAC is revealed. A precursor to the modern-day<br />
computer, it relies on 18,000 vacuum tubes <strong>and</strong> fills<br />
3000 cubic feet of space.<br />
1947 AT&T scientists invent the “transfer resistance<br />
device,” later known as the transistor. It replaces the<br />
less reliable vacuum tubes in computers.<br />
1961 Bob Noyce (who later founded Intel Corporation)<br />
<strong>and</strong> Jack Kilby invent the first integrated circuit,<br />
which miniaturizes electronic circuitry onto a single<br />
silicon chip.<br />
1964 IBM introduces the System360 computer. Configured<br />
as a system, it takes up nearly the same space as<br />
two tennis courts.<br />
1965 Digital Equipment Corporation unveils its PDP-8,<br />
the first relatively small-size computer<br />
(a “minicomputer”).<br />
1969 A networking system called ARPANET is born; it is<br />
the beginning of the Internet.<br />
1971 Intel introduces its 4004 processor (a “microprocessor”).<br />
The $200 chip is the size of a thumbnail <strong>and</strong> has<br />
as much computing capability as the earlier ENIAC.<br />
1975 Xerox markets Alto, the first personal computer<br />
(a “microcomputer”). Bill Gates <strong>and</strong> Paul Allen found<br />
Microsoft. MITS Corporation’s Altair 8800 arrives on<br />
the scene. It contains Intel’s 8080 microprocessor that<br />
Intel developed a year earlier to control traffic lights.<br />
1977 Apple II, Commodore’s PET, <strong>and</strong> T<strong>and</strong>y Radio<br />
Shack TRS-80 go on sale, setting the stage for the<br />
personal computer revolution.<br />
1981 IBM enters the market with its personal computer<br />
powered by the Intel 8800 chip <strong>and</strong> operated by the<br />
Microsoft Disc Operating System (MS-DOS).<br />
Osborne Computer markets the Osborne 1, the first<br />
self-contained microcomputer, but within 2 years the<br />
firm declares bankruptcy. Logitech commercializes<br />
the “X-Y Position Indicator for a Display System,”<br />
invented earlier by Douglas Engelbart in a<br />
government-funded research lab. Someone dubs it a<br />
“computer mouse” because it appears to have a tail.<br />
1982 Compaq Computer “clones” the IBM machines;<br />
others do the same. Eventually Compaq becomes one<br />
of the leading sellers of personal computers.<br />
1984 Apple introduces its Macintosh computer, with its<br />
“user-friendly” icons, attached mouse, <strong>and</strong> preloaded<br />
software. College student Michael Dell founds Dell<br />
Computers, which builds personal computers <strong>and</strong> sells<br />
them through mail order. IBM, Sears Roebuck, <strong>and</strong><br />
CBS team up to launch Prodigy Services, the first<br />
online computer business.<br />
1985 Microsoft releases its Windows graphical interface<br />
operating system that improves upon MS-DOS. Ted<br />
Waitt starts a mail-order personal computer business<br />
(Gateway 2000) out of his South Dakota barn.<br />
were later challenged by television. Vinyl long-playing<br />
records supplanted acetate 78-rpm phonograph records;<br />
cassettes then challenged LP records; <strong>and</strong> compact discs<br />
ORIGIN OF THE IDEA<br />
O 11W.1<br />
Creative destruction<br />
undermined cassettes.<br />
Now iPods, MP3 players,<br />
<strong>and</strong> Internet music<br />
downloads threaten sales<br />
of traditional CDs. Aluminum<br />
cans <strong>and</strong> plastic bottles have displaced glass<br />
bottles in many uses. E-mail has challenged the postal<br />
service. Mass discounters such as Wal-Mart <strong>and</strong> Costco<br />
have gained market share at the expense of Sears <strong>and</strong><br />
Montgomery Ward.<br />
According to Schumpeter, an innovator will automatically<br />
displace any monopolist that no longer delivers<br />
superior performance. But many contemporary economists<br />
think this notion reflects more wishful thinking<br />
than fact. In this view, the idea that creative destruction<br />
is automatic<br />
. . . neglects the ability of powerful established firms to erect<br />
private storm shelters—or lobby government to build public<br />
storm shelters for them—in order to shield themselves from<br />
11W-16
CHAPTER 11W<br />
<strong>Technology</strong>, R&D, <strong>and</strong> Effi ciency 11W-17<br />
1990 Microsoft introduces Windows 3.0, which, like<br />
Macintosh, features windows, icons, <strong>and</strong> pulldown<br />
menus. Apple sues Microsoft for copyright<br />
infringement.<br />
1991 The World Wide<br />
Web (an Internet<br />
system) is invented.<br />
1993 Intel introduces its<br />
first of several Pentium<br />
chips, which<br />
greatly speed up<br />
computing. The<br />
courts reject Apple’s<br />
claim that Microsoft<br />
violated its copyrights<br />
on its Macintosh<br />
operating system.<br />
1994 Marc Andreessen<br />
starts up Netscape<br />
Communications <strong>and</strong><br />
markets Netscape<br />
Navigator, which<br />
quickly becomes the<br />
leading software<br />
browser for the<br />
emerging Internet.<br />
David Filo <strong>and</strong> Jerry<br />
Yang develop Yahoo, a<br />
system for locating<br />
material stored on the<br />
Internet.<br />
1995 Microsoft releases the Windows 95 operating<br />
system, which becomes the dominant operating<br />
system of personal computers (90 percent market<br />
share). Microsoft is now well established as the<br />
world’s leading software producer. Sun<br />
Microsystems introduces Java, an Internet programming<br />
language.<br />
1996 Playing catch-up with Netscape, Microsoft develops<br />
Microsoft Internet Explorer <strong>and</strong> gives it away free.<br />
1999 Netscape’s market share<br />
plunges <strong>and</strong> it merges with<br />
America Online. More than 100<br />
million personal computers are<br />
manufactured worldwide this<br />
year alone.<br />
2000 Sixty percent of American<br />
households have access to the<br />
Internet either at home or at<br />
work, <strong>and</strong> the Internet spreads<br />
worldwide. Internet commerce<br />
in the United States reaches<br />
$300 billion, <strong>and</strong> an estimated<br />
1.2 million U.S. jobs are<br />
Internet-related.<br />
2002 A Federal court of appeals<br />
finds that Microsoft has a monopoly<br />
in operating system software<br />
for Intel-compatible<br />
personal computers <strong>and</strong> has<br />
maintained its monopoly through<br />
illegal actions aimed at thwarting<br />
threats from rivals. The court<br />
imposes a set of specific<br />
restrictions on Microsoft’s anticompetitive<br />
business practices.<br />
2005 Google, the innovative Internet search company,<br />
becomes the “darling” of Wall Street as its share price<br />
rises from $85 at its initial public offering (IPO) in<br />
August 2004 to $700 at the end of 2007.<br />
Source: Based partly on Diedtra Henderson, “Moore’s Law Still<br />
Reigns,” Seattle Times, Nov. 24, 1996, augmented <strong>and</strong> updated.<br />
the Schumpeterian gales of creative destruction. It ignores<br />
the difference between the legal freedom of entry <strong>and</strong> the<br />
economic reality deterring the entry of potential newcomers<br />
into concentrated industries. 3<br />
That is, some dominant firms may be able to use strategies<br />
such as selective price cutting, buyouts, <strong>and</strong> massive<br />
advertising to block entry <strong>and</strong> competition from even the<br />
3 Walter Adams <strong>and</strong> James Brock, The Structure of American Industry, 10th<br />
ed. (Upper Saddle River, N.J.: Prentice Hall, 2001), pp. 363–364.<br />
most innovative new firms <strong>and</strong> existing rivals. Moreover,<br />
politically active dominant firms have been known to persuade<br />
government to give them tax breaks, subsidies, <strong>and</strong><br />
tariff protection that strengthen their market power.<br />
In short, while innovation in general enhances economic<br />
efficiency, in some cases it may lead to entrenched monopoly<br />
power. Further innovation may eventually destroy that<br />
monopoly power, but the process of creative destruction is<br />
neither automatic nor inevitable. On the other h<strong>and</strong>, the<br />
possession of monopoly power does not necessarily preclude<br />
rapid technological advance, innovation, or efficiency.<br />
11W-17
11W-18<br />
PART TWO<br />
Microeconomics of Product Markets<br />
Summary<br />
1. Technological advance is evidenced by new <strong>and</strong> improved<br />
goods <strong>and</strong> services <strong>and</strong> new <strong>and</strong> improved production or<br />
distribution processes. In economists’ models, technological<br />
advance occurs only in the very long run.<br />
2. Invention is the discovery of a product or process through the<br />
use of imagination, ingenuity, <strong>and</strong> experimentation. Innovation<br />
is the first successful commercial introduction of a new<br />
product, the first use of a new method, or the creation of a<br />
new form of business enterprise. Diffusion is the spread of an<br />
earlier innovation among competing firms. Firms channel a<br />
majority of their R&D expenditures to innovation <strong>and</strong> imitation,<br />
rather than to basic scientific research <strong>and</strong> invention.<br />
3. Historically, most economists viewed technological advance<br />
as a r<strong>and</strong>om, external force to which the economy adjusted.<br />
Many contemporary economists see technological advance<br />
as occurring in response to profit incentives within the<br />
economy <strong>and</strong> thus as an integral part of capitalism.<br />
4. Entrepreneurs <strong>and</strong> other innovators try to anticipate the<br />
future. They play a central role in technological advance<br />
by initiating changes in products <strong>and</strong> processes. Entrepreneurs<br />
often form start-up firms that focus on creating <strong>and</strong><br />
introducing new products. Sometimes, innovators work in<br />
the R&D labs of major corporations. Entrepreneurs <strong>and</strong> innovative<br />
firms often rely heavily on the basic research done<br />
by university <strong>and</strong> government scientists.<br />
5. A firm’s optimal amount of R&D spending occurs where its<br />
expected return (marginal benefit) from the R&D equals<br />
its interest-rate cost of funds (marginal cost) to finance the<br />
R&D. Entrepreneurs <strong>and</strong> firms use several sources to finance<br />
R&D, including (a) bank loans, (b) bonds, (c) venture capital<br />
(funds lent in return for a share of the profits if the business<br />
succeeds), (d) undistributed corporate profits (retained<br />
earnings), <strong>and</strong> (e) personal savings.<br />
6. Product innovation, the introduction of new products, succeeds<br />
when it provides consumers with higher marginal utility<br />
per dollar spent than do existing products. The new product<br />
enables consumers to obtain greater total utility from a given<br />
income. From the firm’s perspective, product innovation<br />
increases net revenue sufficiently to yield a positive rate of<br />
return on the R&D spending that produced the innovation.<br />
7. Process innovation can lower a firm’s production costs<br />
by improving its internal production techniques. Such<br />
improvement increases the firm’s total product, thereby<br />
lowering its average total cost <strong>and</strong> increasing its profit. The<br />
added profit provides a positive rate of return on the R&D<br />
spending that produced the process innovation.<br />
8. Imitation poses a potential problem for innovators since<br />
it threatens their returns on R&D expenditures. Some<br />
dominant firms use a fast-second strategy, letting smaller<br />
firms initiate new products <strong>and</strong> then quickly imitating the<br />
successes. Nevertheless, there are significant protections<br />
<strong>and</strong> potential benefits for firms that take the lead with R&D<br />
<strong>and</strong> innovation, including (a) patent protection, (b) copyrights<br />
<strong>and</strong> trademarks, (c) lasting br<strong>and</strong>-name recognition,<br />
(d) benefits from trade secrets <strong>and</strong> learning by doing,<br />
(e) high economic profits during the time lag between a<br />
product’s introduction <strong>and</strong> its imitation, <strong>and</strong> (f) the possibility<br />
of lucrative buyout offers from larger firms.<br />
9. Each of the four basic market structures has potential strengths<br />
<strong>and</strong> weaknesses regarding the likelihood of R&D <strong>and</strong> innovation.<br />
The inverted-U theory of R&D holds that a firm’s R&D<br />
spending as a percentage of its sales rises with its industry fourfirm<br />
concentration ratio, reaches a peak at a 50 percent concentration<br />
ratio, <strong>and</strong> then declines as concentration increases<br />
further. Empirical evidence is not clear-cut but lends general<br />
support to this theory. For any specific industry, however, the<br />
technological opportunities that are available may count more<br />
than market structure in determining R&D spending <strong>and</strong><br />
innovation.<br />
10. In general, technological advance enhances both productive<br />
<strong>and</strong> allocative efficiency. But in some situations patents <strong>and</strong><br />
the advantages of being first with an innovation can increase<br />
monopoly power. While in some cases creative destruction<br />
eventually destroys monopoly, most economists doubt that<br />
this process is either automatic or inevitable.<br />
Terms <strong>and</strong> Concepts<br />
technological advance<br />
very long run<br />
invention<br />
patent<br />
innovation<br />
product innovation<br />
process innovation<br />
diffusion<br />
start-ups<br />
venture capital<br />
interest-rate cost-of-funds curve<br />
expected-rate-of-return curve<br />
optimal amount of R&D<br />
imitation problem<br />
fast-second strategy<br />
inverted-U theory of R&D<br />
creative destruction
Study Questions<br />
1. What is meant by technological advance, as broadly defined<br />
How does technological advance enter into the definition<br />
of the very long run Which of the following are examples<br />
of technological advance, <strong>and</strong> which are not: an improved<br />
production process; entry of a firm into a profitable purely<br />
competitive industry; the imitation of a new production<br />
process by another firm; an increase in a firm’s advertising<br />
expenditures LO1<br />
2. Listed below are several possible actions by firms. Write<br />
“INV” beside those that reflect invention, “INN” beside<br />
those that reflect innovation, <strong>and</strong> “DIF” beside those that<br />
reflect diffusion. LO1<br />
a. An auto manufacturer adds “heated seats” as a st<strong>and</strong>ard<br />
feature in its luxury cars to keep pace with a rival firm<br />
whose luxury cars already have this feature.<br />
b. A television production company pioneers the first<br />
music video channel.<br />
c. A firm develops <strong>and</strong> patents a working model of a<br />
self-erasing whiteboard for classrooms.<br />
d. A lightbulb firm is the first to produce <strong>and</strong> market<br />
lighting fixtures with halogen lamps.<br />
e. A rival toy maker introduces a new Jenny doll to<br />
compete with Mattel’s Barbie doll.<br />
3. Contrast the older <strong>and</strong> the modern views of technological<br />
advance as they relate to the economy. What is the role<br />
of entrepreneurs <strong>and</strong> other innovators in technological<br />
advance How does research by universities <strong>and</strong> government<br />
affect innovators <strong>and</strong> technological advance Why do<br />
you think some university researchers are becoming more<br />
like entrepreneurs <strong>and</strong> less like “pure scientists” LO2<br />
4. KEY QUESTION Suppose a firm expects that a $20 million<br />
expenditure on R&D will result in a new product that will<br />
increase its revenue by a total of $30 million 1 year from<br />
now. The firm estimates that the production cost of the new<br />
product will be $29 million. LO3<br />
a. What is the expected rate of return on this R&D<br />
expenditure<br />
b. Suppose the firm can get a bank loan at 6 percent<br />
interest to finance its $20 million R&D project.<br />
Will the firm undertake the project Explain why or<br />
why not.<br />
c. Now suppose the interest-rate cost of borrowing, in<br />
effect, falls to 4 percent because the firm decides to use<br />
its own retained earnings to finance the R&D. Will this<br />
lower interest rate change the firm’s R&D<br />
decision Explain.<br />
5. KEY QUESTION Answer the following lettered questions<br />
on the basis of the information in this table: LO3<br />
<br />
economics<br />
CHAPTER 11W<br />
<strong>Technology</strong>, R&D, <strong>and</strong> Effi ciency<br />
Expected Rate of<br />
Amount of R&D, Millions Return on R&D, %<br />
$10 16<br />
20 14<br />
30 12<br />
40 10<br />
50 8<br />
60 6<br />
a. If the interest-rate cost of funds is 8 percent, what will<br />
be the optimal amount of R&D spending for this firm<br />
b. Explain why $20 million of R&D spending will not<br />
be optimal.<br />
c. Why won’t $60 million be optimal either<br />
6. KEY QUESTION Refer to Table 11W.1 <strong>and</strong> suppose the<br />
price of new product C is $2 instead of $4. How does this<br />
affect the optimal combination of products A, B, <strong>and</strong> C for<br />
the person represented by the data Explain: “The success<br />
of a new product depends not only on its marginal utility but<br />
also on its price.” LO3<br />
7. Learning how to use software takes time. So once customers<br />
have learned to use a particular software package, it is easier to<br />
sell them software upgrades than to convince them to switch<br />
to new software. What implications does this have for expected<br />
rates of return on R&D spending for software firms developing<br />
upgrades versus firms developing imitative products LO4<br />
8. KEY QUESTION Answer the following questions on the basis<br />
of this information for a single firm: total cost of capital <br />
$1000; price paid for labor $12 per labor unit; price paid<br />
for raw materials $4 per raw-material unit. LO3<br />
a. Suppose the firm can produce 5000 units of output by<br />
combining its fixed capital with 100 units of labor <strong>and</strong><br />
450 units of raw materials. What are the total cost <strong>and</strong><br />
average total cost of producing the 5000 units of output<br />
b. Now assume the firm improves its production process<br />
so that it can produce 6000 units of output by combining<br />
its fixed capital with 100 units of labor <strong>and</strong> 450 units<br />
of raw materials. What are the total cost <strong>and</strong> average<br />
cost of producing the 6000 units of output<br />
c. Refer to your answers to 8a <strong>and</strong> 8b <strong>and</strong> explain how<br />
process innovation can improve economic efficiency.<br />
9. Why might a firm making a large economic profit from its existing<br />
product employ a fast-second strategy in relationship to<br />
new or improved products What risks does it run in pursuing<br />
this strategy What incentive does a firm have to engage<br />
in R&D when rivals can imitate its new product LO4<br />
11W-19
11W-20<br />
PART TWO<br />
Microeconomics of Product Markets<br />
10. Do you think the overall level of R&D would increase or<br />
decrease over the next 20 to 30 years if the lengths of new<br />
patents were extended from 20 years to, say, “forever”<br />
What if the duration were reduced from 20 years to, say, 3<br />
years LO4<br />
11. Make a case that neither pure competition nor pure monopoly<br />
is conducive to a great deal of R&D spending <strong>and</strong> innovation.<br />
Why might oligopoly be more favorable to R&D spending<br />
<strong>and</strong> innovation than either pure competition or pure<br />
monopoly What is the inverted-U theory of R&D, <strong>and</strong> how<br />
does it relate to your answers to these questions LO5<br />
12. Evaluate: “Society does not need laws outlawing monopolization<br />
<strong>and</strong> monopoly. Inevitably, monopoly causes its own<br />
self-destruction since its high profit is the lure for other firms<br />
or entrepreneurs to develop substitute products.” LO6<br />
13. LAST WORD Identify a specific example of each of the following<br />
in this chapter’s Last Word: (a) entrepreneurship,<br />
(b) invention, (c) innovation, <strong>and</strong> (d) diffusion.<br />
Web-Based Questions<br />
1. THE NATIONAL SCIENCE FOUNDATION R&D<br />
STATISTICS—WHAT’S HAPPENING Go to the<br />
Division of Science Resource Statistics Web site,<br />
www.nsf.gov/statistics/natlpatterns , to find National<br />
Patterns of R&D. Select the most recent update year. Then<br />
select Full Publication. Use the historical data tables to determine<br />
whether the following R&D numbers increased,<br />
remained constant, or decreased over the last 5 years listed:<br />
( a ) Total U.S. R&D expenditures in constant dollars,<br />
( b ) Federal support for R&D in constant dollars, ( c ) R&D<br />
as a percentage of U.S. GDP, <strong>and</strong> ( d ) Federal support of<br />
R&D as a percentage of GDP. What are the technological<br />
implications of these figures for the United States<br />
2. NASA—ARE THERE COMMERCIAL SPIN-OFFS Visit<br />
the Web site of NASA’s <strong>Technology</strong> Transfer Office, at<br />
www.sti.nasa.gov/tto , to identify significant commercial<br />
benefits from secondary use of NASA technology.<br />
Search the database to find <strong>and</strong> describe five such spin-offs.<br />
How does the NASA Commercial <strong>Technology</strong> Network,<br />
nctn.hq.nasa.gov, move technology from the lab to the<br />
marketplace<br />
FURTHER TEST YOUR KNOWLEDGE AT<br />
www.mcconnell18e.com