Technology, R&D, and Efficiency - McGraw-Hill Higher Education
Technology, R&D, and Efficiency - McGraw-Hill Higher Education
Technology, R&D, and Efficiency - McGraw-Hill Higher Education

Create successful ePaper yourself
Turn your PDF publications into a flip-book with our unique Google optimized e-Paper software.
IN THIS CHAPTER YOU WILL LEARN:<br />
1 The differences between invention,<br />
innovation, <strong>and</strong> technological diffusion.<br />
2 How entrepreneurs <strong>and</strong> other innovators<br />
further technological advance.<br />
3 How a firm determines its optimal amount<br />
of research <strong>and</strong> development (R&D).<br />
4 Why firms can benefit from their innovation even<br />
though rivals have an incentive to imitate it.<br />
5 About the role of market structure in<br />
promoting technological advance.<br />
6 How technological advance enhances productive<br />
efficiency <strong>and</strong> allocative efficiency.<br />
Bonus Web Chapter<br />
11<br />
WEB<br />
www.mcconnell18e.com<br />
<strong>Technology</strong>, R&D, <strong>and</strong><br />
<strong>Efficiency</strong><br />
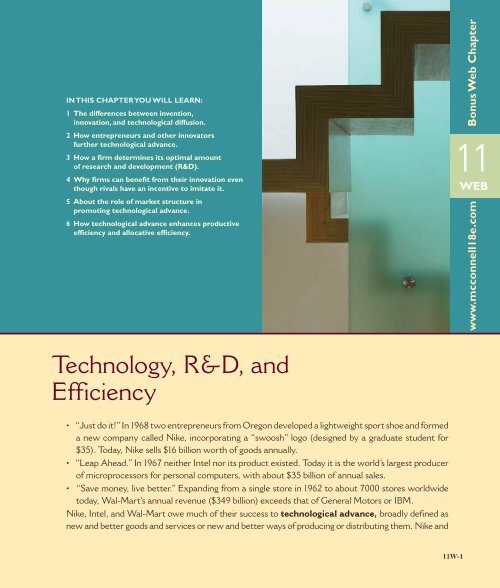
• “Just do it!” In 1968 two entrepreneurs from Oregon developed a lightweight sport shoe <strong>and</strong> formed<br />
a new company called Nike, incorporating a “swoosh” logo (designed by a graduate student for<br />
$35). Today, Nike sells $16 billion worth of goods annually.<br />
• “Leap Ahead.” In 1967 neither Intel nor its product existed. Today it is the world’s largest producer<br />
of microprocessors for personal computers, with about $35 billion of annual sales.<br />
• “Save money, live better.” Exp<strong>and</strong>ing from a single store in 1962 to about 7000 stores worldwide<br />
today, Wal-Mart’s annual revenue ($349 billion) exceeds that of General Motors or IBM.<br />
Nike, Intel, <strong>and</strong> Wal-Mart owe much of their success to technological advance, broadly defined as<br />
new <strong>and</strong> better goods <strong>and</strong> services or new <strong>and</strong> better ways of producing or distributing them. Nike <strong>and</strong><br />
11W-1
Intel pioneered innovative new products, <strong>and</strong> Wal-Mart developed creative ways to manage inventories<br />
<strong>and</strong> distribute goods.<br />
Multiply these examples—perhaps on a smaller scale—by thous<strong>and</strong>s in the economy! The pursuit<br />
of technological advance is a major competitive activity among firms. In this chapter, we examine some<br />
of the microeconomics of that activity.<br />
Invention, Innovation,<br />
<strong>and</strong> Diffusion<br />
For economists, technological advance occurs over a theoretical<br />
time period called the very long run, which can be as<br />
short as a few months or as long as many years. Recall that<br />
in our four market models (pure competition, monopolistic<br />
competition, oligopoly, <strong>and</strong> pure monopoly), the short<br />
run is a period in which technology <strong>and</strong> plant <strong>and</strong> equipment<br />
are fixed. In the long run, technology is constant but<br />
firms can change their plant sizes <strong>and</strong> are free to enter or<br />
exit industries. In contrast, the very long run is a period<br />
in which technology can change <strong>and</strong> in which firms can<br />
develop <strong>and</strong> offer entirely new products.<br />
In Chapter 1 we saw that technological advance shifts<br />
an economy’s production possibilities curve outward,<br />
enabling the economy to obtain more goods <strong>and</strong> services.<br />
Technological advance is a three-step process of invention,<br />
innovation, <strong>and</strong> diffusion.<br />
Invention<br />
The basis of technological advance is invention : the discovery<br />
of a product or process through the use of imagination,<br />
ingenious thinking, <strong>and</strong> experimentation <strong>and</strong> the first proof<br />
that it will work. Invention is a process, <strong>and</strong> the result of the<br />
process is also called an invention. The prototypes (basic<br />
working models) of the telephone, the automobile, <strong>and</strong> the<br />
microchip are inventions. Invention usually is based on scientific<br />
knowledge <strong>and</strong> is the product of individuals, working<br />
either on their own or as members of corporate R&D staffs.<br />
Later on you will see how governments encourage invention<br />
by providing the inventor with a patent , an exclusive<br />
right to sell any new <strong>and</strong> useful process, machine, or product<br />
for a set period of time. In 2006 the top 10 firms that<br />
secured the most U.S. patents were IBM (3621), Samsung<br />
(2451), Canon (2366), Matsushita (2229), Hewlet-Packard<br />
(2099), Intel (1959), Sony (1771), Hitachi (1732), Toshiba<br />
(1672), <strong>and</strong> Micron <strong>Technology</strong> (1610). Numbers like these,<br />
of course, do not reveal the quality of the patents received;<br />
some patents are much more significant than other patents.<br />
Patents have a worldwide duration of 20 years from the time<br />
of application for the patent.<br />
Innovation<br />
Innovation draws directly on invention. While invention is<br />
the “discovery <strong>and</strong> first proof of workability,” innovation<br />
is the first successful commercial introduction of a new product,<br />
the first use of a new method, or the creation of a new<br />
form of business enterprise. Innovation is of two types: product<br />
innovation , which refers to new <strong>and</strong> improved products<br />
or services; <strong>and</strong> process innovation , which refers to new<br />
<strong>and</strong> improved methods of production or distribution.<br />
Unlike inventions, innovations cannot be patented.<br />
Nevertheless, innovation is a major factor in competition,<br />
since it sometimes enables a firm to “leapfrog” competitors<br />
by rendering their products or processes obsolete.<br />
For example, personal computers coupled with software<br />
for word processing pushed some major typewriter manufacturers<br />
into obscurity. More recently, innovations in<br />
hardware retailing (large warehouse stores such as Home<br />
Depot) have threatened the existence of smaller, more<br />
traditional hardware stores.<br />
But innovation need not weaken or destroy existing<br />
firms. Aware that new products <strong>and</strong> processes may<br />
threaten their survival, existing firms have a powerful<br />
incentive to engage continuously in R&D of their own.<br />
Innovative products <strong>and</strong> processes often enable such firms<br />
to maintain or increase their profits. The introduction of<br />
disposable contact lenses by Johnson & Johnson, scientific<br />
calculators by Hewlett-Packard, <strong>and</strong> iPhones by Apple are<br />
good examples. Thus, innovation can either diminish or<br />
strengthen market power.<br />
Diffusion<br />
Diffusion is the spread of an innovation to other products or<br />
processes through imitation or copying. To take advantage<br />
of new profit opportunities or to slow the erosion of profit,<br />
both new <strong>and</strong> existing firms emulate the successful innovations<br />
of others. Alamo greatly increased its auto rentals by<br />
offering customers unlimited mileage, <strong>and</strong> Hertz, Avis, Budget,<br />
<strong>and</strong> others eventually followed. DaimlerChrysler profitably<br />
introduced a luxury version of its Jeep Gr<strong>and</strong> Cherokee;<br />
other manufacturers, including Acura, Mercedes, <strong>and</strong> Lexus,<br />
countered with luxury sport-utility vehicles of their own.<br />
11W-2
CHAPTER 11W<br />
<strong>Technology</strong>, R&D, <strong>and</strong> Effi ciency 11W-3<br />
In 1996 Palm introduced its Palm Pilot, a palm-size personal<br />
computer. Microsoft, H<strong>and</strong>spring, OmniSky, <strong>and</strong> other<br />
firms soon brought out similar products.<br />
Other recent examples: Early successful cholesterolreducing<br />
drugs (statins) such as Bristol-Myers Squibb’s<br />
Provochol were soon followed by chemically distinct but<br />
similar statins such as Merck’s Zocor <strong>and</strong> Pfizer’s Lipitor.<br />
Early video game consoles such as those by Atari eventually<br />
gave rise to more popular consoles by Nintendo (Wii), Sony<br />
(PlayStation), <strong>and</strong> Microsoft (Xbox). MySpace, Facebook,<br />
<strong>and</strong> LinkedIn mimicked the social networking innovation<br />
pioneered by Classmates.com.<br />
In each of these cases, other firms incorporated the<br />
new innovation into their own business <strong>and</strong> products<br />
through imitation, modification, <strong>and</strong> extension. The original<br />
innovation thus became commonplace <strong>and</strong> mainly of<br />
historical interest.<br />
Although not as dramatic as invention <strong>and</strong> innovation,<br />
diffusion is a critical element of technological change.<br />
R&D Expenditures<br />
As related to businesses , the term “research <strong>and</strong> development”<br />
is used loosely to include direct efforts toward invention,<br />
innovation, <strong>and</strong> diffusion. However, government also engages<br />
in R&D, particularly R&D having to do with national<br />
defense. In 2006 total U.S. R&D expenditures (business<br />
plus government) were $343 billion. Relative to GDP that<br />
amount was about 2.6 percent, which is a reasonable measure<br />
of the emphasis the U.S. economy puts on technological<br />
advance. As shown in Global Perspective 11W.1, this is a<br />
high percentage of GDP compared to several other nations.<br />
American businesses spent $242 billion on R&D in 2006.<br />
Figure 11W.1 shows how these R&D expenditures were<br />
allocated. Observe that U.S. firms collectively channeled<br />
74 percent of their R&D expenditures to “development”<br />
(innovation <strong>and</strong> imitation, the route to diffusion). They<br />
spent another 22 percent on applied research, or on pursuing<br />
invention. For reasons we will mention later, only 4 percent<br />
of business R&D expenditures went for basic research, the<br />
search for general scientific principles. Of course, industries,<br />
<strong>and</strong> firms within industries, vary greatly in the amount of<br />
emphasis they place on these three processes.<br />
Modern View of Technological<br />
Advance<br />
For decades most economists regarded technological advance<br />
as being external to the economy—a r<strong>and</strong>om outside<br />
force to which the economy adjusted. From time to time<br />
fortuitous advances in scientific <strong>and</strong> technological knowledge<br />
occurred, paving the way for major new products<br />
GLOBAL PERSPECTIVE 11W.1<br />
Total R&D Expenditures as a Percentage of GDP,<br />
Selected Nations<br />
Relative R&D spending varies among leading industrial nations.<br />
From a microeconomic perspective, R&D helps promote economic<br />
efficiency; from a macroeconomic perspective, R&D helps<br />
promote economic growth.<br />
FIGURE 11W.1 The composition of business<br />
R&D outlays in the United States, 2006. Firms<br />
channel the bulk of their R&D spending to innovation <strong>and</strong><br />
imitation, because both have direct commercial value; less<br />
to applied research, that is, invention; <strong>and</strong> a relatively small<br />
amount to basic scientific research.<br />
Basic<br />
research<br />
4%<br />
Sweden<br />
Japan<br />
United States<br />
Germany<br />
France<br />
Canada<br />
United Kingdom<br />
Italy<br />
Russia<br />
Total R&D Expenditures<br />
as Percentage of GDP, 2006<br />
0 1 2 3 4 5<br />
Source: National Science Foundation, www.nsf.gov, <strong>and</strong> Organization for Economic<br />
Cooperation <strong>and</strong> Development, www.oecd.org.<br />
(automobiles, airplanes) <strong>and</strong> new production processes<br />
(assembly lines). Firms <strong>and</strong> industries, each at its own pace,<br />
then incorporated the new technology into their products<br />
Applied<br />
research<br />
(invention)<br />
22%<br />
Development<br />
(innovation <strong>and</strong><br />
imitation)<br />
74%<br />
Source: National Science Foundation, www.nsf.gov.
11W-4<br />
PART TWO<br />
Microeconomics of Product Markets<br />
or processes to enhance or maintain their profit. After making<br />
the appropriate adjustments, they settled back into new<br />
long-run equilibrium positions. Although technological<br />
advance has been vitally important to the economy, economists<br />
believed it was rooted in the independent advance of<br />
science, which is largely external to the market system.<br />
Most contemporary economists have a different view.<br />
They see capitalism itself as the driving force of technological<br />
advance. Invention, innovation, <strong>and</strong> diffusion occur in<br />
response to incentives within the economy, meaning that<br />
technological advance is internal to capitalism. Specifically,<br />
technological advance arises from intense rivalry among<br />
individuals <strong>and</strong> firms that motivates them to seek <strong>and</strong> exploit<br />
new profit opportunities or to exp<strong>and</strong> existing opportunities.<br />
That rivalry occurs both among existing firms <strong>and</strong><br />
between existing firms <strong>and</strong> new firms. Moreover, many<br />
advances in “pure” scientific knowledge are motivated, at<br />
least in part, by the prospect of commercial applicability<br />
<strong>and</strong> eventual profit. In the modern view, entrepreneurs <strong>and</strong><br />
other innovators are at the heart of technological advance.<br />
Role of Entrepreneurs <strong>and</strong><br />
Other Innovators<br />
It will be helpful to distinguish between “entrepreneurs”<br />
<strong>and</strong> “other innovators”:<br />
• Entrepreneurs Recall that the entrepreneur is an<br />
initiator, innovator, <strong>and</strong> risk bearer—the resource<br />
that combines l<strong>and</strong>, labor, <strong>and</strong> capital resources in<br />
new <strong>and</strong> unique ways to produce new goods <strong>and</strong> services.<br />
In the past a single individual, for example,<br />
Andrew Carnegie in steel, Henry Ford in automobiles,<br />
or Levi Strauss in blue jeans, carried out the entrepreneurial<br />
role. Such advances as air conditioning,<br />
the ballpoint pen, cellophane, the jet engine, insulin,<br />
xerography, <strong>and</strong> the helicopter all have an individualistic<br />
heritage. But in today’s more technologically<br />
complex economy, entrepreneurship is just as likely<br />
to be carried out by entrepreneurial teams. Such<br />
teams may include only two or three people working<br />
“as their own bosses” on some new product idea or it<br />
may consist of larger groups of entrepreneurs who<br />
have pooled their financial resources.<br />
• Other innovators This designation includes other<br />
key people involved in the pursuit of innovation who<br />
do not bear personal financial risk. Among them are<br />
key executives, scientists, <strong>and</strong> other salaried<br />
employees engaged in commercial R&D activities.<br />
(They are sometimes referred to as intrapreneurs<br />
since they provide the spirit of entrepreneurship<br />
within existing firms.)<br />
Forming Start-Ups<br />
Entrepreneurs often form small new companies called startups<br />
that focus on creating <strong>and</strong> introducing a new product or<br />
employing a new production or distribution technique. Two<br />
people, working out of their garages, formed such a start-up<br />
in the mid-1970s. Since neither of their employers—Hewlett-<br />
Packard <strong>and</strong> Atari, the developer of Pong (the first video<br />
game)—was interested in their prototype personal computer,<br />
they founded their own computer company: Apple.<br />
Other examples of successful start-ups are Amgen, a biotechnology<br />
firm specializing in new medical treatments;<br />
Starbucks, a seller of gourmet coffee; Amazon, an Internet<br />
retailer; <strong>and</strong> Google, an Internet search provider.<br />
Innovating within Existing Firms<br />
Innovators are also at work within existing corporations, large<br />
<strong>and</strong> small. Such innovators are salaried workers, although<br />
many firms have pay systems that provide them with substantial<br />
bonuses or profit shares. Examples of firms known<br />
for their skillful internal innovators are 3M Corporation,<br />
the U.S. developer of Scotch tape, Post-it Note Pads, <strong>and</strong><br />
Thinsulate insulation; <strong>and</strong> General Electric, the developer<br />
of innovative major kitchen appliances, medical imaging machines,<br />
<strong>and</strong> jet aircraft engines. R&D work in major corporations<br />
has produced significant technological improvements in<br />
such products as television sets, telephones, home appliances,<br />
automobiles, automobile tires, <strong>and</strong> sporting equipment.<br />
Some large firms, aware that excessive bureaucracy can<br />
stifle creative thinking <strong>and</strong> technological advance, have separated<br />
part of their R&D <strong>and</strong> manufacturing divisions to<br />
form new, more flexible, innovative firms. Three significant<br />
examples of such “spin-off firms” are Lucent Technologies,<br />
a telephone equipment <strong>and</strong> R&D firm created by AT&T;<br />
Imation, a high-technology firm spun off by the 3M<br />
Corporation; <strong>and</strong> Yum Br<strong>and</strong>s, which operates restaurant<br />
chains Taco Bell, KFC, <strong>and</strong> Pizza Hut, spun off from Pepsi.<br />
Anticipating the Future<br />
About a half-century ago a writer for Popular Mechanics<br />
magazine boldly predicted, “Computers in the future may<br />
weigh no more than 1.5 tons.” Today’s notebook computers<br />
weigh less than 3 pounds.<br />
Anticipating the future is difficult, but that is what<br />
innovators try to do. Those with strong anticipatory ability<br />
<strong>and</strong> determination have a knack for introducing new <strong>and</strong><br />
improved products or services at just the right time.<br />
The rewards for success are both monetary <strong>and</strong> nonmonetary.<br />
Product innovation <strong>and</strong> development are creative<br />
endeavors, with such intangible rewards as personal<br />
satisfaction. Also, many people simply enjoy participating<br />
in the competitive “contest.” Of course, the “winners” can
CHAPTER 11W<br />
<strong>Technology</strong>, R&D, <strong>and</strong> Effi ciency 11W-5<br />
reap huge monetary rewards in the form of economic profits,<br />
stock appreciation, or large bonuses. Extreme examples<br />
are Bill Gates <strong>and</strong> Paul Allen, who founded Microsoft in<br />
1975, <strong>and</strong> had a net worth in 2007 of $56 billion <strong>and</strong> $18<br />
billion, respectively, mainly in the form of Microsoft stock.<br />
Past successes often give entrepreneurs <strong>and</strong> innovative<br />
firms access to resources for further innovations that anticipate<br />
consumer wants. Although they may not succeed a<br />
second time, the market tends to entrust the production of<br />
goods <strong>and</strong> services to businesses that have consistently succeeded<br />
in filling consumer wants. And the market does not<br />
care whether these “winning” entrepreneurs <strong>and</strong> innovative<br />
firms are American, Brazilian, Japanese, German, or Swiss.<br />
Entrepreneurship <strong>and</strong> innovation are global in scope.<br />
QUICK REVIEW 11W.1<br />
• Broadly defined, technological advance means new or<br />
improved products <strong>and</strong> services <strong>and</strong> new or improved<br />
production <strong>and</strong> distribution processes.<br />
• Invention is the discovery of a new product or method;<br />
innovation is the successful commercial application of some<br />
invention; <strong>and</strong> diffusion is the widespread adoption of the<br />
innovation.<br />
• Many economists view technological advance as mainly a<br />
response to profit opportunities arising within a capitalist<br />
economy.<br />
• Technological advance is fostered by entrepreneurs <strong>and</strong><br />
other innovators <strong>and</strong> is supported by the scientific research<br />
of universities <strong>and</strong> government-sponsored laboratories.<br />
Exploiting University <strong>and</strong><br />
Government Scientific Research<br />
In Figure 11W.1 we saw that only 4 percent of business<br />
R&D spending in the United States goes to basic scientific<br />
research. The reason the percentage is so small is that<br />
scientific principles, as such, cannot be patented, nor do<br />
they usually have immediate commercial uses. Yet new<br />
scientific knowledge is highly important to technological<br />
advance. For that reason, entrepreneurs study the scientific<br />
output of university <strong>and</strong> government laboratories to<br />
identify discoveries with commercial applicability.<br />
Government <strong>and</strong> university labs have been the scene<br />
of many technological breakthroughs, including hybrid<br />
seed corn, nuclear energy, satellite communications, the<br />
computer “mouse,” genetic engineering, <strong>and</strong> the Internet.<br />
Entire high-tech industries such as computers <strong>and</strong> biotechnology<br />
have their roots in major research universities <strong>and</strong><br />
government laboratories. And nations with strong scientific<br />
communities tend to have the most technologically<br />
progressive firms <strong>and</strong> industries.<br />
Also, firms increasingly help fund university research<br />
that relates to their products. Business funding of R&D<br />
at universities has grown rapidly, rising to more than<br />
$2.4 billion in 2006. Today, the separation between university<br />
scientists <strong>and</strong> innovators is narrowing; scientists <strong>and</strong><br />
universities increasingly realize that their work may have<br />
commercial value <strong>and</strong> are teaming up with innovators to<br />
share in the potential profit.<br />
A few firms, of course, find it profitable to conduct<br />
basic scientific research on their own. New scientific<br />
knowledge can give them a head start in creating an invention<br />
or a new product. This is particularly true in the pharmaceutical<br />
industry, where it is not uncommon for firms<br />
to parlay new scientific knowledge generated in their corporate<br />
labs into new, patentable drugs.<br />
A Firm’s Optimal Amount<br />
of R&D<br />
How does a firm decide on its optimal amount of research<br />
<strong>and</strong> development That amount depends on the firm’s perception<br />
of the marginal benefit <strong>and</strong> marginal cost of R&D<br />
activity. The decision rule here flows from basic economics:<br />
To earn the greatest profit, exp<strong>and</strong> a particular activity<br />
until its marginal benefit (MB) equals its marginal cost<br />
(MC). A firm that sees the marginal benefit of a particular<br />
R&D activity, say, innovation, as exceeding the marginal<br />
cost should exp<strong>and</strong> that activity. In contrast, an activity<br />
whose marginal benefit promises to be less than its marginal<br />
cost should be cut back. But the R&D spending decision<br />
is complex since it involves a present sacrifice for a<br />
future expected gain. While the cost of R&D is immediate,<br />
the expected benefits occur at some future time <strong>and</strong><br />
are highly uncertain. So estimating those benefits is often<br />
more art than science. Nevertheless, the MB MC way of<br />
thinking remains relevant for analyzing R&D decisions.<br />
Interest-Rate Cost of Funds<br />
Firms have several ways of obtaining the funds they need<br />
to finance R&D activities:<br />
• Bank loans Some firms are able to obtain a loan<br />
from a bank or other financial institution. Then the<br />
cost of using the funds is the interest paid to the<br />
lender. The marginal cost is the cost per extra dollar<br />
borrowed, which is simply the market interest rate<br />
for borrowed funds.<br />
• Bonds Established, profitable firms may be able to<br />
borrow funds for R&D by issuing bonds <strong>and</strong> selling<br />
them in the bond market. In this case, the cost is the
11W-6<br />
PART TWO<br />
Microeconomics of Product Markets<br />
interest paid to the lenders—the bondholders.<br />
Again the marginal cost of using the funds is the<br />
interest rate. (We discussed corporate bonds in<br />
Chapter 4.)<br />
• Retained earnings A large, well-established firm<br />
may be able to draw on its own corporate savings to<br />
finance R&D. Typically, such a firm retains part of its<br />
profit rather than paying it all out as dividends to<br />
corporate owners. Some of the undistributed corporate<br />
profit, called retained earnings, can be used to<br />
finance R&D activity. The marginal cost of using retained<br />
earnings for R&D is an opportunity cost—the<br />
rate of interest that those funds could have earned as<br />
deposits in a financial institution.<br />
• Venture capital A smaller start-up firm might be able<br />
to attract venture capital to finance its R&D projects.<br />
Venture capital is financial capital, or simply money,<br />
not real capital. Venture capital consists of that part<br />
of household saving used to finance high-risk business<br />
ventures in exchange for shares of the profit if<br />
the ventures succeed. The marginal cost of venture<br />
capital is the share of expected profit that the firm<br />
will have to pay to those who provided the money.<br />
This can be stated as a percentage of the venture<br />
capital, so it is essentially an interest rate.<br />
• Personal savings Finally, individual entrepreneurs<br />
might draw on their own savings to finance the R&D<br />
for a new venture. The marginal cost of the financing<br />
is again the forgone interest rate.<br />
Thus, whatever the source of the R&D funds, we can state<br />
the marginal cost of these funds as an interest rate i . For<br />
simplicity, let’s assume that this interest rate is the same no<br />
matter how much financing is required. Further, we assume<br />
that a certain firm called MedTech must pay an interest rate<br />
of 8 percent for the least expensive funding available to it.<br />
Then a graph of the marginal cost of each funding amount<br />
for this firm is a horizontal line at the 8 percent interest<br />
rate, as shown in Figure 11W.2 . Such a graph is called an<br />
interest-rate cost-of-funds curve . This one tells us that<br />
MedTech can borrow $10, $10,000, $10,000,000, or more<br />
at the 8 percent interest rate. The table accompanying the<br />
graph contains the data used to construct the graph <strong>and</strong><br />
tells us much the same thing.<br />
With these data in h<strong>and</strong>, MedTech wants to determine<br />
how much R&D to finance in the coming year.<br />
Expected Rate of Return<br />
A firm’s marginal benefit from R&D is its expected profit<br />
(or return) from the last (marginal) dollar spent on R&D.<br />
That is, the R&D is expected to result in a new product or<br />
FIGURE 11W.2 The interest-rate cost-of-funds<br />
schedule <strong>and</strong> curve. As it relates to R&D, a firm’s interest-rate<br />
cost-of-funds schedule (the table) <strong>and</strong> curve (the graph) show the interest<br />
rate the firm must pay to obtain any particular amount of funds to finance<br />
R&D. Curve i indicates the firm can finance as little or as much R&D as it<br />
wants at a constant 8 percent rate of interest.<br />
Interest rate, i (percent)<br />
20<br />
16<br />
12<br />
8<br />
4<br />
Interest-rate cost-of-funds<br />
curve<br />
0 20 40 60 80 100<br />
Research <strong>and</strong> development expenditures<br />
(millions of dollars)<br />
R&D,<br />
Millions Interest-Rate Cost of Funds, %<br />
$10 8<br />
20 8<br />
30 8<br />
40 8<br />
50 8<br />
60 8<br />
70 8<br />
80 8<br />
production method that will increase revenue, reduce<br />
production costs, or both (in ways we will soon explain).<br />
This return is expected, not certain—there is risk in<br />
R&D decisions. Let’s suppose that after considering<br />
such risks, MedTech anticipates that an R&D expenditure<br />
of $1 million will result in a new product that will<br />
yield a one-time added profit of $1.2 million a year later.<br />
The expected rate of return r on the $1 million R&D<br />
expenditure (after the $1 million has been repaid) is 20 percent<br />
( $200,000$1,000,000). This is the marginal benefit<br />
of the first $1 million of R&D. (Stretching the return over<br />
several years complicates the computation of r, but it does<br />
not alter the basic analysis. We discuss this “present-value<br />
complication” in Chapter 15.)<br />
i
CHAPTER 11W<br />
<strong>Technology</strong>, R&D, <strong>and</strong> Effi ciency 11W-7<br />
FIGURE 11W.3 The expected-rate-of-return schedule<br />
<strong>and</strong> curve. As they relate to R&D, a firm’s expected-rate-of-return<br />
schedule (the table) <strong>and</strong> curve (the graph) show the firm’s expected<br />
gain in profit, as a percentage of R&D spending, for each level of R&D<br />
spending. Curve r slopes downward because the firm assesses its<br />
potential R&D projects in descending order of expected rates of return.<br />
20<br />
FIGURE 11W.4 A firm’s optimal level of R&D<br />
expenditures. The firm’s optimal level of R&D expenditures ($60 million)<br />
occurs where its expected rate of return equals the interest-rate cost of funds,<br />
as shown in both the table <strong>and</strong> the graph. At $60 million of R&D spending,<br />
the firm has taken advantage of all R&D opportunities for which the expected<br />
rate of return, r, exceeds or equals the 8 percent interest cost of borrowing, i.<br />
20<br />
Expected rate of return, r (percent)<br />
16<br />
12<br />
8<br />
4<br />
Expected-rate-ofreturn<br />
curve<br />
r<br />
Expected rate of return, r, <strong>and</strong><br />
interest rate, i (percent)<br />
16<br />
12<br />
8<br />
4<br />
r = i<br />
r<br />
i<br />
0 20 40 60 80 100<br />
Research <strong>and</strong> development expenditures<br />
(millions of dollars)<br />
0 20 40 60 80 100<br />
Research <strong>and</strong> development expenditures<br />
(millions of dollars)<br />
R&D,<br />
Millions Expected Rate of Return, %<br />
$10 18<br />
20 16<br />
30 14<br />
40 12<br />
50 10<br />
60 8<br />
70 6<br />
80 4<br />
Expected R&D, Interest-Rate Cost<br />
Rate of Return, % Millions of Funds, %<br />
18 $10 8<br />
16 20 8<br />
14 30 8<br />
12 40 8<br />
10 50 8<br />
8 60 8<br />
6 70 8<br />
4 80 8<br />
MedTech can use this same method to estimate the<br />
expected rates of return for R&D expenditures of $2<br />
million, $3 million, $4 million, <strong>and</strong> so on. Suppose those<br />
marginal rates of return are the ones indicated in the table in<br />
Figure 11W.3 , where they are also graphed as the expectedrate-of-return<br />
curve . This curve shows the expected rate<br />
of return, which is the marginal benefit of each dollar of<br />
expenditure on R&D. The curve slopes downward because<br />
of diminishing returns to R&D expenditures. A firm will<br />
direct its initial R&D expenditures to the highest expectedrate-of-return<br />
activities <strong>and</strong> then use additional funding for<br />
activities with successively lower expected rates of return.<br />
That is, the firm will experience lower <strong>and</strong> lower expected<br />
rates of return as it exp<strong>and</strong>s its R&D spending.<br />
Optimal R&D Expenditures<br />
Figure 11W.4 combines the interest-rate cost-of-funds<br />
curve ( Figure 11W.2 ) <strong>and</strong> the expected-rate-of-return curve<br />
( Figure 11W.3 ). The curves intersect at MedTech’s optimal<br />
amount of R&D, which is $60 million. This amount can<br />
also be determined from the table as the amount of funding<br />
for which the expected rate of return <strong>and</strong> the interest cost of<br />
borrowing are equal (here, 8 percent).<br />
Both the curve <strong>and</strong> the table in Figure 11W.4 tell us<br />
that at $60 million of R&D expenditures, the marginal benefit<br />
<strong>and</strong> marginal cost of the last dollar spent on R&D are<br />
equal. MedTech should undertake all R&D expenditures up<br />
to $60 million since those outlays yield a higher marginal<br />
benefit or expected rate of return, r , than the 8 percent
11W-8<br />
PART TWO<br />
Microeconomics of Product Markets<br />
WORKED PROBLEMS<br />
marginal cost or interestrate<br />
cost of borrowing, i .<br />
W 11W.1<br />
But it should not undertake<br />
R&D expendi-<br />
Optimal R&D expenditures<br />
tures beyond $60 million;<br />
for these outlays, r (marginal benefit) is less than i (marginal<br />
cost). Only at $60 million do we have r i , telling<br />
us that MedTech will spend $60 million on R&D.<br />
Our analysis reinforces three important points:<br />
• Optimal versus affordable R&D From earlier<br />
discussions we know there can be too much, as well<br />
as too little, of a “good thing.” So it is with R&D<br />
<strong>and</strong> technological advance. Figure 11W.4 shows that<br />
R&D expenditures make sense to a firm only as long<br />
as the expected return from the outlay equals or<br />
exceeds the cost of obtaining the funds needed to<br />
finance it. Many R&D expenditures may be affordable<br />
but not worthwhile because their marginal<br />
benefit is likely to be less than their marginal cost.<br />
• Expected, not guaranteed, returns The outcomes<br />
from R&D are expected, not guaranteed. With 20-20<br />
hindsight, a firm can always look back <strong>and</strong> decide<br />
whether a particular expenditure for R&D was<br />
worthwhile. But that assessment is irrelevant to<br />
the original decision. At the time of the decision, the<br />
expenditure was thought to be worthwhile on the<br />
basis of existing information <strong>and</strong> expectations. Some<br />
R&D decisions may be more like an informed gamble<br />
than the typical business decision. Invention <strong>and</strong><br />
innovation, in particular, carry with them a great deal<br />
of risk. For every successful outcome, there are<br />
scores of costly disappointments.<br />
• Adjustments Firms adjust their R&D expenditures<br />
when expected rates of return on various projects<br />
change (when curves such as r in Figure 11W.4 shift).<br />
The U.S. war on terrorism, for example, increased the<br />
expected rate of return on R&D for improved security<br />
devices used at airports, train stations, harbors, <strong>and</strong><br />
other public places. It also increased the expected<br />
return on new methods of detecting <strong>and</strong> responding to<br />
potential bioterrorism. The revised realities prompted<br />
many firms to increase their R&D expenditures for<br />
these purposes. (Key Questions 4 <strong>and</strong> 5)<br />
Increased Profit via Innovation<br />
In discussing how a firm determines its optimal amount<br />
of R&D spending, we sidestepped the question of<br />
how technological change can increase a firm’s profit.<br />
Although the answer may seem obvious—by increasing<br />
revenue or reducing production costs—insights can<br />
be gained by exploring these two potential outcomes in<br />
some detail.<br />
Increased Revenue via<br />
Product Innovation<br />
Firms here <strong>and</strong> abroad have profitably introduced hundreds<br />
of new products in the past two or three decades. Examples<br />
include roller blades, microwave popcorn, cordless drills,<br />
digital cameras, camcorders, <strong>and</strong> high- definition TVs.<br />
Other new products are snowboards, cellular phones, MP3<br />
players, <strong>and</strong> automobile air bags. All these items reflect<br />
technological advance in the form of product innovation.<br />
How do such new products gain consumer acceptance<br />
As you know from Chapter 7, to maximize their satisfaction,<br />
consumers purchase products that have the highest<br />
marginal utility per dollar. They determine which products<br />
to buy in view of their limited money incomes by comparing<br />
the ratios of MU/price for the various goods. They first<br />
select the unit of the good with the highest MU/price ratio,<br />
then the one with the next highest, <strong>and</strong> so on, until their<br />
incomes are used up.<br />
The first five columns of Table 11W.1 repeat some of<br />
the information in Table 7.1. Before the introduction of new<br />
product C, the consumer maximized the total utility she<br />
could get from $10 of income by buying 2 units of A at $1 per<br />
unit <strong>and</strong> 4 units of B at $2 per unit. The total $10 budget was<br />
thus expended, with $2 spent on A <strong>and</strong> $8 on B. As shown in<br />
columns 2b <strong>and</strong> 3b, the marginal utility per dollar spent on<br />
the last unit of each product was 8 ( 8$1 16$2). The<br />
total utility, derived from columns 2a <strong>and</strong> 3a, was 96 utils<br />
( 10 8 from the first 2 units of A plus 24 20 18 16<br />
from the first 4 units of B). (If you are uncertain about this<br />
outcome, please review the discussion of Table 7.1.)<br />
Now suppose an innovative firm offers new product C<br />
(columns 4a <strong>and</strong> 4b in Table 11W.1 ), priced at $4 per unit.<br />
Note that the first unit of C has a higher marginal utility<br />
per dollar (13) than any unit of A <strong>and</strong> B <strong>and</strong> that the second<br />
unit of C <strong>and</strong> the first unit of B have equal MU/price ratios<br />
of 12. To maximize satisfaction, the consumer now buys<br />
2 units of C at $4 per unit, 1 unit of B at $2 per unit, <strong>and</strong><br />
zero units of A. Our consumer has spent the entire $10 of<br />
income ($8 on C <strong>and</strong> $2 on B), <strong>and</strong> the MU/price ratios of<br />
the last units of B <strong>and</strong> C are equal at 12. But as determined<br />
via columns 3a <strong>and</strong> 4a, the consumer’s total utility is now 124<br />
utils ( 24 from the first unit of B plus 52 48 from the first<br />
2 units of C).<br />
Total utility has increased by 28 utils ( 124 utils 96<br />
utils), <strong>and</strong> that is why product C was purchased. Consumers<br />
will buy a new product only if it increases the total utility<br />
they obtain from their limited incomes.
CHAPTER 11W<br />
<strong>Technology</strong>, R&D, <strong>and</strong> Effi ciency 11W-9<br />
TABLE 11W.1 Utility Maximization with the Introduction of a New Product (Income $10)*<br />
(2) (3) (4)<br />
Product A: Price $1 Product B: Price $2 New Product C: Price $4<br />
(b) (b) (b)<br />
(1) (a) Marginal Utility (a) Marginal Utility (a) Marginal Utility<br />
Unit of Marginal per Dollar Marginal per Dollar Marginal per Dollar<br />
Product Utility, Utils (MU/Price) Utility, Utils (MU/Price) Utility, Utils (MU/Price)<br />
First 10 10 24 12 52 13<br />
Second 8 8 20 10 48 12<br />
Third 7 7 18 9 44 11<br />
Fourth 6 6 16 8 36 9<br />
Fifth 5 5 12 6 32 8<br />
*It is assumed in this table that the amount of marginal utility received from additional units of each of the three products is independent of the quantity purchased of the other<br />
products. For example, the marginal-utility schedule for product C is independent of the amount of A <strong>and</strong> B purchased by the consumer.<br />
From the innovating firm’s perspective, these “dollar<br />
votes” represent new product dem<strong>and</strong> that yields increased<br />
revenue. When per-unit revenue exceeds per-unit cost, the<br />
product innovation creates per-unit profit. Total profit rises<br />
by the per-unit profit multiplied by the number of units<br />
sold. As a percentage of the original R&D expenditure, the<br />
rise in total profit is the return on that R&D expenditure.<br />
It was the basis for the expected-rate-of-return curve r in<br />
Figure 11W.4 .<br />
Other related points:<br />
• Importance of price Consumer acceptance of a new<br />
product depends on both its marginal utility <strong>and</strong> its<br />
price. (Confirm that the consumer represented in<br />
Table 11W.1 would buy zero units of new product C<br />
if its price were $8 rather than $4.) To be successful,<br />
a new product must not only deliver utility to<br />
consumers but do so at an acceptable price.<br />
• Unsuccessful new products For every successful new<br />
product, hundreds do not succeed; the expected return<br />
that motivates product innovation is not always realized.<br />
Examples of colossal product flops are Ford’s Edsel<br />
automobile, quadraphonic stereo, New Coke by Coca-<br />
Cola, Kodak disc cameras, <strong>and</strong> XFL football. Less dramatic<br />
failures include the hundreds of “dot-com” firms<br />
that have gone out of business in the last decade. In<br />
each case, millions of dollars of R&D <strong>and</strong> promotion<br />
expense ultimately resulted in loss, not profit.<br />
• Product improvements Most product innovation<br />
consists of incremental improvements to existing<br />
products rather than radical inventions. Examples:<br />
more fuel-efficient automobile engines, new varieties<br />
of pizza, lighter-weight shafts for golf clubs, more<br />
flavorful bubble-gum, “rock shocks” for mountain<br />
bikes, <strong>and</strong> clothing made of wrinkle-free fabrics.<br />
(Key Question 6)<br />
Reduced Cost via Process Innovation<br />
The introduction of better methods of producing<br />
products—process innovation—is also a path toward<br />
enhanced profit <strong>and</strong> a positive return on R&D expenditures.<br />
Suppose a firm introduces a new <strong>and</strong> better production<br />
process, say, assembling its product by teams rather than<br />
by a st<strong>and</strong>ard assembly line. Alternatively, suppose this firm<br />
replaces old equipment with more productive equipment<br />
embodying technological advance. In either case, the innovation<br />
yields an upward shift in the firm’s total-product<br />
curve from TP 1 to TP 2 in Figure 11W.5 a. Now more<br />
units of output can be produced at each level of resource<br />
usage. Note from the figure, for example, that this firm can<br />
now produce 2500 units of output, rather than 2000 units,<br />
when using 1000 units of labor. So its average product has<br />
increased from 2 ( 2000 units of output1000 units of<br />
labor) to 2.5 ( 2500 units of output1000 units of labor).<br />
The result is a downward shift in the firm’s averagetotal-cost<br />
curve, from ATC 1 to ATC 2 in Figure 11W.5b.<br />
To underst<strong>and</strong> why, let’s assume this firm pays $1000<br />
for the use of its capital <strong>and</strong> $9 for each unit of labor.<br />
Since it uses 1000 units of labor, its labor cost is $9000<br />
( $9 1000); its capital cost is $1000; <strong>and</strong> thus its total<br />
cost is $10,000. When its output increases from 2000 to<br />
2500 units as a result of the process innovation, its total<br />
cost remains $10,000. So its average total cost declines<br />
from $5 ( $10,0002000) to $4 ( $10,0002500).<br />
Alternatively, the firm could produce the original 2000<br />
units of output with fewer units of labor at an even lower<br />
average total cost.<br />
This reduction in average total cost enhances the<br />
firm’s profit. As a percentage of the R&D expenditure<br />
that fostered it, this extra profit is the expected return r ,<br />
the basis for the rate-of-return curve in Figure 11W.3.<br />
In this case, the expected rate of return arose from the
11W-10<br />
PART TWO<br />
Microeconomics of Product Markets<br />
FIGURE 11W.5 Process innovation, total product, <strong>and</strong> average total cost. (a) Process innovation shifts a firm’s totalproduct<br />
curve upward from TP 1 to TP 2 , meaning that with a given amount of capital the firm can produce more output at each level of labor<br />
input. As shown, with 1000 units of labor it can produce 2500 rather than 2000 units of output. (b) The upward shift in the total-product curve<br />
results in a downward shift in the firm’s average-total-cost curve, from ATC 1 to ATC 2 . This means the firm can produce any particular unit of<br />
output at a lower average total cost than it could previously. For example, the original 2000 units can be produced at less than $4 per unit, versus<br />
$5 per unit originally. Or 2500 units can now be produced at $4 per unit.<br />
Total product<br />
2500<br />
2000<br />
TP 2<br />
TP 1<br />
Average total cost<br />
$5<br />
4<br />
ATC 1<br />
ATC 2<br />
0<br />
1000<br />
Units of labor<br />
(a)<br />
Upward shift of the total-product curve<br />
0<br />
2000 2500<br />
Units of output<br />
(b)<br />
Downward shift of the<br />
average-total-cost curve<br />
WORKED PROBLEMS<br />
prospect of lower production<br />
costs through<br />
W 11W.2<br />
process innovation.<br />
Process innovation<br />
Example: Computerbased<br />
inventory control<br />
systems, such as those pioneered by Wal-Mart, enabled innovators<br />
to reduce the number of people keeping track of<br />
inventories <strong>and</strong> placing reorders of sold goods. They also<br />
enabled firms to keep goods arriving “just in time,” reducing<br />
the cost of storing inventories. The consequence Significant<br />
increases in sales per worker, declines in average<br />
total cost, <strong>and</strong> increased profit. (Key Question 8)<br />
Imitation <strong>and</strong> R&D Incentives<br />
Our analysis of product <strong>and</strong> process innovation explains<br />
how technological advance enhances a firm’s profit.<br />
But it also hints at a potential imitation problem : A<br />
firm’s rivals may be able to imitate its new product or<br />
process, greatly reducing the originator’s profit from<br />
its R&D effort. As just one example, in the 1980s U.S.<br />
auto firms took apart Japanese Honda Accords, piece by<br />
piece, to discover the secrets of their high quality. This<br />
reverse engineering—which ironically was perfected<br />
earlier by the Japanese—helped the U.S. firms incorporate<br />
innovative features into their own cars. This type<br />
of imitation is perfectly legitimate <strong>and</strong> fully anticipated;<br />
it is often the main path to widespread diffusion of an<br />
innovation.<br />
In fact, a dominant firm that is making large profits from<br />
its existing products may let smaller firms in the industry<br />
incur the high costs of product innovation while it closely<br />
monitors their successes <strong>and</strong> failures. The dominant firm<br />
then moves quickly to imitate any successful new product;<br />
its goal is to become the second firm to embrace the innovation.<br />
In using this so-called fast-second strategy , the dominant<br />
firm counts on its own product-improvement abilities,<br />
marketing prowess, or economies of scale to prevail.<br />
Examples abound: Royal Crown introduced the first<br />
diet cola, but Diet Coke <strong>and</strong> Diet Pepsi dominate diet-cola<br />
sales today. Meister-Brau introduced the first low-calorie<br />
beer, but Miller popularized the product with its Miller<br />
Lite. Gillette moved quickly with its own stainless-steel<br />
razor blade only after a smaller firm, Wilkinson, introduced<br />
this product innovation. Creative <strong>Technology</strong> (the<br />
maker of Sound Blaster audio cards for personal computers)<br />
introduced the first miniature MP3 player, but Apple<br />
popularized the product with its iPod.<br />
Benefits of Being First<br />
Imitation <strong>and</strong> the fast-second strategy raise an important<br />
question: What incentive is there for any firm to bear the<br />
expenses <strong>and</strong> risks of innovation if competitors can imitate its<br />
new or improved product Why not let others bear the costs<br />
<strong>and</strong> risks of product development <strong>and</strong> then just imitate the<br />
successful innovations Although we have seen that this may<br />
be a plausible strategy in some situations, there are several<br />
protections for, <strong>and</strong> potential advantages to, taking the lead.
CHAPTER 11W<br />
<strong>Technology</strong>, R&D, <strong>and</strong> Effi ciency 11W-11<br />
Patents Some technological breakthroughs, specifically<br />
inventions, can be patented. Once patented, they cannot<br />
be legally imitated for two decades from time of patent application.<br />
The purpose of patents is, in fact, to reduce imitation<br />
<strong>and</strong> its negative effect on the incentive for engaging<br />
in R&D. Example: Polaroid’s patent of its instant camera<br />
enabled it to earn high economic profits for many years.<br />
When Kodak “cloned” the camera, Polaroid won a patentinfringement<br />
lawsuit against its rival. Kodak not only had<br />
to stop producing its version of the camera but had to buy<br />
back the Kodak instant cameras it had sold <strong>and</strong> pay millions<br />
of dollars in damages to Polaroid.<br />
There are hundreds of other examples of long-run profits<br />
based on U.S. patents; they involve products from prescription<br />
drugs to pop-top cans to weed trimmers. As shown<br />
in Global Perspective 11W.2, foreign citizens <strong>and</strong> firms hold<br />
U.S. patents along with American citizens <strong>and</strong> firms.<br />
Copyrights <strong>and</strong> Trademarks Copyrights protect<br />
publishers of books, computer software, movies, videos,<br />
<strong>and</strong> musical compositions from having their works<br />
copied. Trademarks give the original innovators of products<br />
the exclusive right to use a particular product name<br />
(“M&Ms,” “Barbie Doll,” “Wheaties”). By reducing the<br />
problem of direct copying, these legal protections increase<br />
the incentive for product innovation. They have been<br />
GLOBAL PERSPECTIVE 11W.2<br />
Distribution of U.S. Patents, by Foreign Nation<br />
Foreign citizens, corporations, <strong>and</strong> governments hold 41<br />
percent of U.S. patents. The top 10 foreign countries in terms<br />
of U.S. patent holdings since 1963 are listed below, with the<br />
number of U.S. patents (through 2006) in parentheses.<br />
Top 10 Foreign Countries<br />
Japan (658,827)<br />
Germany (295,110)<br />
U. K. (123,371)<br />
France (110,839)<br />
Canada (77,594)<br />
Taiwan (58,162)<br />
Switzerl<strong>and</strong> (52,201)<br />
South Korea (44,125)<br />
Italy (43,668)<br />
Sweden (38,456)<br />
Source: U.S. Patent <strong>and</strong> Trademark Offi ce, www.uspto.gov.<br />
strengthened worldwide through recent international<br />
trade agreements.<br />
Br<strong>and</strong>-Name Recognition Along with trademark<br />
protection, br<strong>and</strong>-name recognition may give the original<br />
innovator a major marketing advantage for years or even<br />
decades. Consumers often identify a new product with the<br />
firm that first introduced <strong>and</strong> popularized it in the mass<br />
market. Examples: Levi’s blue jeans, Kleenex soft tissues,<br />
Johnson <strong>and</strong> Johnson’s B<strong>and</strong>-Aids, Sony’s Walkman, <strong>and</strong><br />
Kellogg’s Corn Flakes.<br />
Trade Secrets <strong>and</strong> Learning by Doing Some<br />
innovations involve trade secrets, without which competitors<br />
cannot imitate the product or process. Example: Coca-Cola<br />
has successfully kept its formula for Coke a secret from<br />
potential rivals. Many other firms have perfected special<br />
production techniques known only to them. In a related<br />
advantage, a firm’s head start with a new product often allows<br />
it to achieve substantial cost reductions through learning by<br />
doing. The innovator’s lower cost may enable it to continue<br />
to profit even after imitators have entered the market.<br />
Time Lags Time lags between innovation <strong>and</strong> diffusion<br />
often enable innovating firms to realize a substantial<br />
economic profit. It takes time for an imitator to<br />
gain knowledge of the properties of a new innovation. And<br />
once it has that knowledge, the imitator must design a substitute<br />
product, gear up a factory for its production, <strong>and</strong><br />
conduct a marketing campaign. Various entry barriers, such<br />
as large financial requirements, economies of scale, <strong>and</strong><br />
price-cutting, may extend the time lag between innovation<br />
<strong>and</strong> imitation. In practice, it may take years or even decades<br />
before rival firms can successfully imitate a profitable new<br />
product <strong>and</strong> cut into the market share of the innovator. In<br />
the meantime, the innovator continues to profit.<br />
Profitable Buyouts A final advantage of being<br />
first arises from the possibility of a buyout (outright purchase)<br />
of the innovating firm by a larger firm. Here, the<br />
innovative entrepreneurs take their rewards immediately,<br />
as cash or as shares in the purchasing firm, rather than<br />
waiting for perhaps uncertain long-run profits from their<br />
own production <strong>and</strong> marketing efforts.<br />
Examples: Once the popularity of cellular communications<br />
became evident, AT&T bought out<br />
McCaw Communications, an early leader in this new<br />
technology. When Minnetonka’s Softsoap became a huge<br />
success, it sold its product to Colgate-Palmolive. More<br />
recently, Swiss conglomerate Nestlé bought out Chef<br />
America, the highly successful maker of Hot Pockets<br />
frozen meat-<strong>and</strong>-cheese s<strong>and</strong>wiches. Such buyouts are
11W-12<br />
PART TWO<br />
Microeconomics of Product Markets<br />
CONSIDER THIS . . .<br />
Trade Secrets<br />
Trade secrets have long played<br />
an important role in maintaining<br />
returns from research <strong>and</strong><br />
development (R&D). Long before<br />
Coca-Cola’s secret formula or<br />
Colonel S<strong>and</strong>ers’ secret herbs<br />
<strong>and</strong> spices, legend has it that the<br />
Roman citizen Erasmo (c. A. D.130)<br />
had a secret ingredient for violin<br />
strings.* As the dem<strong>and</strong> for his<br />
new product grew, he falsely<br />
identified his strings as catgut, when they were actually made<br />
of sheep intestines. Why the deception At the time, it was<br />
considered to be extremely bad luck to kill a cat. By identifying<br />
his strings as catgut, he hoped that nobody would imitate his<br />
product <strong>and</strong> reduce his monopoly profit. Moreover, his product<br />
name would help him preserve his valuable trade secret.<br />
*We found this anecdote in Dennis W. Carleton <strong>and</strong> Jeffrey Perloff,<br />
Modern Industrial Organization, 2d ed. (New York: HarperCollins, 1994),<br />
p. 139. Their source, in turn, was L. Boyd, San Francisco Chronicle, October<br />
27, 1984, p. 35.<br />
legal under current antitrust laws as long as they do not<br />
substantially lessen competition in the affected industry.<br />
For this to be the case, there must be other strong competitors<br />
in the market. That was not true, for example,<br />
when Microsoft tried to buy out Intuit (maker of Quicken,<br />
the best-selling financial software). That buyout was disallowed<br />
because Intuit <strong>and</strong> Microsoft were the two main<br />
suppliers of financial software for personal computers.<br />
In short, despite the imitation problem, significant<br />
protections <strong>and</strong> advantages enable most innovating firms to<br />
profit from their R&D efforts, as implied by the continuing<br />
high levels of R&D spending by firms year after year.<br />
As shown in Figure 11W.6 , business R&D spending in the<br />
United States not only remains substantial but has grown<br />
over the past quarter-century. The high levels of spending<br />
simply would not continue if imitation consistently <strong>and</strong><br />
severely depressed rates of return on R&D expenditures.<br />
QUICK REVIEW 11W.2<br />
• A firm’s optimal R&D expenditure is the amount at which<br />
the expected rate of return (marginal benefit) from the<br />
R&D expenditure just equals the interest-rate cost of borrowing<br />
(marginal cost) required to finance it.<br />
• Product innovation can entice consumers to substitute a new<br />
product for existing products to increase their total utility,<br />
thereby increasing the innovating firm’s revenue <strong>and</strong> profit.<br />
• Process innovation can lower a firm’s production costs <strong>and</strong><br />
increase its profit by increasing total product <strong>and</strong> decreasing<br />
average total cost.<br />
• A firm faces reduced profitability from R&D if competitors<br />
can successfully imitate its new product or process.<br />
Nevertheless, there are significant potential protections <strong>and</strong><br />
benefits to being first, including patents, copyrights, <strong>and</strong><br />
trademarks; br<strong>and</strong>-name recognition; trade secrets; cost<br />
reductions from learning by doing; <strong>and</strong> major time lags<br />
between innovation <strong>and</strong> imitation.<br />
Business R&D expenditures<br />
in the United States<br />
(billions of 2000 dollars)<br />
$225<br />
200<br />
175<br />
150<br />
125<br />
100<br />
75<br />
Business R&D<br />
expenditures<br />
FIGURE 11W.6 The growth of business R&D expenditures<br />
in the United States, 1980–2006. Inflation-adjusted R&D expenditures<br />
by firms are substantial <strong>and</strong> growing, suggesting that R&D continues to be<br />
profitable for firms, even in the face of possible imitation.<br />
50<br />
1980 1985 1990<br />
Source: National Science Foundation, www.nsf.gov.<br />
1995 2000 2005<br />
Year
Role of Market Structure<br />
In view of our discussion of market structures in the last<br />
three chapters, asking whether some particular market<br />
structure or firm size is best suited to technological<br />
progress is logical. Is a highly competitive industry<br />
consisting of thous<strong>and</strong>s of relatively small firms preferable<br />
to an industry comprising only two or three large firms<br />
Or is some intermediate structure best<br />
Market Structure <strong>and</strong><br />
Technological Advance<br />
As a first step toward answering these questions, we survey<br />
the strengths <strong>and</strong> shortcomings of our four market models<br />
as related to technological advance.<br />
Pure Competition Does a pure competitor have a<br />
strong incentive <strong>and</strong> strong ability to undertake R&D On<br />
the positive side, strong competition provides a reason for<br />
such firms to innovate; competitive firms tend to be less<br />
complacent than monopolists. If a pure competitor does not<br />
seize the initiative, one or more rivals may introduce a new<br />
product or cost-reducing production technique that could<br />
drive it from the market. As a matter of short-term profit<br />
<strong>and</strong> long-term survival, the pure competitor is under continual<br />
pressure to improve products <strong>and</strong> lower costs through<br />
innovation. Also, where there are many competing firms,<br />
there is less chance that an idea for improving a product or<br />
process will be overlooked by a single firm.<br />
On the negative side, the expected rate of return on<br />
R&D may be low or even negative for a pure competitor.<br />
Because of easy entry, its profit rewards from innovation<br />
may quickly be competed away by existing or entering firms<br />
that also produce the new product or adopt the new technology.<br />
Also, the small size of competitive firms <strong>and</strong> the fact<br />
that they earn only a normal profit in the long run lead to<br />
serious questions as to whether they can finance substantial<br />
R&D programs. Observers have noted that the high rate<br />
of technological advance in the purely competitive agricultural<br />
industry, for example, has come not from the R&D<br />
of individual farmers but from government-sponsored<br />
research <strong>and</strong> from the development of fertilizers, hybrid<br />
seed, <strong>and</strong> farm implements by oligopolistic firms.<br />
Monopolistic Competition Like pure competitors,<br />
monopolistic competitors cannot afford to be complacent.<br />
But unlike pure competitors, which sell st<strong>and</strong>ardized<br />
products, monopolistic competitors have a strong profit incentive<br />
to engage in product innovation. This incentive to<br />
differentiate products from those of competitors stems from<br />
the fact that sufficiently novel products may create monopoly<br />
CHAPTER 11W<br />
<strong>Technology</strong>, R&D, <strong>and</strong> Effi ciency 11W-13<br />
power <strong>and</strong> thus economic profit. There are many examples of<br />
innovative firms (McDonald’s, Blockbuster Video, Starbuck’s<br />
Coffee Company) that started out as monopolistic competitors<br />
in localized markets but soon gained considerable<br />
national market power, with the attendant economic profit.<br />
For the typical firm, however, the shortcomings of monopolistic<br />
competition in relation to technological advance<br />
are the same as those of pure competition. Most monopolistic<br />
competitors remain small, which limits their ability to secure<br />
inexpensive financing for R&D. In addition, monopolistic<br />
competitors find it difficult to extract large profits from<br />
technological advances. Any economic profits from innovation<br />
are usually temporary because entry to monopolistically<br />
competitive industries is relatively easy. In the long run, new<br />
entrants with similar goods reduce the dem<strong>and</strong> for the innovator’s<br />
product, leaving the innovator with only a normal<br />
profit. Monopolistic competitors therefore usually have relatively<br />
low expected rates of return on R&D expenditures.<br />
Oligopoly Many of the characteristics of oligopoly are<br />
conducive to technological advance. First, the large size of<br />
oligopolists enables them to finance the often large R&D<br />
costs associated with major product or process innovation.<br />
In particular, the typical oligopolist realizes an ongoing economic<br />
profit, a part of which is retained. This undistributed<br />
profit serves as a major source of readily available, relatively<br />
low-cost funding for R&D. Moreover, the existence of barriers<br />
to entry gives the oligopolist some assurance that it<br />
can maintain any economic profit it gains from innovation.<br />
Then, too, the large sales volume of the oligopolist enables it<br />
to spread the cost of specialized R&D equipment <strong>and</strong> teams<br />
of specialized researchers over a great many units of output.<br />
Finally, the broad scope of R&D activity within oligopolistic<br />
firms helps them offset the inevitable R&D “misses” with<br />
more-than-compensating R&D “hits.” Thus, oligopolists<br />
clearly have the means <strong>and</strong> incentive to innovate.<br />
But there is also a negative side to R&D in oligopoly. In<br />
many instances, the oligopolist’s incentive to innovate may<br />
be far less than we have implied above because oligopoly<br />
tends to breed complacency. An oligopolist may reason<br />
that introducing costly new technology <strong>and</strong> producing<br />
new products makes little sense when it currently is earning<br />
a sizable economic profit without them. The oligopolist<br />
wants to maximize its profit by exploiting fully all its capital<br />
assets. Why rush to develop a new product (say, batteries for<br />
electric automobiles) when that product’s success will render<br />
obsolete much of the firm’s current equipment designed to<br />
produce its existing product (say, gasoline engines) It is not<br />
difficult to cite oligopolistic industries in which the largest<br />
firms’ interest in R&D has been quite modest. Examples:<br />
the steel, cigarette, <strong>and</strong> aluminum industries.
11W-14<br />
PART TWO<br />
Microeconomics of Product Markets<br />
Pure Monopoly In general, the pure monopolist has<br />
little incentive to engage in R&D; it maintains its high profit<br />
through entry barriers that, in theory, are complete. The<br />
only incentive for the pure monopolist to engage in R&D is<br />
defensive: to reduce the risk of being blindsided by some new<br />
product or production process that destroys its monopoly. If<br />
such a product is out there to be discovered, the monopolist<br />
may have an incentive to find it. By so doing, it can either<br />
exploit the new product or process for continued monopoly<br />
profit or suppress the product until the monopolist has extracted<br />
the maximum profit from its current capital assets.<br />
But, in general, economists agree that pure monopoly is the<br />
market structure least conducive to innovation.<br />
Inverted-U Theory of R&D<br />
Analysis like this has led some experts on technological<br />
progress to postulate a so-called inverted-U theory of<br />
R&D, which deals with the relationship between market<br />
structure <strong>and</strong> technological advance. This theory is illustrated<br />
in Figure 11W.7 , which relates R&D spending as<br />
a percentage of a firm’s sales (vertical axis) to the industry’s<br />
four-firm concentration ratio (horizontal axis). The<br />
“inverted-U” shape of the curve suggests that R&D effort<br />
is at best weak in both very-low-concentration industries<br />
(pure competition) <strong>and</strong> very-high-concentration industries<br />
(pure monopoly). Starting from the lowest concentrations,<br />
R&D spending as a percentage of sales rises with<br />
concentration until a concentration ratio of 50 percent or<br />
so is reached, meaning that the four largest firms account<br />
for about one-half the total industry output. Beyond that,<br />
relative R&D spending decreases as concentration rises.<br />
FIGURE 11W.7 The inverted-U theory of R&D<br />
expenditures. The inverted-U theory suggests that R&D expenditures<br />
as a percentage of sales rise with industry concentration until the four-firm<br />
concentration ratio reaches about 50 percent. Further increases in industry<br />
concentration are associated with lower relative R&D expenditures.<br />
R&D expenditures as a<br />
percentage of sales<br />
More competition<br />
Less competition<br />
The logic of the inverted-U theory follows from our<br />
discussion. Firms in industries with very low concentration<br />
ratios are mainly competitive firms. They are small, <strong>and</strong> this<br />
makes it difficult for them to finance R&D. Moreover, entry<br />
to these industries is easy, making it difficult to sustain economic<br />
profit from innovations that are not supported by<br />
patents. As a result, firms in these industries spend little on<br />
R&D relative to their sales. At the other end (far right) of the<br />
curve, where concentration is exceptionally high, monopoly<br />
profit is already high <strong>and</strong> innovation will not add much more<br />
profit. Furthermore, innovation typically requires costly<br />
retooling of very large factories, which will cut into whatever<br />
additional profit is realized. As a result, the expected rate of<br />
return from R&D is quite low, as are expenditures for R&D<br />
relative to sales. Finally, the lack of rivals makes the monopolist<br />
quite complacent about R&D.<br />
The optimal industry structure for R&D is one in which<br />
expected returns on R&D spending are high <strong>and</strong> funds to<br />
finance it are readily available <strong>and</strong> inexpensive. From our<br />
discussion, those factors seem to occur in industries where<br />
a few firms are absolutely <strong>and</strong> relatively large but where<br />
the concentration ratio is not so high as to prohibit vigorous<br />
competition by smaller rivals. Rivalry among the larger<br />
oligopolistic firms <strong>and</strong> competition between the larger <strong>and</strong><br />
the smaller firms then provide a strong incentive for R&D.<br />
The inverted-U theory of R&D, as represented by Figure<br />
11W.7 , also points toward this “loose” oligopoly as the optimal<br />
structure for R&D spending.<br />
Market Structure <strong>and</strong> Technological<br />
Advance: The Evidence<br />
Various industry studies <strong>and</strong> cross-industry studies collectively<br />
support the inverted-U theory of R&D. 1 Other<br />
things equal, the optimal market structure for technological<br />
advance seems to be an industry in which there is a mix of<br />
large oligopolistic firms (a 40 to 60 percent concentration<br />
ratio), with several highly innovative smaller firms.<br />
But our “other-things-equal” qualification is quite<br />
important here. Whether or not a particular industry is<br />
highly technical may well be a more important determinant<br />
of R&D than its structure. While some concentrated<br />
industries (electronics, aircraft, <strong>and</strong> petroleum) devote large<br />
quantities of resources to R&D <strong>and</strong> are very innovative,<br />
others (cigarettes, aluminum, gypsum products) are not.<br />
The level of R&D spending within an industry seems to depend<br />
as much on its technical character <strong>and</strong> “technological<br />
0 25 50 75 100<br />
Concentration ratio (percent)<br />
1 One such recent study is that by Philippe Aghion et al., “Competition<br />
<strong>and</strong> Innovation: An Inverted-U Relationship,” Quarterly Journal of<br />
Economics, May 2005, pp. 701–728.
CHAPTER 11W<br />
<strong>Technology</strong>, R&D, <strong>and</strong> Effi ciency 11W-15<br />
opportunities” as on its market structure. There simply<br />
may be more opportunities to innovate in the computer <strong>and</strong><br />
pharmaceutical industries, for example, than in the brickmaking<br />
<strong>and</strong> coal-mining industries.<br />
Conclusion: The inverted-U curve shown in<br />
Figure 11W.7 is a useful depiction of the general relationship<br />
between R&D spending <strong>and</strong> market structure, other<br />
things equal.<br />
Technological Advance <strong>and</strong><br />
<strong>Efficiency</strong><br />
Technological advance contributes significantly to<br />
economic efficiency. New <strong>and</strong> better processes <strong>and</strong> products<br />
enable society to produce more output, as well as a<br />
higher-valued mix of output.<br />
Productive <strong>Efficiency</strong><br />
Technological advance as embodied in process innovation<br />
improves productive efficiency by increasing the productivity<br />
of inputs (as indicated in Figure 11W.5 a) <strong>and</strong> by reducing<br />
average total costs (as in Figure 11W.5 b). In other words, it<br />
enables society to produce the same amount of a particular<br />
good or service while using fewer scarce resources, thereby<br />
freeing the unused resources to produce other goods <strong>and</strong><br />
services. Or if society desires more of the now less expensive<br />
good, process innovation enables it to have that greater<br />
quantity without sacrificing other goods. Viewed either<br />
way, process innovation enhances productive efficiency: It<br />
reduces society’s per-unit cost of whatever mix of goods <strong>and</strong><br />
services it chooses. It thus is an important means of shifting<br />
an economy’s production possibilities curve rightward.<br />
Allocative <strong>Efficiency</strong><br />
Technological advance as embodied in product (or service)<br />
innovation enhances allocative efficiency by giving society<br />
a more preferred mix of goods <strong>and</strong> services. Recall from<br />
our earlier discussion that consumers buy a new product<br />
rather than an old product only when buying the new<br />
one increases the total utility obtained from their limited<br />
incomes. Obviously, then, a popular new product—<strong>and</strong><br />
the new mix of products it implies—creates a higher level<br />
of total utility for society.<br />
In terms of markets, the dem<strong>and</strong> for the new product<br />
rises <strong>and</strong> the dem<strong>and</strong> for the old product declines. The high<br />
economic profit engendered by the new product attracts<br />
resources away from less valued uses <strong>and</strong> to the production<br />
of the new product. In theory, such shifting of resources<br />
continues until the price of the new product equals its marginal<br />
cost.<br />
There is a caveat here, however. Innovation (either<br />
product or process) can create monopoly power through<br />
patents or through the many advantages of being first.<br />
When new monopoly power results from an innovation,<br />
society may lose part of the improved efficiency it otherwise<br />
would have gained from that innovation. The reason is<br />
that the profit-maximizing monopolist restricts output<br />
to keep its product price above marginal cost. For example,<br />
Microsoft’s innovative Windows product has resulted<br />
in dominance in the market for Intel-compatible operating<br />
systems for personal computers. Microsoft’s substantial<br />
monopoly power permits it to charge prices that are well<br />
above marginal cost <strong>and</strong> minimum average total cost.<br />
Creative Destruction<br />
Although innovation can create monopoly power, it also<br />
can reduce or eliminate it. By increasing competition<br />
where it previously was weak, innovation can push prices<br />
down toward marginal cost. For example, Intel’s microprocessor<br />
enabled personal computers, <strong>and</strong> their ease of<br />
production eventually diminished IBM’s monopoly power<br />
in the sale of computer hardware. More recently, Linux’s<br />
new computer operating system has provided some promising<br />
competition for Microsoft Windows.<br />
At the extreme, innovation may cause creative<br />
destruction , where the creation of new products <strong>and</strong> new<br />
production methods simultaneously destroys the monopoly<br />
market positions of firms committed to existing products<br />
<strong>and</strong> old ways of doing business. As stated many years<br />
ago by Joseph Schumpeter, who championed this view:<br />
In capitalist reality . . . it is . . . competition from the new<br />
commodity, the new technology, the new source of supply,<br />
the new type of business organization—competition which<br />
comm<strong>and</strong>s a decisive cost or quality advantage <strong>and</strong> which<br />
strikes not at the margins of profits of the existing firms<br />
but at their foundation <strong>and</strong> their very lives. This kind of<br />
competition is . . . so . . . important that it becomes a matter<br />
of comparative indifference whether competition in the<br />
ordinary sense functions more or less promptly; the powerful<br />
lever that in the [very] long run exp<strong>and</strong>s output <strong>and</strong><br />
brings down prices is in any case made of other stuff. 2<br />
There are many examples of creative destruction:<br />
In the 1800s wagons, ships, <strong>and</strong> barges were the only<br />
means of transporting freight until the railroads broke<br />
up their monopoly; the dominant market position of the<br />
railroads was, in turn, undermined by trucks <strong>and</strong>, later,<br />
by airplanes. Movies brought new competition to live<br />
theater, at one time the “only show in town,” but movies<br />
2 Joseph A. Schumpeter, Capitalism, Socialism, <strong>and</strong> Democracy, 3d ed.<br />
(New York: Harper & Row, 1950), pp. 84–85.
LAST Word<br />
PART TWO<br />
11W-16<br />
Microeconomics of Product Markets<br />
On the Path to the Personal Computer <strong>and</strong> Internet<br />
Technological Advance Is Clearly Evident in the<br />
Development of the Modern Personal Computer<br />
<strong>and</strong> the Emergence of the Internet. Here Is a Brief<br />
History of Those Events.<br />
1945 Grace Murray Hopper finds a dead moth between<br />
relay contacts in the experimental Mark II computer<br />
at Harvard University. Whenever the computer<br />
subsequently malfunctions, workers set out to “debug”<br />
the device.<br />
1946 ENIAC is revealed. A precursor to the modern-day<br />
computer, it relies on 18,000 vacuum tubes <strong>and</strong> fills<br />
3000 cubic feet of space.<br />
1947 AT&T scientists invent the “transfer resistance<br />
device,” later known as the transistor. It replaces the<br />
less reliable vacuum tubes in computers.<br />
1961 Bob Noyce (who later founded Intel Corporation)<br />
<strong>and</strong> Jack Kilby invent the first integrated circuit,<br />
which miniaturizes electronic circuitry onto a single<br />
silicon chip.<br />
1964 IBM introduces the System360 computer. Configured<br />
as a system, it takes up nearly the same space as<br />
two tennis courts.<br />
1965 Digital Equipment Corporation unveils its PDP-8,<br />
the first relatively small-size computer<br />
(a “minicomputer”).<br />
1969 A networking system called ARPANET is born; it is<br />
the beginning of the Internet.<br />
1971 Intel introduces its 4004 processor (a “microprocessor”).<br />
The $200 chip is the size of a thumbnail <strong>and</strong> has<br />
as much computing capability as the earlier ENIAC.<br />
1975 Xerox markets Alto, the first personal computer<br />
(a “microcomputer”). Bill Gates <strong>and</strong> Paul Allen found<br />
Microsoft. MITS Corporation’s Altair 8800 arrives on<br />
the scene. It contains Intel’s 8080 microprocessor that<br />
Intel developed a year earlier to control traffic lights.<br />
1977 Apple II, Commodore’s PET, <strong>and</strong> T<strong>and</strong>y Radio<br />
Shack TRS-80 go on sale, setting the stage for the<br />
personal computer revolution.<br />
1981 IBM enters the market with its personal computer<br />
powered by the Intel 8800 chip <strong>and</strong> operated by the<br />
Microsoft Disc Operating System (MS-DOS).<br />
Osborne Computer markets the Osborne 1, the first<br />
self-contained microcomputer, but within 2 years the<br />
firm declares bankruptcy. Logitech commercializes<br />
the “X-Y Position Indicator for a Display System,”<br />
invented earlier by Douglas Engelbart in a<br />
government-funded research lab. Someone dubs it a<br />
“computer mouse” because it appears to have a tail.<br />
1982 Compaq Computer “clones” the IBM machines;<br />
others do the same. Eventually Compaq becomes one<br />
of the leading sellers of personal computers.<br />
1984 Apple introduces its Macintosh computer, with its<br />
“user-friendly” icons, attached mouse, <strong>and</strong> preloaded<br />
software. College student Michael Dell founds Dell<br />
Computers, which builds personal computers <strong>and</strong> sells<br />
them through mail order. IBM, Sears Roebuck, <strong>and</strong><br />
CBS team up to launch Prodigy Services, the first<br />
online computer business.<br />
1985 Microsoft releases its Windows graphical interface<br />
operating system that improves upon MS-DOS. Ted<br />
Waitt starts a mail-order personal computer business<br />
(Gateway 2000) out of his South Dakota barn.<br />
were later challenged by television. Vinyl long-playing<br />
records supplanted acetate 78-rpm phonograph records;<br />
cassettes then challenged LP records; <strong>and</strong> compact discs<br />
ORIGIN OF THE IDEA<br />
O 11W.1<br />
Creative destruction<br />
undermined cassettes.<br />
Now iPods, MP3 players,<br />
<strong>and</strong> Internet music<br />
downloads threaten sales<br />
of traditional CDs. Aluminum<br />
cans <strong>and</strong> plastic bottles have displaced glass<br />
bottles in many uses. E-mail has challenged the postal<br />
service. Mass discounters such as Wal-Mart <strong>and</strong> Costco<br />
have gained market share at the expense of Sears <strong>and</strong><br />
Montgomery Ward.<br />
According to Schumpeter, an innovator will automatically<br />
displace any monopolist that no longer delivers<br />
superior performance. But many contemporary economists<br />
think this notion reflects more wishful thinking<br />
than fact. In this view, the idea that creative destruction<br />
is automatic<br />
. . . neglects the ability of powerful established firms to erect<br />
private storm shelters—or lobby government to build public<br />
storm shelters for them—in order to shield themselves from<br />
11W-16
CHAPTER 11W<br />
<strong>Technology</strong>, R&D, <strong>and</strong> Effi ciency 11W-17<br />
1990 Microsoft introduces Windows 3.0, which, like<br />
Macintosh, features windows, icons, <strong>and</strong> pulldown<br />
menus. Apple sues Microsoft for copyright<br />
infringement.<br />
1991 The World Wide<br />
Web (an Internet<br />
system) is invented.<br />
1993 Intel introduces its<br />
first of several Pentium<br />
chips, which<br />
greatly speed up<br />
computing. The<br />
courts reject Apple’s<br />
claim that Microsoft<br />
violated its copyrights<br />
on its Macintosh<br />
operating system.<br />
1994 Marc Andreessen<br />
starts up Netscape<br />
Communications <strong>and</strong><br />
markets Netscape<br />
Navigator, which<br />
quickly becomes the<br />
leading software<br />
browser for the<br />
emerging Internet.<br />
David Filo <strong>and</strong> Jerry<br />
Yang develop Yahoo, a<br />
system for locating<br />
material stored on the<br />
Internet.<br />
1995 Microsoft releases the Windows 95 operating<br />
system, which becomes the dominant operating<br />
system of personal computers (90 percent market<br />
share). Microsoft is now well established as the<br />
world’s leading software producer. Sun<br />
Microsystems introduces Java, an Internet programming<br />
language.<br />
1996 Playing catch-up with Netscape, Microsoft develops<br />
Microsoft Internet Explorer <strong>and</strong> gives it away free.<br />
1999 Netscape’s market share<br />
plunges <strong>and</strong> it merges with<br />
America Online. More than 100<br />
million personal computers are<br />
manufactured worldwide this<br />
year alone.<br />
2000 Sixty percent of American<br />
households have access to the<br />
Internet either at home or at<br />
work, <strong>and</strong> the Internet spreads<br />
worldwide. Internet commerce<br />
in the United States reaches<br />
$300 billion, <strong>and</strong> an estimated<br />
1.2 million U.S. jobs are<br />
Internet-related.<br />
2002 A Federal court of appeals<br />
finds that Microsoft has a monopoly<br />
in operating system software<br />
for Intel-compatible<br />
personal computers <strong>and</strong> has<br />
maintained its monopoly through<br />
illegal actions aimed at thwarting<br />
threats from rivals. The court<br />
imposes a set of specific<br />
restrictions on Microsoft’s anticompetitive<br />
business practices.<br />
2005 Google, the innovative Internet search company,<br />
becomes the “darling” of Wall Street as its share price<br />
rises from $85 at its initial public offering (IPO) in<br />
August 2004 to $700 at the end of 2007.<br />
Source: Based partly on Diedtra Henderson, “Moore’s Law Still<br />
Reigns,” Seattle Times, Nov. 24, 1996, augmented <strong>and</strong> updated.<br />
the Schumpeterian gales of creative destruction. It ignores<br />
the difference between the legal freedom of entry <strong>and</strong> the<br />
economic reality deterring the entry of potential newcomers<br />
into concentrated industries. 3<br />
That is, some dominant firms may be able to use strategies<br />
such as selective price cutting, buyouts, <strong>and</strong> massive<br />
advertising to block entry <strong>and</strong> competition from even the<br />
3 Walter Adams <strong>and</strong> James Brock, The Structure of American Industry, 10th<br />
ed. (Upper Saddle River, N.J.: Prentice Hall, 2001), pp. 363–364.<br />
most innovative new firms <strong>and</strong> existing rivals. Moreover,<br />
politically active dominant firms have been known to persuade<br />
government to give them tax breaks, subsidies, <strong>and</strong><br />
tariff protection that strengthen their market power.<br />
In short, while innovation in general enhances economic<br />
efficiency, in some cases it may lead to entrenched monopoly<br />
power. Further innovation may eventually destroy that<br />
monopoly power, but the process of creative destruction is<br />
neither automatic nor inevitable. On the other h<strong>and</strong>, the<br />
possession of monopoly power does not necessarily preclude<br />
rapid technological advance, innovation, or efficiency.<br />
11W-17
11W-18<br />
PART TWO<br />
Microeconomics of Product Markets<br />
Summary<br />
1. Technological advance is evidenced by new <strong>and</strong> improved<br />
goods <strong>and</strong> services <strong>and</strong> new <strong>and</strong> improved production or<br />
distribution processes. In economists’ models, technological<br />
advance occurs only in the very long run.<br />
2. Invention is the discovery of a product or process through the<br />
use of imagination, ingenuity, <strong>and</strong> experimentation. Innovation<br />
is the first successful commercial introduction of a new<br />
product, the first use of a new method, or the creation of a<br />
new form of business enterprise. Diffusion is the spread of an<br />
earlier innovation among competing firms. Firms channel a<br />
majority of their R&D expenditures to innovation <strong>and</strong> imitation,<br />
rather than to basic scientific research <strong>and</strong> invention.<br />
3. Historically, most economists viewed technological advance<br />
as a r<strong>and</strong>om, external force to which the economy adjusted.<br />
Many contemporary economists see technological advance<br />
as occurring in response to profit incentives within the<br />
economy <strong>and</strong> thus as an integral part of capitalism.<br />
4. Entrepreneurs <strong>and</strong> other innovators try to anticipate the<br />
future. They play a central role in technological advance<br />
by initiating changes in products <strong>and</strong> processes. Entrepreneurs<br />
often form start-up firms that focus on creating <strong>and</strong><br />
introducing new products. Sometimes, innovators work in<br />
the R&D labs of major corporations. Entrepreneurs <strong>and</strong> innovative<br />
firms often rely heavily on the basic research done<br />
by university <strong>and</strong> government scientists.<br />
5. A firm’s optimal amount of R&D spending occurs where its<br />
expected return (marginal benefit) from the R&D equals<br />
its interest-rate cost of funds (marginal cost) to finance the<br />
R&D. Entrepreneurs <strong>and</strong> firms use several sources to finance<br />
R&D, including (a) bank loans, (b) bonds, (c) venture capital<br />
(funds lent in return for a share of the profits if the business<br />
succeeds), (d) undistributed corporate profits (retained<br />
earnings), <strong>and</strong> (e) personal savings.<br />
6. Product innovation, the introduction of new products, succeeds<br />
when it provides consumers with higher marginal utility<br />
per dollar spent than do existing products. The new product<br />
enables consumers to obtain greater total utility from a given<br />
income. From the firm’s perspective, product innovation<br />
increases net revenue sufficiently to yield a positive rate of<br />
return on the R&D spending that produced the innovation.<br />
7. Process innovation can lower a firm’s production costs<br />
by improving its internal production techniques. Such<br />
improvement increases the firm’s total product, thereby<br />
lowering its average total cost <strong>and</strong> increasing its profit. The<br />
added profit provides a positive rate of return on the R&D<br />
spending that produced the process innovation.<br />
8. Imitation poses a potential problem for innovators since<br />
it threatens their returns on R&D expenditures. Some<br />
dominant firms use a fast-second strategy, letting smaller<br />
firms initiate new products <strong>and</strong> then quickly imitating the<br />
successes. Nevertheless, there are significant protections<br />
<strong>and</strong> potential benefits for firms that take the lead with R&D<br />
<strong>and</strong> innovation, including (a) patent protection, (b) copyrights<br />
<strong>and</strong> trademarks, (c) lasting br<strong>and</strong>-name recognition,<br />
(d) benefits from trade secrets <strong>and</strong> learning by doing,<br />
(e) high economic profits during the time lag between a<br />
product’s introduction <strong>and</strong> its imitation, <strong>and</strong> (f) the possibility<br />
of lucrative buyout offers from larger firms.<br />
9. Each of the four basic market structures has potential strengths<br />
<strong>and</strong> weaknesses regarding the likelihood of R&D <strong>and</strong> innovation.<br />
The inverted-U theory of R&D holds that a firm’s R&D<br />
spending as a percentage of its sales rises with its industry fourfirm<br />
concentration ratio, reaches a peak at a 50 percent concentration<br />
ratio, <strong>and</strong> then declines as concentration increases<br />
further. Empirical evidence is not clear-cut but lends general<br />
support to this theory. For any specific industry, however, the<br />
technological opportunities that are available may count more<br />
than market structure in determining R&D spending <strong>and</strong><br />
innovation.<br />
10. In general, technological advance enhances both productive<br />
<strong>and</strong> allocative efficiency. But in some situations patents <strong>and</strong><br />
the advantages of being first with an innovation can increase<br />
monopoly power. While in some cases creative destruction<br />
eventually destroys monopoly, most economists doubt that<br />
this process is either automatic or inevitable.<br />
Terms <strong>and</strong> Concepts<br />
technological advance<br />
very long run<br />
invention<br />
patent<br />
innovation<br />
product innovation<br />
process innovation<br />
diffusion<br />
start-ups<br />
venture capital<br />
interest-rate cost-of-funds curve<br />
expected-rate-of-return curve<br />
optimal amount of R&D<br />
imitation problem<br />
fast-second strategy<br />
inverted-U theory of R&D<br />
creative destruction
Study Questions<br />
1. What is meant by technological advance, as broadly defined<br />
How does technological advance enter into the definition<br />
of the very long run Which of the following are examples<br />
of technological advance, <strong>and</strong> which are not: an improved<br />
production process; entry of a firm into a profitable purely<br />
competitive industry; the imitation of a new production<br />
process by another firm; an increase in a firm’s advertising<br />
expenditures LO1<br />
2. Listed below are several possible actions by firms. Write<br />
“INV” beside those that reflect invention, “INN” beside<br />
those that reflect innovation, <strong>and</strong> “DIF” beside those that<br />
reflect diffusion. LO1<br />
a. An auto manufacturer adds “heated seats” as a st<strong>and</strong>ard<br />
feature in its luxury cars to keep pace with a rival firm<br />
whose luxury cars already have this feature.<br />
b. A television production company pioneers the first<br />
music video channel.<br />
c. A firm develops <strong>and</strong> patents a working model of a<br />
self-erasing whiteboard for classrooms.<br />
d. A lightbulb firm is the first to produce <strong>and</strong> market<br />
lighting fixtures with halogen lamps.<br />
e. A rival toy maker introduces a new Jenny doll to<br />
compete with Mattel’s Barbie doll.<br />
3. Contrast the older <strong>and</strong> the modern views of technological<br />
advance as they relate to the economy. What is the role<br />
of entrepreneurs <strong>and</strong> other innovators in technological<br />
advance How does research by universities <strong>and</strong> government<br />
affect innovators <strong>and</strong> technological advance Why do<br />
you think some university researchers are becoming more<br />
like entrepreneurs <strong>and</strong> less like “pure scientists” LO2<br />
4. KEY QUESTION Suppose a firm expects that a $20 million<br />
expenditure on R&D will result in a new product that will<br />
increase its revenue by a total of $30 million 1 year from<br />
now. The firm estimates that the production cost of the new<br />
product will be $29 million. LO3<br />
a. What is the expected rate of return on this R&D<br />
expenditure<br />
b. Suppose the firm can get a bank loan at 6 percent<br />
interest to finance its $20 million R&D project.<br />
Will the firm undertake the project Explain why or<br />
why not.<br />
c. Now suppose the interest-rate cost of borrowing, in<br />
effect, falls to 4 percent because the firm decides to use<br />
its own retained earnings to finance the R&D. Will this<br />
lower interest rate change the firm’s R&D<br />
decision Explain.<br />
5. KEY QUESTION Answer the following lettered questions<br />
on the basis of the information in this table: LO3<br />
<br />
economics<br />
CHAPTER 11W<br />
<strong>Technology</strong>, R&D, <strong>and</strong> Effi ciency<br />
Expected Rate of<br />
Amount of R&D, Millions Return on R&D, %<br />
$10 16<br />
20 14<br />
30 12<br />
40 10<br />
50 8<br />
60 6<br />
a. If the interest-rate cost of funds is 8 percent, what will<br />
be the optimal amount of R&D spending for this firm<br />
b. Explain why $20 million of R&D spending will not<br />
be optimal.<br />
c. Why won’t $60 million be optimal either<br />
6. KEY QUESTION Refer to Table 11W.1 <strong>and</strong> suppose the<br />
price of new product C is $2 instead of $4. How does this<br />
affect the optimal combination of products A, B, <strong>and</strong> C for<br />
the person represented by the data Explain: “The success<br />
of a new product depends not only on its marginal utility but<br />
also on its price.” LO3<br />
7. Learning how to use software takes time. So once customers<br />
have learned to use a particular software package, it is easier to<br />
sell them software upgrades than to convince them to switch<br />
to new software. What implications does this have for expected<br />
rates of return on R&D spending for software firms developing<br />
upgrades versus firms developing imitative products LO4<br />
8. KEY QUESTION Answer the following questions on the basis<br />
of this information for a single firm: total cost of capital <br />
$1000; price paid for labor $12 per labor unit; price paid<br />
for raw materials $4 per raw-material unit. LO3<br />
a. Suppose the firm can produce 5000 units of output by<br />
combining its fixed capital with 100 units of labor <strong>and</strong><br />
450 units of raw materials. What are the total cost <strong>and</strong><br />
average total cost of producing the 5000 units of output<br />
b. Now assume the firm improves its production process<br />
so that it can produce 6000 units of output by combining<br />
its fixed capital with 100 units of labor <strong>and</strong> 450 units<br />
of raw materials. What are the total cost <strong>and</strong> average<br />
cost of producing the 6000 units of output<br />
c. Refer to your answers to 8a <strong>and</strong> 8b <strong>and</strong> explain how<br />
process innovation can improve economic efficiency.<br />
9. Why might a firm making a large economic profit from its existing<br />
product employ a fast-second strategy in relationship to<br />
new or improved products What risks does it run in pursuing<br />
this strategy What incentive does a firm have to engage<br />
in R&D when rivals can imitate its new product LO4<br />
11W-19
11W-20<br />
PART TWO<br />
Microeconomics of Product Markets<br />
10. Do you think the overall level of R&D would increase or<br />
decrease over the next 20 to 30 years if the lengths of new<br />
patents were extended from 20 years to, say, “forever”<br />
What if the duration were reduced from 20 years to, say, 3<br />
years LO4<br />
11. Make a case that neither pure competition nor pure monopoly<br />
is conducive to a great deal of R&D spending <strong>and</strong> innovation.<br />
Why might oligopoly be more favorable to R&D spending<br />
<strong>and</strong> innovation than either pure competition or pure<br />
monopoly What is the inverted-U theory of R&D, <strong>and</strong> how<br />
does it relate to your answers to these questions LO5<br />
12. Evaluate: “Society does not need laws outlawing monopolization<br />
<strong>and</strong> monopoly. Inevitably, monopoly causes its own<br />
self-destruction since its high profit is the lure for other firms<br />
or entrepreneurs to develop substitute products.” LO6<br />
13. LAST WORD Identify a specific example of each of the following<br />
in this chapter’s Last Word: (a) entrepreneurship,<br />
(b) invention, (c) innovation, <strong>and</strong> (d) diffusion.<br />
Web-Based Questions<br />
1. THE NATIONAL SCIENCE FOUNDATION R&D<br />
STATISTICS—WHAT’S HAPPENING Go to the<br />
Division of Science Resource Statistics Web site,<br />
www.nsf.gov/statistics/natlpatterns , to find National<br />
Patterns of R&D. Select the most recent update year. Then<br />
select Full Publication. Use the historical data tables to determine<br />
whether the following R&D numbers increased,<br />
remained constant, or decreased over the last 5 years listed:<br />
( a ) Total U.S. R&D expenditures in constant dollars,<br />
( b ) Federal support for R&D in constant dollars, ( c ) R&D<br />
as a percentage of U.S. GDP, <strong>and</strong> ( d ) Federal support of<br />
R&D as a percentage of GDP. What are the technological<br />
implications of these figures for the United States<br />
2. NASA—ARE THERE COMMERCIAL SPIN-OFFS Visit<br />
the Web site of NASA’s <strong>Technology</strong> Transfer Office, at<br />
www.sti.nasa.gov/tto , to identify significant commercial<br />
benefits from secondary use of NASA technology.<br />
Search the database to find <strong>and</strong> describe five such spin-offs.<br />
How does the NASA Commercial <strong>Technology</strong> Network,<br />
nctn.hq.nasa.gov, move technology from the lab to the<br />
marketplace<br />
FURTHER TEST YOUR KNOWLEDGE AT<br />
www.mcconnell18e.com