Can denaturing gradient gel electrophoresis (DGGE) analysis of ...
Can denaturing gradient gel electrophoresis (DGGE) analysis of ...
Can denaturing gradient gel electrophoresis (DGGE) analysis of ...

Create successful ePaper yourself
Turn your PDF publications into a flip-book with our unique Google optimized e-Paper software.
A. Lerner et al. / Soil Biology & Biochemistry 38 (2006) 1188–1192 1189<br />
physical evidence was found in the crime scene. The main<br />
suspect, arrested a couple <strong>of</strong> days later, claimed to have been<br />
with the victim on a non-asphalted, nearby parking lot (the alibi<br />
area). The suspect washed his clothes and shoes after the<br />
murder and the only possible link to the crime scene was a<br />
small soil clot (0.2 g) found inside his shoe.<br />
2.2. Soils<br />
Soils samples were collected from different locations<br />
(Table 1). Soils used for the evaluation <strong>of</strong> DNA extraction<br />
protocols were sampled 5 cm below the surface, and kept on<br />
ice until processed. Samples originating from the crime scene<br />
were kept in plastic bags on the shelf and in the dark for<br />
6 months until <strong>analysis</strong>. The soil clot from the suspect’s shoe<br />
was not made available for <strong>analysis</strong> by the court because <strong>of</strong> the<br />
destructive nature <strong>of</strong> the <strong>analysis</strong>.<br />
2.3. Soil wash<br />
Soil samples in 1.8 ml <strong>of</strong> 0.05 M buffer phosphate and 0.5%<br />
cetyltrimethylammonium bromide (CTAB) were ground using<br />
a mortar and pestle. Samples were shaken for 3 h at 4 8C and<br />
200 rev min K1 , and then centrifuged for 10 min at 4 8C and<br />
700 rev min K1 . The supernatant was removed and DNA<br />
extraction was performed.<br />
2.4. DNA extraction<br />
Five direct methods were used for DNA extraction from<br />
bacterial communities: (a) Tsai and Olson (1991) (thereafter<br />
‘T’) with slight modifications: After three freeze-thaw cycles,<br />
proteinase K was added to the solution to a final concentration<br />
<strong>of</strong> 50 mg ml K1 and the samples were incubated for 30 min at<br />
37 8C; (b) Zhou et al. (1996) (‘Z’); (c) Yeates et al. (1998)<br />
(‘Y’); (d-e) methods based on the commercial kits FastDNA<br />
SPIN Kit for Soil (BIO 101, Qbiogene, Inc, Carlsbad, USA)<br />
(‘F’) and UltraCleane Soil DNA kit (MO BIO Laboratories,<br />
USA) (‘U’). The Y and F methods included a bead beating step.<br />
Samples weighing 0.2, 1, 10, 0.6, and 0.25 g were used with<br />
methods, T and Y, Z, F, and U, respectively. The weight <strong>of</strong> the<br />
soil samples was the optimum recommended for each protocol.<br />
2.5. Purification <strong>of</strong> crude DNA extracts<br />
The QIAquick Gel Extraction kit (QIAGEN GmbH, Hilden,<br />
Germany, and DNA Isolation kit (Biological Ind., Israel) were<br />
used to purify DNA.<br />
2.6. PCR amplification<br />
One to three microlitre <strong>of</strong> each DNA preparation from<br />
environmental sample were amplified in a PCR reaction<br />
mixture (50 ml) using an Eppendorf Mastercycler Gradient<br />
(Brinkmann Instruments, Inc., USA). Each PCR mixture<br />
contained 0.8 mM <strong>of</strong> each primer, 0.3 mM <strong>of</strong> each deoxynucleotide<br />
(dNTP), 5 ml <strong>of</strong> 10! buffer (Promega, Madison,<br />
USA), 0.03 unit ml K1 redTaq DNA polymerase (Sigma,<br />
Rehovot, Israel), 3.75 mM MgCl 2 ,2ml <strong>of</strong>10mgml K1 BSA<br />
and double distilled, sterilized water to complete the mixture<br />
volume. The primers for PCR were specific for conserved<br />
bacterial 16S rDNA sequences (Heuer et al., 1997). PCR with<br />
primers Gm5f (5 0 -GC-clamp-CCT ACG GGA GGC AGC<br />
AG-3 0 ) and 907r (5 0 -CCC CGT CAA TTC CTT TGA GTT<br />
T-3) amplified a bacterial 16S rDNA fragment from position<br />
341–928 (Escherichia coli numbering). PCR amplification was<br />
performed for 35 cycles as follows: after initial denaturation <strong>of</strong><br />
1 min at 95 8C each cycle consisted <strong>of</strong> denaturation at 95 8C for<br />
20 s, primer annealing at 57 8C for 25 s, and primer extension<br />
at 72 8C from 30 s. Cycling was followed by final primer<br />
extension at 72 8C from 1 min. PCR products were visualized<br />
by <strong>electrophoresis</strong> in 1% (w/v) agarose <strong>gel</strong>s after 1 mg ml K1<br />
EtBr staining (Sambrook et al., 1989).<br />
2.7. Denaturing <strong>gradient</strong> <strong>gel</strong> <strong>electrophoresis</strong><br />
Strong PCR products <strong>of</strong> the expected size (550 bp) were<br />
subjected to <strong>DGGE</strong> <strong>analysis</strong>. <strong>DGGE</strong> was performed with an<br />
Ingeny phor U-2 system (Leiden, The Netherlands). Samples <strong>of</strong><br />
43 ml <strong>of</strong> PCR product were loaded onto 6% (w/v) polyacrylamide<br />
<strong>gel</strong>s in 1.0 strength Tris-ethylene-diamineteraacetate<br />
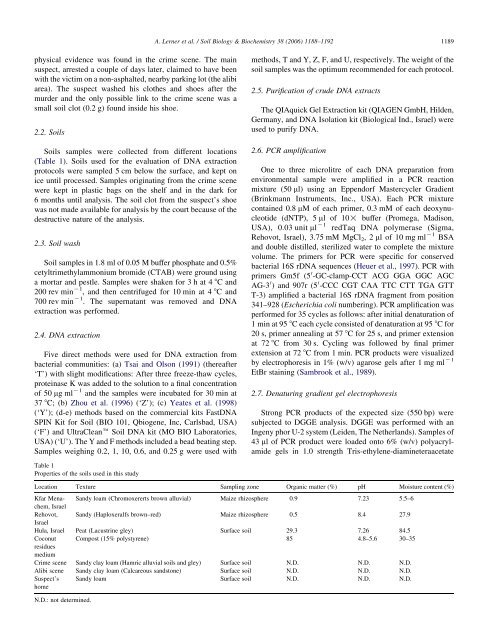
Table 1<br />
Properties <strong>of</strong> the soils used in this study<br />
Location Texture Sampling zone Organic matter (%) pH Moisture content (%)<br />
Kfar Menachem,<br />
Sandy loam (Chromoxererts brown alluvial) Maize rhizosphere 0.9 7.23 5.5–6<br />
Israel<br />
Rehovot, Sandy (Haploxeralfs brown–red) Maize rhizosphere 0.5 8.4 27.9<br />
Israel<br />
Hula, Israel Peat (Lacustrine gley) Surface soil 29.3 7.26 84.5<br />
Coconut Compost (15% polystyrene) 85 4.8–5.6 30–35<br />
residues<br />
medium<br />
Crime scene Sandy clay loam (Hamric alluvial soils and gley) Surface soil N.D. N.D. N.D.<br />
Alibi scene Sandy clay loam (Calcareous sandstone) Surface soil N.D. N.D. N.D.<br />
Suspect’s<br />
home<br />
Sandy loam Surface soil N.D. N.D. N.D.<br />
N.D.: not determined.