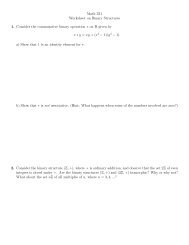
Midterm Examination Review MATH 210G Fall, 2012 Instructions ...
Midterm Examination Review MATH 210G Fall, 2012 Instructions ...
Midterm Examination Review MATH 210G Fall, 2012 Instructions ...

You also want an ePaper? Increase the reach of your titles
YUMPU automatically turns print PDFs into web optimized ePapers that Google loves.
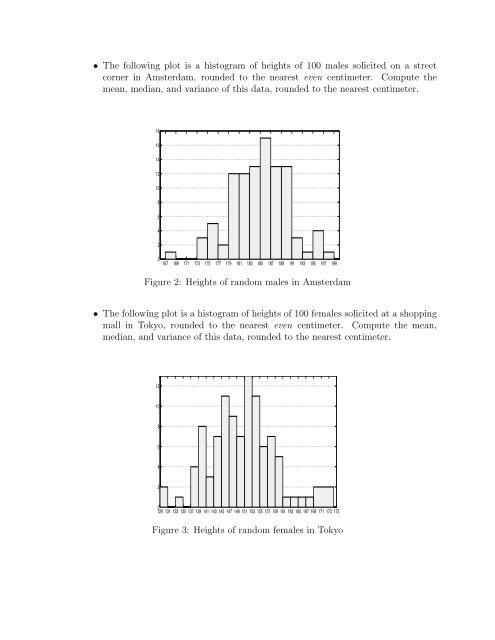
• The following plot is a histogram of heights of 100 males solicited on a street<br />
corner in Amsterdam, rounded to the nearest even centimeter. Compute the<br />
mean, median, and variance of this data, rounded to the nearest centimeter.<br />
18<br />
16<br />
14<br />
12<br />
10<br />
8<br />
6<br />
4<br />
2<br />
0<br />
167 169 171 173 175 177 179 181 183 185 187 189 191 193 195 197 199<br />
Figure 2: Heights of random males in Amsterdam<br />
• The following plot is a histogram of heights of 100 females solicited at a shopping<br />
mall in Tokyo, rounded to the nearest even centimeter. Compute the mean,<br />
median, and variance of this data, rounded to the nearest centimeter.<br />
12<br />
10<br />
8<br />
6<br />
4<br />
2<br />
0<br />
129 131 133 135 137 139 141 143 145 147 149 151 153 155 157 159 161 163 165 167 169 171 173 175<br />
Figure 3: Heights of random females in Tokyo