Handout #10a - Malcolm Shabazz City High School, Madison WI
Handout #10a - Malcolm Shabazz City High School, Madison WI
Handout #10a - Malcolm Shabazz City High School, Madison WI

Create successful ePaper yourself
Turn your PDF publications into a flip-book with our unique Google optimized e-Paper software.
Integrated Science Program<br />
James <strong>Madison</strong> Memorial <strong>High</strong> <strong>School</strong><br />
Unit 4; <strong>Handout</strong> No. 10a<br />
Name ______________________________<br />
Period_______Date___________________<br />
Teacher____________________________<br />
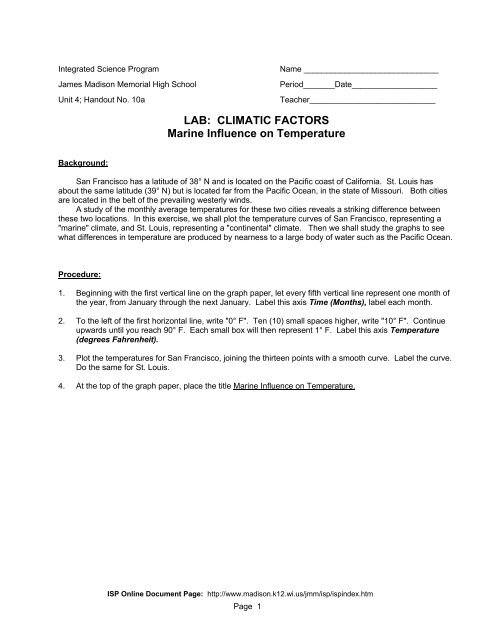
LAB: CLIMATIC FACTORS<br />
Marine Influence on Temperature<br />
Background:<br />
San Francisco has a latitude of 38° N and is located on the Pacific coast of California. St. Louis has<br />
about the same latitude (39° N) but is located far from the Pacific Ocean, in the state of Missouri. Both cities<br />
are located in the belt of the prevailing westerly winds.<br />
A study of the monthly average temperatures for these two cities reveals a striking difference between<br />
these two locations. In this exercise, we shall plot the temperature curves of San Francisco, representing a<br />
"marine" climate, and St. Louis, representing a "continental" climate. Then we shall study the graphs to see<br />
what differences in temperature are produced by nearness to a large body of water such as the Pacific Ocean.<br />
Procedure:<br />
1. Beginning with the first vertical line on the graph paper, let every fifth vertical line represent one month of<br />
the year, from January through the next January. Label this axis Time (Months), label each month.<br />
2. To the left of the first horizontal line, write "0° F". Ten (10) small spaces higher, write "10° F". Continue<br />
upwards until you reach 90° F. Each small box will then represent 1° F. Label this axis Temperature<br />
(degrees Fahrenheit).<br />
3. Plot the temperatures for San Francisco, joining the thirteen points with a smooth curve. Label the curve.<br />
Do the same for St. Louis.<br />
4. At the top of the graph paper, place the title Marine Influence on Temperature.<br />
ISP Online Document Page: http://www.madison.k12.wi.us/jmm/isp/ispindex.htm<br />
Page 1
Average Monthly Temperatures in Degrees Fahrenheit<br />
<strong>City</strong>: San Francisco, St. Louis,<br />
California<br />
Missouri<br />
Latitude: 38° N, 122° W 39° N, 90° W<br />
January 50 33<br />
February 53 37<br />
March 55 45<br />
April 56 56<br />
May 57 66<br />
June 59 76<br />
July 59 81<br />
August 59 79<br />
September 62 71<br />
October 61 61<br />
November 57 46<br />
December 52 36<br />
January 50 33<br />
Summary Questions:<br />
Your teacher will tell you where to respond to these questions…<br />
1. From the table of monthly temperatures, compute the average temperature for the year for the two cities.<br />
How can you explain the close agreement of these two temperatures<br />
2. Compare the yearly temperature range of St. Louis to that of San Francisco.<br />
3. Compare the summer temperatures -- June, July, and August -- of St. Louis to those of San Francisco.<br />
4. Compare the winter temperatures -- December, January, and February -- of the two cities.<br />
5. If both of these cities receive the same, maximum amount of solar energy on ~June 21st, why doesn’t St.<br />
Louis reaches its' peak temperature until July Why doesn’t San Francisco reach its' peak average<br />
temperature until September<br />
ISP Online Document Page: http://www.madison.k12.wi.us/jmm/isp/ispindex.htm<br />
Page 2
Integrated Science Program<br />
James <strong>Madison</strong> Memorial <strong>High</strong> <strong>School</strong><br />
Unit 4; <strong>Handout</strong> No. 10a<br />
Name ______________________________<br />
Period_______Date___________________<br />
Teacher____________________________<br />
LAB: CLIMATIC FACTORS<br />
Marine Influence on Temperature<br />
ISP Online Document Page: http://www.madison.k12.wi.us/jmm/isp/ispindex.htm<br />
Page 3
Summary Questions:<br />
1. From the table of monthly temperatures, compute the average temperature for the year for the two cities.<br />
How can you explain the close agreement of these two temperatures<br />
2. Compare the yearly temperature range of St. Louis to that of San Francisco.<br />
3. Compare the summer temperatures -- June, July, and August -- of St. Louis to those of San Francisco.<br />
4. Compare the winter temperatures -- December, January, and February -- of the two cities.<br />
5. If both of these cities receive the same, maximum amount of solar energy on ~June 21st, why doesn’t St.<br />
Louis reaches its' peak temperature until July Why doesn’t San Francisco reach its' peak average<br />
temperature until September<br />
ISP Online Document Page: http://www.madison.k12.wi.us/jmm/isp/ispindex.htm<br />
Page 4