From the Adirondacks to Acadia - Wildlands Network
From the Adirondacks to Acadia - Wildlands Network
From the Adirondacks to Acadia - Wildlands Network

You also want an ePaper? Increase the reach of your titles
YUMPU automatically turns print PDFs into web optimized ePapers that Google loves.
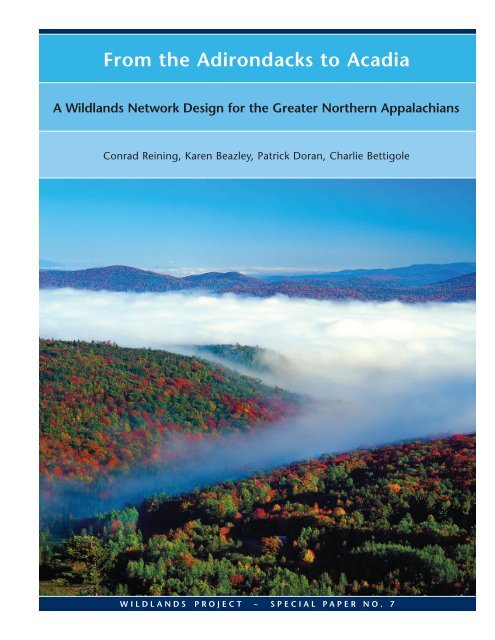
<strong>From</strong> <strong>the</strong> <strong>Adirondacks</strong> <strong>to</strong> <strong>Acadia</strong><br />
A <strong>Wildlands</strong> <strong>Network</strong> Design for <strong>the</strong> Greater Nor<strong>the</strong>rn Appalachians<br />
Conrad Reining, Karen Beazley, Patrick Doran, Charlie Bettigole<br />
W ILD LANDS PROJECT ~ SPECIAL PAPER NO. 7
We are ambitious. We live for <strong>the</strong> day when grizzlies in<br />
Chihuahua have an unbroken connection <strong>to</strong> grizzlies in<br />
Alaska; when wolf populations are res<strong>to</strong>red from Mexico<br />
<strong>to</strong> <strong>the</strong> Yukon <strong>to</strong> Maine; when vast forests and flowing<br />
prairies again thrive and support <strong>the</strong>ir full range of native<br />
plants and animals; when humans dwell on <strong>the</strong> land with<br />
respect, humility, and affection.<br />
Toward this end, <strong>the</strong> <strong>Wildlands</strong> Project is working <strong>to</strong><br />
res<strong>to</strong>re and protect <strong>the</strong> natural heritage of North America.<br />
Through advocacy, education, scientific consultation, and<br />
cooperation with many partners, we are designing and<br />
helping create systems of interconnected wilderness areas<br />
that can sustain <strong>the</strong> diversity of life.<br />
WILDLANDS PROJECT<br />
P.O. Box 455<br />
Richmond, VT 05477<br />
802/434-4077<br />
info@wildlandsproject.org<br />
www.wildlandsproject.org
<strong>From</strong> <strong>the</strong> <strong>Adirondacks</strong> <strong>to</strong> <strong>Acadia</strong><br />
A <strong>Wildlands</strong> <strong>Network</strong> Design for <strong>the</strong> Greater Nor<strong>the</strong>rn Appalachians<br />
Conrad Reining, Karen Beazley, Patrick Doran, Charlie Bettigole<br />
CONTENTS<br />
Executive Summary . . . . . . . . . . . . . . . . . . . . . . . . . . . . . . . . . . . . . . . . . . . . . . . . . . . . . . . . 2<br />
Introduction . . . . . . . . . . . . . . . . . . . . . . . . . . . . . . . . . . . . . . . . . . . . . . . . . . . . . . . . . . . . . 3<br />
<strong>Wildlands</strong> Project Mission and Megalinkages . . . . . . . . . . . . . . . . . . . . . . . . . . . . . . . . . . . 4<br />
<strong>From</strong> <strong>the</strong> <strong>Adirondacks</strong> <strong>to</strong> <strong>the</strong> Maritimes: A Regional Overview of <strong>the</strong> Greater<br />
Nor<strong>the</strong>rn Appalachians and Why They Need Protection and Res<strong>to</strong>ration . . . . . . . . . . . . . 9<br />
A <strong>Wildlands</strong> <strong>Network</strong> Design for <strong>the</strong> Greater Nor<strong>the</strong>rn Appalachians . . . . . . . . . . . . . . . 15<br />
Study Area . . . . . . . . . . . . . . . . . . . . . . . . . . . . . . . . . . . . . . . . . . . . . . . . . . . . . . . . . . . . .15<br />
Three-track Approach <strong>to</strong> Conservation Planning . . . . . . . . . . . . . . . . . . . . . . . . . . . . . . . . . .15<br />
Site Selection . . . . . . . . . . . . . . . . . . . . . . . . . . . . . . . . . . . . . . . . . . . . . . . . . . . . . . . . . . .19<br />
Planning Units . . . . . . . . . . . . . . . . . . . . . . . . . . . . . . . . . . . . . . . . . . . . . . . . . . . . . . . . . .19<br />
Sensitivity Analysis . . . . . . . . . . . . . . . . . . . . . . . . . . . . . . . . . . . . . . . . . . . . . . . . . . . . . . .20<br />
MARXAN Parameters . . . . . . . . . . . . . . . . . . . . . . . . . . . . . . . . . . . . . . . . . . . . . . . . . . . . .20<br />
Data Limitations . . . . . . . . . . . . . . . . . . . . . . . . . . . . . . . . . . . . . . . . . . . . . . . . . . . . . . . . . 22<br />
Results of <strong>the</strong> Site Selection Analysis . . . . . . . . . . . . . . . . . . . . . . . . . . . . . . . . . . . . . . . . . .23<br />
Methods for Creating <strong>the</strong> <strong>Wildlands</strong> <strong>Network</strong> Design . . . . . . . . . . . . . . . . . . . . . . . . . . . . . .27<br />
Methodological Limitations and Strengths . . . . . . . . . . . . . . . . . . . . . . . . . . . . . . . . . . . . . .30<br />
Results of <strong>the</strong> <strong>Network</strong> Design . . . . . . . . . . . . . . . . . . . . . . . . . . . . . . . . . . . . . . . . . . . . . . . 32<br />
Goal Attainment in <strong>the</strong> <strong>Network</strong> Design . . . . . . . . . . . . . . . . . . . . . . . . . . . . . . . . . . . . . . .39<br />
Discussion . . . . . . . . . . . . . . . . . . . . . . . . . . . . . . . . . . . . . . . . . . . . . . . . . . . . . . . . . . . . . . 40<br />
Acknowledgments . . . . . . . . . . . . . . . . . . . . . . . . . . . . . . . . . . . . . . . . . . . . . . . . . . . . . . . . 45<br />
Appendices . . . . . . . . . . . . . . . . . . . . . . . . . . . . . . . . . . . . . . . . . . . . . . . . . . . . . . . . . . . . . 46<br />
Appendix 1: Methods Used by TNC, NCC and <strong>the</strong>ir<br />
Partners <strong>to</strong> Delineate Matrix Forest Blocks . . . . . . . . . . . . . . . . . . . . . . . . . . . . . . . . . . . .46<br />
Appendix 2: Ecological Land Unit Types Captured by Draft <strong>Wildlands</strong> <strong>Network</strong> . . . . . . . . . . . . 47<br />
Appendix 3: Detailed Methods Used <strong>to</strong> Create <strong>the</strong> <strong>Wildlands</strong><br />
<strong>Network</strong> Design at <strong>the</strong> State And Provincial Level . . . . . . . . . . . . . . . . . . . . . . . . . . . . . . .50<br />
Appendix 4: Experts Who Participated in Meetings or Were O<strong>the</strong>rwise<br />
Consulted in <strong>the</strong> Development of <strong>the</strong> <strong>Network</strong> Design . . . . . . . . . . . . . . . . . . . . . . . . . . . . 53<br />
References . . . . . . . . . . . . . . . . . . . . . . . . . . . . . . . . . . . . . . . . . . . . . . . . . . . . . . . . . . . . . . 55<br />
Suggested citation: Reining, C., K. Beazley, P. Doran and C. Bettigole. <strong>From</strong> <strong>the</strong> <strong>Adirondacks</strong> <strong>to</strong> <strong>Acadia</strong>: A <strong>Wildlands</strong> <strong>Network</strong><br />
Design for <strong>the</strong> Greater Nor<strong>the</strong>rn Appalachians. <strong>Wildlands</strong> Project Special Paper No. 7. Richmond, VT: <strong>Wildlands</strong> Project. 58 pp.<br />
©2006 <strong>Wildlands</strong> Project • August 2006 • Cover pho<strong>to</strong>: Richard Ennis • Design: Kevin Cross
EXECUTIVE SUMMARY<br />
THIS REPORT PRESENTS A PROPOSED WILDLANDS<br />
network design for <strong>the</strong> Greater Nor<strong>the</strong>rn Appalachian<br />
region of <strong>the</strong> nor<strong>the</strong>astern United States and sou<strong>the</strong>astern<br />
Canada. This region spans 388,541 km 2 (96,010,538<br />
acres) and encompasses two ecoregions, <strong>the</strong> Nor<strong>the</strong>rn<br />
Appalachian/<strong>Acadia</strong>n and St. Lawrence/Champlain, and all<br />
or part of ten states and provinces. A network design is a<br />
conservation plan that uses <strong>the</strong> most recent research and<br />
data <strong>to</strong> identify areas of high biological value for very large<br />
regions, integrating core protected areas with wildlife<br />
linkages and economically active stewardship lands. The<br />
wildlands network design is an effective, science-based<br />
model for understanding where land and biodiversity conservation<br />
is both needed and possible.<br />
The current study establishes <strong>the</strong> location and extent<br />
of existing core protected areas, proposed core areas, and<br />
areas of high biological significance. Core protected areas<br />
are highly-irreplaceable areas of concentrated conservation<br />
value and are <strong>the</strong>refore intended <strong>to</strong> be managed with<br />
biodiversity values as <strong>the</strong> primary objective. Areas of high<br />
biological significance (HBS) are lands that we have identified<br />
as having significant conservation value based on<br />
<strong>the</strong> analysis. In general, <strong>the</strong>se areas had somewhat lower<br />
conservation value at a regional scale than ei<strong>the</strong>r existing<br />
or proposed core areas, although <strong>the</strong>y are vital <strong>to</strong> achieving<br />
overall conservation goals. Additional study will be<br />
needed <strong>to</strong> determine <strong>the</strong> precise conservation designation<br />
for <strong>the</strong>se lands. Wildlife linkages have been included in<br />
<strong>the</strong> HBS category.<br />
To establish <strong>the</strong> location and extent of <strong>the</strong> network<br />
design elements, we used three major sources of information:<br />
1) <strong>the</strong> results of a site selection analysis that integrates information<br />
on three major “tracks” of environmental data—focal<br />
species, environmental variation, and special elements; 2) <strong>the</strong><br />
location of The Nature Conservancy’s Tier 1 matrix forest<br />
blocks in <strong>the</strong> Nor<strong>the</strong>rn Appalachian/<strong>Acadia</strong>n ecoregion; and<br />
3) input from experts in <strong>the</strong> states and provinces.<br />
The <strong>to</strong>tal proposed network would encompass<br />
181,519 km 2 (44,835,112 acres) or about 47% of <strong>the</strong><br />
Greater Nor<strong>the</strong>rn Appalachian region. All existing core<br />
protected areas, currently 24,661 km 2 (6,091,267 acres;<br />
6.4% of <strong>the</strong> region), are captured in <strong>the</strong> proposed network.<br />
An additional 42,053 km 2 (10,387,010 acres) in proposed<br />
core areas are identified (10.6 % of <strong>the</strong> region), along with<br />
an additional 114,805 km 2 (28,356,835 acres) of lands of<br />
high biological significance (29.5% of <strong>the</strong> region). Of <strong>the</strong><br />
<strong>to</strong>tal proposed network, about 14% is in existing core protected<br />
areas, 23% is in proposed core areas and <strong>the</strong> remaining<br />
63% is in high biological significance lands. About<br />
33% (60,235 km 2 or 14,878,045 acres) of <strong>the</strong> proposed<br />
network is in status/gap 3 or Public/Crown lands, and<br />
about 53% (96,623 km 2 or 23,865,800 acres) remains privately<br />
held and subject <strong>to</strong> potential development.<br />
When implemented over <strong>the</strong> course of many years, <strong>the</strong><br />
wildlands network design for <strong>the</strong> Greater Nor<strong>the</strong>rn<br />
Appalachians should contribute <strong>to</strong> <strong>the</strong> protection and<br />
res<strong>to</strong>ration of ecological integrity in <strong>the</strong> region. The<br />
strength of this design is its capacity <strong>to</strong> identify <strong>the</strong> major<br />
terrestrial conservation “nodes” in this region and <strong>the</strong><br />
potential linkages among <strong>the</strong>m. <strong>From</strong> a regional perspective,<br />
13 high-priority conservation areas are identified,<br />
including <strong>the</strong> Gaspé Peninsula, nor<strong>the</strong>rn and western<br />
Maine, <strong>the</strong> Chignec<strong>to</strong> Isthmus of Nova Scotia and New<br />
Brunswick, <strong>the</strong> sou<strong>the</strong>rn Lake Champlain valley, and <strong>the</strong><br />
Green Mountains (Vermont)/Sut<strong>to</strong>n Mountains (Québec)<br />
region. The current analysis demonstrates (in conjunction<br />
with o<strong>the</strong>r efforts) that even smaller-scale threats can have<br />
a broader regional effect. By providing a big picture<br />
overview, this study aims <strong>to</strong> help focus conservation efforts<br />
on <strong>the</strong> places and issues, at various scales, with <strong>the</strong> greatest<br />
conservation need. While this network design should be<br />
seen as a living document, <strong>to</strong> be refined as new data and<br />
resources become available, it does provide insights in<strong>to</strong><br />
<strong>the</strong> major regional patterns of high terrestrial conservation<br />
value and landscape linkages. Regardless of future adjustments,<br />
it is unlikely that concentrated areas of <strong>the</strong> most<br />
highly-irreplaceable conservation features at <strong>the</strong> regional<br />
scale identified through this analysis will vary significantly.<br />
[ 2 ]
INTRODUCTION<br />
THIS STUDY EXAMINES A CONSERVATION APPROACH<br />
designed <strong>to</strong> systematically identify a network of areas of high<br />
conservation priority within <strong>the</strong> Nor<strong>the</strong>rn Appalachian/<strong>Acadia</strong>n<br />
and St. Lawrence/Champlain Valley ecoregions of <strong>the</strong><br />
nor<strong>the</strong>astern United States and sou<strong>the</strong>astern Canada (hereafter<br />
<strong>the</strong> Greater Nor<strong>the</strong>rn Appalachians). More specifically,<br />
we identify existing and proposed core protected areas (areas<br />
managed with biodiversity values as <strong>the</strong> primary objective)<br />
that are linked and buffered by areas of high biological significance.<br />
Collectively, <strong>the</strong>se elements should create a conservation<br />
area network—known as a wildlands network<br />
design—<strong>to</strong> protect occurrences of rare species or communities<br />
and o<strong>the</strong>r sites with high ecological values, represent <strong>the</strong><br />
range of environmental variation across <strong>the</strong> study area, and<br />
conserve sufficient habitat <strong>to</strong> support viable populations of<br />
selected focal species.<br />
Effective conservation of biological resources and ecological<br />
systems requires management strategies at multiple<br />
spatial scales, from local-level protection of individual<br />
species or unique environmental features <strong>to</strong> <strong>the</strong> management<br />
of whole landscapes or ecosystems over broad regional scales.<br />
The establishment of a system of ecologically-based conservation<br />
areas may provide an effective strategy for representing<br />
a wide range of biological diversity, as well as providing<br />
a means for persistence of individual species and <strong>the</strong> protection<br />
of biological resources (Trombulak 2003).<br />
Systematic conservation planning (Margules and<br />
Pressey 2000) has recently emerged as a conceptually valid<br />
approach <strong>to</strong> designing a conservation area system <strong>to</strong> achieve<br />
adequate protection of biological resources. Systematic conservation<br />
planning encompasses six steps <strong>to</strong> identify, implement,<br />
moni<strong>to</strong>r, and maintain a system of conservation areas<br />
(Margules and Pressey 2000). These steps are: 1) compilation<br />
of existing data on biological resources within a planning<br />
area and identification of focal species or resources as surrogates<br />
for biodiversity; 2) establishment of specific conservation<br />
features and goals; 3) evaluation of <strong>the</strong> degree <strong>to</strong> which<br />
conservation goals are currently met; 4) explicit and objective<br />
design of new conservation areas; 5) implementation of<br />
on-<strong>the</strong>-ground conservation actions; and 6) maintenance and<br />
moni<strong>to</strong>ring of conservation areas.<br />
One approach <strong>to</strong> <strong>the</strong> conservation of biological diversity<br />
and <strong>the</strong> maintenance and res<strong>to</strong>ration of ecological integrity<br />
follows three broad tracks (Noss 2003). First, <strong>the</strong> environmental<br />
variation track attempts <strong>to</strong> represent <strong>the</strong> full range of<br />
environmental variation across <strong>the</strong> area of interest. This often<br />
includes representing biotic and abiotic conditions as delineated<br />
by ecological classifications. Second, <strong>the</strong> special elements<br />
track attempts <strong>to</strong> protect occurrences of rare species or<br />
communities and o<strong>the</strong>r sites with high ecological values.<br />
Finally, <strong>the</strong> focal species track attempts <strong>to</strong> conserve sufficient<br />
habitat <strong>to</strong> support ecologically viable populations of species<br />
that serve important ecological roles at large spatial scales<br />
and/or are sensitive <strong>to</strong> human activities (Noss and<br />
Cooperrider 1994, Lambeck 1997, Miller et al. 1999, Noss<br />
et al. 1999). While each approach can lead <strong>to</strong> <strong>the</strong> siting of a<br />
conservation area <strong>to</strong> meet specific sets of goals (Noss et al.<br />
1999), <strong>the</strong> integration of <strong>the</strong>se approaches in <strong>the</strong> field of conservation<br />
area design has only recently been applied (e.g.,<br />
Noss et al. 2002, Foreman et al. 2003, Miller et al. 2003,<br />
Jones et al. 2004, Beazley et al. 2005) and should produce a<br />
conservation plan that adequately provides protection for a<br />
wide range of biological diversity (Noss 2003).<br />
Effective conservation planning relies upon explicit, systematic<br />
and efficient methodologies <strong>to</strong> evaluate and rank<br />
myriad scenarios for a conservation area system in a given<br />
landscape (Margules and Pressey 2000). While his<strong>to</strong>ric<br />
methods have often relied upon manual mapping and subjective<br />
decisions regarding <strong>the</strong> location and size of conservation<br />
areas, recent advances in <strong>the</strong> field of conservation area<br />
system design have provided <strong>the</strong> <strong>to</strong>ols necessary <strong>to</strong> evaluate<br />
alternative scenarios (Soulé and Terborgh 1999, Scott et al.<br />
2001, Andelman and Willig 2003, and Rodrigues et al.<br />
2004). <strong>From</strong> a biodiversity-conservation perspective it<br />
makes sense <strong>to</strong> maximize <strong>the</strong> area under some form of conservation,<br />
however social and economic realities rarely make<br />
such expansive conservation possible. The primary aim of <strong>the</strong><br />
conservation area design process <strong>the</strong>n is <strong>to</strong> select <strong>the</strong> minimum<br />
suite of sites that effectively meets designated conservation<br />
goals (Leslie et al. 2003). There are a variety of computer-based<br />
siting algorithms (e.g., simulated annealing,<br />
iterative, optimizing) that are designed <strong>to</strong> meet such goals<br />
(see review in Leslie et al. 2003).<br />
This report summarizes <strong>the</strong> objectives, methods and<br />
results of our conservation area system planning process in<br />
<strong>the</strong> Greater Nor<strong>the</strong>rn Appalachians. We first present a brief<br />
introduction <strong>to</strong> <strong>the</strong> <strong>Wildlands</strong> Project and its approach <strong>to</strong><br />
continental-scale conservation. This is followed by an<br />
overview of <strong>the</strong> Greater Nor<strong>the</strong>rn Appalachians and <strong>the</strong>n by<br />
<strong>the</strong> specific methods used <strong>to</strong> create <strong>the</strong> wildlands network<br />
design for <strong>the</strong> region. We present <strong>the</strong> network design itself<br />
and describe its features, followed by a discussion.<br />
[ 3 ]
WILDLANDS PROJECT MISSION AND MEGALINKAGES<br />
THE MISSION OF THE WILDLANDS PROJECT IS TO<br />
res<strong>to</strong>re and protect <strong>the</strong> natural heritage of North America.<br />
To achieve this end, <strong>the</strong> organization focuses its efforts on<br />
four continental-scale “MegaLinkages” that, when implemented,<br />
will tie North American ecosystems <strong>to</strong>ge<strong>the</strong>r <strong>to</strong><br />
conserve and benefit native species in <strong>the</strong>ir natural patterns<br />
of range and abundance (Figure 1). These four areas are:<br />
1) Pacific MegaLinkage, along <strong>the</strong> west coast from<br />
Baja California <strong>to</strong> Alaska;<br />
2) Spine of <strong>the</strong> Continent MegaLinkage, from Mesoamerica<br />
<strong>to</strong> Alaska through <strong>the</strong> Rocky Mountains and o<strong>the</strong>r<br />
ranges;<br />
3) Atlantic MegaLinkage, from Florida <strong>to</strong> New<br />
Brunswick, mostly along <strong>the</strong> Appalachians; and<br />
4) Boreal MegaLinkage, from Alaska <strong>to</strong> The Canadian<br />
Maritimes across <strong>the</strong> roof of North America.<br />
Each MegaLinkage is comprised of several “<strong>Wildlands</strong><br />
<strong>Network</strong> Designs,” conservation plans that use <strong>the</strong> most<br />
recent research and data <strong>to</strong> identify areas of high biological<br />
value for very large regions. A typical wildlands network<br />
design covers millions of acres or hectares, and identifies<br />
existing and proposed core protected areas that are<br />
functionally linked and buffered by multiple-use lands<br />
that are managed <strong>to</strong> promote conservation goals within<br />
<strong>the</strong> broader network. These networks often cross state,<br />
provincial, municipal and international borders. Several<br />
network designs have been completed within <strong>the</strong> subregions<br />
that comprise <strong>the</strong> Spine of <strong>the</strong> Continent MegaLinkage<br />
(Figure 2). The Greater Nor<strong>the</strong>rn Appalachians network<br />
design is <strong>the</strong> beginning of <strong>the</strong> Atlantic MegaLinkage.<br />
Why Large-Scale Conservation<br />
Why do we need <strong>to</strong> pursue conservation on such a large<br />
scale In short, “global biodiversity is changing at an<br />
unprecedented rate as a complex response <strong>to</strong> several<br />
human-induced changes in <strong>the</strong> global environment. The<br />
magnitude of <strong>the</strong> change is so large and so strongly linked<br />
<strong>to</strong> ecosystem processes and society’s use of natural<br />
resources that biodiversity change is now considered an<br />
important global change in its own right (Sala et al.<br />
2000: 1770).”<br />
Major global change is occurring in land use; climate;<br />
nitrogen deposition and acid rain; invasive and exotic<br />
species (sometimes called “biotic exchange”); and atmospheric<br />
CO 2<br />
concentration. Over <strong>the</strong> next 100 years, land<br />
use change will have <strong>the</strong> most dramatic impacts on biodiversity<br />
in terrestrial habitats, while biotic exchange will<br />
likely be most important in freshwater ecosystems (Sala et<br />
al. 2000).<br />
“In light of <strong>the</strong> dramatic rate at which landscapes are<br />
being changed, perhaps <strong>the</strong> most effective <strong>to</strong>ol for conserving<br />
biodiversity is <strong>the</strong> establishment of reserves. These<br />
areas protect biodiversity by reducing threats <strong>to</strong> <strong>the</strong> persistence<br />
of populations (Lawler et al. 2003: 1762).”<br />
However, in North America, and worldwide, existing systems<br />
of reserves are not doing a good job of conserving <strong>the</strong><br />
full sweep of biodiversity. Recent assessments show that<br />
less than 6% of <strong>the</strong> coterminous United States is in nature<br />
reserves and that most reserves are found at higher elevations<br />
and on less productive soils, even as <strong>the</strong> greatest<br />
number of plant and animal species are found at lower<br />
elevations. Analyses of land-cover types indicate that<br />
approximately 60% of mapped cover types have less than<br />
10% of <strong>the</strong>ir area in nature reserves. Land ownership patterns<br />
show that areas of lower elevation and more productive<br />
soils are most often privately owned and already<br />
extensively converted <strong>to</strong> urban and agricultural uses<br />
(Scott et al. 2001).<br />
Ano<strong>the</strong>r study (Andelman and Willig 2003) illustrates<br />
<strong>the</strong> skewed geographical and size distributions of<br />
protected areas in <strong>the</strong> Western Hemisphere: 811 of 1413<br />
reserves in <strong>the</strong> Western Hemisphere are smaller than 10<br />
km 2 , and 35% of <strong>the</strong> <strong>to</strong>tal area of <strong>the</strong>se reserves is in<br />
Alaska. This study also compiled information on <strong>the</strong><br />
ranges of all bats in <strong>the</strong> continental New World (such data<br />
are not available for all taxa). Bats are a crucial component<br />
of mammalian biodiversity and <strong>the</strong> spatial distribution of<br />
bat species richness parallels that of mammals in general.<br />
Almost 82% of threatened and small-range bat species are<br />
not protected adequately.<br />
North America has also lost many of its native preda<strong>to</strong>rs<br />
in large parts of <strong>the</strong>ir his<strong>to</strong>ric ranges. Wide-ranging<br />
carnivores like wolves and jaguars often play essential roles<br />
in regulating <strong>the</strong> numbers and behavior of prey species<br />
below <strong>the</strong>m in food chains. Such food chains are woven<br />
in<strong>to</strong> complex webs of interaction, and <strong>the</strong> loss of large carnivores<br />
can reverberate through <strong>the</strong>se webs, causing <strong>the</strong><br />
[ 4 ]
FIGURE 1 Map of North American “MegaLinkages.”<br />
[ 5 ]
[ 6 ]<br />
FIGURE 2 Spine of <strong>the</strong> continent megalinkage showing component wildlands network designs.
local disappearance of species and even entire communities<br />
(Estes et al. 1978, Power et al. 1996, Estes et al. 1998,<br />
Rogers and Caro 1998, Soulé and Noss 1998, Henke and<br />
Bryant 1999, Terborgh et al. 1999, Kullberg and Ekman<br />
2000, Soulé et al 2003, Ray et al. 2005, Soulé et al. 2005).<br />
In much of North America, for example, white-tailed deer<br />
and raccoons have become overabundant in <strong>the</strong> absence of<br />
<strong>the</strong>ir preda<strong>to</strong>rs, disrupting plant communities and eliminating<br />
some kinds of birds and small mammals (DeCalesta<br />
1994, Waller and Alverson 1997, McShea and Rappole<br />
1997, McGraw and Furedi 2005).<br />
Preda<strong>to</strong>r res<strong>to</strong>ration may indeed help reverse declines<br />
in <strong>the</strong> condition of biodiversity in a given system, but Ray<br />
(2005: 419) cautions that such opportunities will be best<br />
in “systems where <strong>the</strong> demise of preda<strong>to</strong>rs has been clearly<br />
shown <strong>to</strong> result in adverse ecosystems impacts and<br />
where <strong>the</strong> system has not been importantly degraded by<br />
o<strong>the</strong>r fac<strong>to</strong>rs.” Ray (2005: 419) observes fur<strong>the</strong>r that<br />
In <strong>the</strong> terrestrial realm…where habitat conversion has<br />
brought on so many changes <strong>to</strong> biodiversity, <strong>the</strong> return of<br />
preda<strong>to</strong>rs <strong>to</strong> many places may require lengthy periods of<br />
time, if recovery is achieved at all. However, in all such<br />
systems, res<strong>to</strong>ring <strong>to</strong>p preda<strong>to</strong>rs may still be one important<br />
component of a res<strong>to</strong>ration plan with many o<strong>the</strong>r elements,<br />
and by itself may still nudge along <strong>the</strong> healing process in<br />
some fashion.<br />
Much past conservation has been ad hoc, often driven<br />
by a region’s scenic values or remoteness—as well as<br />
wildlife and natural values. But this approach <strong>to</strong> biological<br />
conservation has left “Canada, <strong>the</strong> United States,<br />
Mexico, and most o<strong>the</strong>r countries with highly fragmented<br />
systems of parks and reserves in which some elements of<br />
<strong>the</strong> native biota are overrepresented and o<strong>the</strong>rs are not represented<br />
at all (Soulé and Terborgh 1999b).” This has<br />
occurred not only in North America but throughout <strong>the</strong><br />
world (Margules and Pressey 2000).<br />
The Promise of <strong>Wildlands</strong> <strong>Network</strong> Designs<br />
One method of addressing gaps in protection and threats<br />
<strong>to</strong> biodiversity is <strong>to</strong> establish large, regional-scale systems<br />
of interconnected core reserves, selected and delineated<br />
in a systematic fashion. To facilitate <strong>the</strong> flow of life<br />
across <strong>the</strong> entire landscape, core areas should be linked<br />
by corridors of wild habitat that allow <strong>the</strong> unimpeded<br />
movement of wildlife and natural processes such as wildfire<br />
and spring floods. These interconnected wildlands<br />
should also be buffered from ecologically-degrading<br />
human activities by areas of compatible use—often<br />
called stewardship lands—where areas of low-impact<br />
farming and forestry complement <strong>the</strong> functions of <strong>the</strong><br />
core areas (Noss and Cooperrider 1994; Trombulak 2001,<br />
2003). The result is a network of core wild areas, functionally<br />
linked across <strong>the</strong> landscape and buffered by wellmanaged<br />
stewardship lands.<br />
The question remains as <strong>to</strong> <strong>the</strong> most efficient means of<br />
creating networks of reserves. There is growing agreement<br />
within <strong>the</strong> conservation community that planning and<br />
action should adhere <strong>to</strong> four key principles (after Pressey<br />
and Margules 2000), addressed in detail below:<br />
■ Establish planning boundaries based on ecological<br />
features;<br />
■ Set clear biodiversity conservation goals within a given<br />
planning boundary;<br />
■ Follow a systematic conservation planning process; and<br />
■ Involve a broad array of stakeholders in design and<br />
implementation.<br />
Establish planning boundaries based on ecological<br />
features MegaLinkages represent <strong>the</strong> first step <strong>to</strong>ward<br />
establishing boundaries based on ecological features: in<br />
this case with regard <strong>to</strong> <strong>the</strong> Appalachian mountain region<br />
of North America. The network designs within this<br />
MegaLinkage should adhere <strong>to</strong> fur<strong>the</strong>r ecological subdivisions.<br />
Since <strong>the</strong> mid-1990s <strong>the</strong>re has been increasing<br />
agreement among conservation scientists as <strong>to</strong> <strong>the</strong> definitions,<br />
boundaries and utility of <strong>the</strong>se ecological divisions,<br />
usually referred <strong>to</strong> as ecoregions (Bailey 1998, Olson et al.<br />
2001, Bailey 2002). As Olson et al. (2001) observe, “conservation<br />
strategies that consider biogeographic units at<br />
<strong>the</strong> scale of ecoregions are ideal for protecting a full range<br />
of representative areas, conserving special elements, and<br />
ensuring <strong>the</strong> persistence of populations and ecological<br />
processes, particularly those that require <strong>the</strong> largest areas<br />
or are most sensitive <strong>to</strong> anthropogenic alterations (Noss et<br />
al. 1999, Soulé and Terborgh 1999a, Groves et al. 2000,<br />
Margules and Pressey 2000).” Accordingly, <strong>the</strong> planning<br />
boundary for <strong>the</strong> current network design exercise encompasses<br />
<strong>the</strong> Nor<strong>the</strong>rn Appalachian/<strong>Acadia</strong>n and St.<br />
Lawrence/Champlain Valley ecoregions.<br />
Set clear biodiversity conservation goals within a<br />
given planning boundary There is also substantial<br />
agreement among conservation biologists as <strong>to</strong> <strong>the</strong> operational<br />
goals necessary for <strong>the</strong> protection and res<strong>to</strong>ration of<br />
life (e.g., Noss and Cooperrider 1994, Trombulak 2001):<br />
[ 7 ]
■ Represent all native ecosystem types and stages;<br />
■ Maintain viable populations of all native species in<br />
natural patterns of abundance and distribution;<br />
■ Maintain ecological and evolutionary processes;<br />
■ Design and manage <strong>the</strong> system <strong>to</strong> be responsive <strong>to</strong><br />
change.<br />
As Trombulak (2001:107) observes, “taken <strong>to</strong>ge<strong>the</strong>r,<br />
<strong>the</strong>se goals encompass all of <strong>the</strong> levels of <strong>the</strong> biological<br />
hierarchy: genes (through an emphasis on viable populations,<br />
since viability is associated with genetic diversity),<br />
species, and communities. Fur<strong>the</strong>r, <strong>the</strong>se goals encompass<br />
all three dimensions of biological organization: composition,<br />
function, and structure. The composition of biological<br />
communities is incorporated by <strong>the</strong> focus on all natural<br />
community types and species, structure by <strong>the</strong> focus on<br />
<strong>the</strong> full range of successional stages, and function by <strong>the</strong><br />
focus on processes and adaptability.” We have incorporated<br />
<strong>the</strong>se operational goals in our network design process<br />
by using a three track approach (special elements, environmental<br />
variation and focal species), setting conservation<br />
goals for <strong>the</strong>se features that reflect those established in<br />
<strong>the</strong> literature, and including key conservation system elements<br />
(core areas, connectivity and buffers).<br />
Follow a systematic conservation process As discussed<br />
above, Margules and Pressey (2000) describe a six step systematic<br />
conservation planning approach <strong>to</strong> identify, implement,<br />
moni<strong>to</strong>r, and maintain a system of conservation areas.<br />
We focus in this analysis on <strong>the</strong> first four of <strong>the</strong>se steps: 1)<br />
compilation of existing data on biological resources within<br />
a planning area and identification of focal species or<br />
resources as surrogates for biodiversity; 2) establishment of<br />
specific conservation features and goals; 3) evaluation of <strong>the</strong><br />
degree <strong>to</strong> which conservation goals are currently met; 4)<br />
explicit and objective design of new conservation areas.<br />
Involve a broad array of stakeholders in design and<br />
implementation It is critical <strong>to</strong> involve regional stakeholders,<br />
scientific and o<strong>the</strong>rwise, in <strong>the</strong> process of designing<br />
and implementing a network design. The draft network<br />
design should also undergo rigorous expert reviews<br />
before a final design is released. We convened a group of<br />
conservation scientists familiar with <strong>the</strong> Greater Nor<strong>the</strong>rn<br />
Appalachians and with <strong>the</strong> <strong>Wildlands</strong> Project’s scientific<br />
methods <strong>to</strong> help guide necessary research and analysis. We<br />
also worked closely with local partners <strong>to</strong> integrate <strong>the</strong>ir<br />
expert knowledge of <strong>the</strong> region in<strong>to</strong> draft designs.<br />
[ 8 ]
FROM THE ADIRONDACKS TO THE MARITIMES<br />
A Regional Overview of <strong>the</strong><br />
Greater Nor<strong>the</strong>rn Appalachians<br />
and Why They Need Protection<br />
and Res<strong>to</strong>ration<br />
VIEWED FROM SPACE AT NIGHT, MUCH OF EASTERN<br />
North America is a bright web of lights. But a few areas<br />
remain dark, unaffected by cities, <strong>to</strong>wns, and roads. Despite<br />
a long his<strong>to</strong>ry of population growth, development, natural<br />
resource extraction, and pollution—pressures that continue<br />
<strong>to</strong>day—a surprising amount of land along <strong>the</strong> eastern edge<br />
of <strong>the</strong> North American continent is still wild. Looking at a<br />
nighttime image this way, <strong>the</strong> big, dark spaces in <strong>the</strong> nor<strong>the</strong>astern<br />
United States and sou<strong>the</strong>astern Canada stand out:<br />
<strong>the</strong> <strong>Adirondacks</strong>, nor<strong>the</strong>rn Maine, <strong>the</strong> Gaspé Peninsula of<br />
Québec, interior New Brunswick and <strong>the</strong> isolated reaches of<br />
Nova Scotia. This extraordinary region, what we call <strong>the</strong><br />
Greater Nor<strong>the</strong>rn Appalachians (Figure 3), represents <strong>the</strong><br />
intersection of <strong>the</strong> cold boreal areas of Canada with <strong>the</strong><br />
warmer temperate forests of <strong>the</strong> eastern United States. The<br />
result is a “transition forest,” a rich blend of species from<br />
north and south. Its rugged <strong>to</strong>pography, complex river systems,<br />
and a long ocean coastline enhance <strong>the</strong> ecological<br />
diversity of <strong>the</strong> region.<br />
The Greater Nor<strong>the</strong>rn Appalachians encompasses all<br />
or part of ten states and provinces (Table 1) and is a combination<br />
of two ecoregions, <strong>the</strong> Nor<strong>the</strong>rn Appalachian/<br />
<strong>Acadia</strong>n Ecoregion and <strong>the</strong> St. Lawrence/Champlain<br />
Valley Ecoregion. The Nor<strong>the</strong>rn Appalachian/<strong>Acadia</strong>n<br />
Ecoregion extends from <strong>the</strong> Tug Hill plateau and<br />
Adirondack Mountains of New York, across <strong>the</strong> Green<br />
Mountains of Vermont and White Mountains of New<br />
Hampshire and in<strong>to</strong> Maine. The ecoregion encompasses all<br />
<strong>the</strong> provinces of Maritime Canada (New Brunswick, Nova<br />
Scotia and Prince Edward Island) as well as <strong>the</strong><br />
Appalachian complex of eastern Québec, extending <strong>to</strong> <strong>the</strong><br />
Gaspé Peninsula and Îles-de-la-Madeleine (Magdalene<br />
Islands) (Anderson et al. 2006). The geographic boundaries<br />
of <strong>the</strong> ecoregion were derived and modified by an<br />
international team of scientists from standard ecological<br />
land classification frameworks in Canada and <strong>the</strong> U.S.<br />
(Omernick, 1987, Bailey et al. 1994, Keys et al., 1995, Li<br />
and Ducruc 1999, Marshall and Schut 1999, ECWG<br />
2003, Neily et al. 2003).<br />
Anderson et al. (2006) describe <strong>the</strong> ecoregion as a<br />
rugged, forested landscape dominated by spruce, maple,<br />
beech, birch, pine, fir, hemlock and oak.<br />
Eighty-two percent of <strong>the</strong> region’s 82 million acres (about<br />
332,000 km 2 ) are covered by roughly equal amounts of<br />
conifer (28 percent), deciduous (24 percent) and mixed<br />
(24 percent) forest types. Presently, about 6 percent (4<br />
million acres, about 16,000 km 2 ) of <strong>the</strong> forest is in an<br />
early successional state, most of that being “working forest”<br />
harvested in <strong>the</strong> last five years. The western and more<br />
sou<strong>the</strong>rly parts of <strong>the</strong> ecoregion in New York and Vermont<br />
are considerably more deciduous in nature than <strong>the</strong> large<br />
nor<strong>the</strong>astern provinces New Brunswick, Nova Scotia and<br />
eastern Québec, which are chiefly coniferous.<br />
There are substantial marine and coastal influences in<br />
<strong>the</strong> <strong>Acadia</strong>n portion of <strong>the</strong> ecoregion. According <strong>to</strong><br />
Ricketts et al. (1999) this is <strong>the</strong> second richest ecoregion<br />
for vertebrate diversity within <strong>the</strong> temperate broadleaf and<br />
mixed forest regions.<br />
The lowlands of <strong>the</strong> Champlain and St. Lawrence valleys<br />
are different enough from <strong>the</strong> Nor<strong>the</strong>rn Appalachian/<br />
<strong>Acadia</strong>n ecoregion <strong>to</strong> constitute a separate ecoregion.<br />
Encompassing major urban centers such as Burling<strong>to</strong>n,<br />
Montreal and Québec City, <strong>the</strong> St. Lawrence/Champlain<br />
ecoregion surrounds <strong>the</strong> <strong>Adirondacks</strong> and separates <strong>the</strong>m<br />
from <strong>the</strong> Tug Hill plateau and <strong>the</strong> main stem of <strong>the</strong><br />
Appalachians. Thompson et al. (2002: 3) detail that <strong>the</strong><br />
ecoregion includes “vast stretches of fertile land, rich woodlands,<br />
vibrant wetlands, dramatic cliffs...and hosts a number<br />
of endemic species as well as more widespread species<br />
at <strong>the</strong> edges of <strong>the</strong>ir ranges. It provides critical habitat for<br />
migra<strong>to</strong>ry birds, breeding grassland birds, and wintering<br />
rap<strong>to</strong>rs. Because of its fertile soils, relatively mild climate,<br />
and stunning scenery, <strong>the</strong> ecoregion has been used by<br />
humans for at least 10,000 years, and very heavily for <strong>the</strong><br />
last 300 of <strong>the</strong>se.” Prior <strong>to</strong> European settlement, <strong>the</strong> fauna<br />
of this region likely resembled that of <strong>the</strong> nearby mountainous<br />
areas, although this has changed dramatically over<br />
centuries of settlement, agriculture and logging. With<br />
75% or more this area now in agricultural production, natural<br />
communities have been reduced greatly in size and are<br />
isolated from one ano<strong>the</strong>r (Kavanagh et al. 2001).<br />
The Greater Nor<strong>the</strong>rn Appalachians (GNA) presents<br />
an extraordinary opportunity for conservation because <strong>the</strong><br />
region has ei<strong>the</strong>r retained or regained a large proportion of<br />
its his<strong>to</strong>rical forest cover (McKibben 1995; Cogbill et al.<br />
[ 9 ]
FIGURE 3 Greater Nor<strong>the</strong>rn Appalachians showing Nor<strong>the</strong>rn Appalachian/<strong>Acadia</strong>n and St. Lawrence/Champlain<br />
Valley ecoregions (Ecoregional boundary source: The Nature Conservancy/Eastern Resource Office).<br />
[ 10 ]
2002). Despite its predominantly wooded condition, however,<br />
<strong>the</strong> habitats and species of this region suffer from a<br />
wide range of ecological impacts and face numerous ongoing<br />
threats. Today’s forests, for example, are far younger<br />
and less diverse than those that used <strong>to</strong> dominate <strong>the</strong> landscape<br />
(Lorimer 1977, Charles et al. 1999, Irland 1999,<br />
Nor<strong>the</strong>rn Forest Alliance 1999, 2002) and several species,<br />
such as <strong>the</strong> passenger pigeon, wolf, wolverine, elk, caribou<br />
and mountain lion, have vanished completely or have been<br />
reduced <strong>to</strong> small populations (Thompson 2002, Carroll<br />
2003, 2005). Climate change and mercury and acid deposition<br />
are also major threats <strong>to</strong> <strong>the</strong> region (Carroll 2005,<br />
Evers 2005, Anderson et al. 2006). Substantial and remote<br />
portions of <strong>the</strong> region face threats from residential development<br />
(Austin 2005) and new and expanded roads, ranging<br />
from subdivision and collec<strong>to</strong>r roads <strong>to</strong> highways, are an<br />
ongoing concern (Baldwin et al. In review). Compounding<br />
<strong>the</strong>se problems is <strong>the</strong> increasingly rapid turnover in ownership<br />
of massive tracts of forestland, particularly in <strong>the</strong> U.S.,<br />
brought on by changes in <strong>the</strong> global forest products industry<br />
and o<strong>the</strong>r fac<strong>to</strong>rs (Hagan et al. 2005, Nor<strong>the</strong>rn Forest<br />
Lands Council 2005). In addition, this region appears <strong>to</strong> be<br />
facing a “latent extinction risk” as described by Cardillo et<br />
al. (2006). These researchers identified areas of <strong>the</strong> world<br />
where mammals have biological traits that make <strong>the</strong>m particularly<br />
sensitive <strong>to</strong> future human impacts, but <strong>the</strong>y are<br />
not yet threatened because such impact is currently low.<br />
Their study identified <strong>the</strong> “Eastern Canadian Forest,”<br />
which encompasses much of <strong>the</strong> Greater Nor<strong>the</strong>rn<br />
Appalachians, as one of those areas of latent extinction risk.<br />
In many cases, quick action by conservationists has<br />
helped secure tens of thousands of acres (or hectares) from<br />
conversion <strong>to</strong> development. Despite <strong>the</strong>se successes, however,<br />
vast tracts of ecologically important lands remain unsecured<br />
from development throughout <strong>the</strong> region (Figure 4).<br />
In <strong>the</strong> Greater Nor<strong>the</strong>rn Appalachians as a whole, lands<br />
permanently secured from conversion <strong>to</strong> development<br />
(LPSCDs) (e.g., Status/Gap 1, 2 and 3 lands, such as public<br />
conservation lands, easements on private lands, Crown lands<br />
in Canada) 1 cover approximately 30% of <strong>the</strong> region (Table 2).<br />
TABLE 1 The Greater Nor<strong>the</strong>rn Appalachians (GNA) as distributed among ten states and<br />
provinces (in km 2 and acres, and as a percentage occupied by <strong>the</strong> state or province).<br />
Ecoregional boundary source: The Nature Conservancy/Eastern Resource Office.<br />
State or Province Km 2 Acres Percent of GNA Region<br />
Maine 76,680 18,948,122 19.7%<br />
Massachusetts 73 18,016 0.0%<br />
New Brunswick 73,087 18,060,252 18.8%<br />
New Hampshire 7,984 1,972,929 2.1%<br />
New York 38,439 9,498,511 9.9%<br />
Nova Scotia 56,015 13,841,696 14.4%<br />
Ontario 13,562 3,351,305 3.5%<br />
Prince Edward Island 5,897 1,457,192 1.5%<br />
Québec 96,785 23,916,037 24.9%<br />
Vermont 20,018 4,946,477 5.2%<br />
Total 388,541 96,010,538 100%<br />
1. The idea of lands permanently secured from conservation <strong>to</strong> development (LPSCDs) emerged during a meeting in February 2006 of scientists associated<br />
with Two Countries, One Forest (2C1Forest), a bi-national collaborative seeking <strong>to</strong> advance conservation in <strong>the</strong> Nor<strong>the</strong>rn Appalachian/<strong>Acadia</strong>n ecoregion.<br />
These scientists realized that “protected areas” or “conservation areas” were inadequate <strong>to</strong> describe <strong>the</strong> wide range of lands that are off limits <strong>to</strong> residential<br />
development but may be subjected <strong>to</strong> a wide range of management practices, some of which, like conversion <strong>to</strong> plantations and clearcutting, may have<br />
substantial effects on biodiversity. The LPSCD term acknowledges this broad range of management regimes within this set of lands that are off-limits <strong>to</strong><br />
residential development. See Crist (2000) for more information on mapping and categorizing land stewardship. LPSCD status levels correspond <strong>to</strong> <strong>the</strong><br />
three main types of conservation land identified under <strong>the</strong> GAP regional species and analysis program, as follows: Status 1—An area having permanent<br />
protection from conversion of natural land cover and a mandated management plan in operation <strong>to</strong> maintain a natural state within which disturbance<br />
events (of natural type, frequency, intensity, and legacy) are allowed <strong>to</strong> proceed without interference or are mimicked through management. Status 2—<br />
An area having permanent protection from conversion of natural land cover and a mandated management plan in operation <strong>to</strong> maintain a primarily natural<br />
state, but which may receive uses or management practices that degrade <strong>the</strong> quality of existing natural communities, including suppression of natural<br />
disturbance. Status 3—An area having permanent protection from conversion of natural land cover for <strong>the</strong> majority of <strong>the</strong> area, but subject <strong>to</strong> extractive<br />
uses of ei<strong>the</strong>r a broad, low-intensity type (e.g., logging) or localized intense type (e.g., mining). It also confers protection <strong>to</strong> federally listed endangered<br />
and threatened species throughout <strong>the</strong> area. (LPSCD data source: TNC/Eastern Resource Office).<br />
[ 11 ]
FIGURE 4 Greater Nor<strong>the</strong>rn Appalachians study boundary, with Status 1, 2 and 3 lands permanently secured from conversion <strong>to</strong> development (LPSCDs). LPSCD coverage<br />
is current as of early 2006, although it does not include some important areas, such as <strong>the</strong> large conservation easements recently established in Downeast Maine.<br />
[ 12 ]
Within <strong>the</strong> GNA region <strong>the</strong>re is broad variation in<br />
<strong>the</strong> extent and distribution of lands secured from development.<br />
Maine, for example, which makes up nearly 20% of<br />
<strong>the</strong> Greater Nor<strong>the</strong>rn Appalachians (refer <strong>to</strong> Table 1), contains<br />
only about 10% of <strong>the</strong>se secured lands (Table 3).<br />
Large blocks of nor<strong>the</strong>rn Maine are in private ownership<br />
with no guarantee of protection from future development.<br />
New York, on <strong>the</strong> o<strong>the</strong>r hand, makes up roughly 10% of<br />
<strong>the</strong> GNA region—about half <strong>the</strong> area of Maine—but it<br />
contains about 12% of <strong>the</strong> lands secured from development,<br />
much of it in <strong>the</strong> <strong>Adirondacks</strong>.<br />
The Wildlife Conservation Society Canada and Two<br />
Countries, One Forest are working <strong>to</strong> understand <strong>the</strong> current<br />
and future threats in <strong>the</strong> region and <strong>to</strong> map <strong>the</strong>m in a<br />
TABLE 2 Extent of Status 1, 2 and 3 lands permanently secured from conversion <strong>to</strong> development (LPSCDs) by state and<br />
province within <strong>the</strong> Greater Nor<strong>the</strong>rn Appalachians study area (Source: TNC/Eastern Resource Office). No extraction of<br />
natural resources is permitted on status 1 and 2 lands. Extraction is permitted on status 3 lands.<br />
Status 1 & 2 (no extraction permitted)<br />
Status 3 (extraction permitted)<br />
State or Province km 2 Acres % of study area km 2 Acres % of study area<br />
Maine 2,199 543,421 0.6% 9,109 2,250,979 2.3%<br />
Massachusetts 0 26 0.0% 24 5,958 0.0%<br />
New Brunswick 2,192 541,573 0.6% 32,308 7,983,539 8.3%<br />
New Hampshire 1,771 437,584 0.5% 2,325 574,459 0.6%<br />
New York 10,196 2,519,392 2.6% 3,373 833,489 0.9%<br />
Nova Scotia 4,492 1,110,104 1.2% 13,500 3,335,972 3.5%<br />
Ontario 17 4,152 0.0% 0 0 0.0%<br />
Prince Edward Island 69 17,118 0.0% 2 529 0.0%<br />
Quebec 3,161 781,003 0.8% 25,377 6,270,859 6.5%<br />
Vermont 650 160,554 0.2% 2,959 731,111 0.8%<br />
Totals 24,746 6,114,927 6.4% 88,978 21,986,896 22.9%<br />
TABLE 3 Status 1, 2 & 3 conservation lands in <strong>the</strong> states and provinces as a percentage of all<br />
conservation lands, and showing <strong>the</strong> ratio of <strong>the</strong> area of LPSCDs in a state or province <strong>to</strong> <strong>the</strong> amount<br />
of land <strong>the</strong> state or province occupies in <strong>the</strong> study area.<br />
Ratio of LPSCDs <strong>to</strong><br />
state/province area<br />
State or Province Status 1 & 2 Status 3 Status 1, 2 & 3 in study area<br />
Maine 8.9% 10.2% 9.9% 0.50<br />
Massachusetts 0.0% 0.0% 0.0% 1.13<br />
New Brunswick 8.9% 36.3% 30.3% 1.61<br />
New Hampshire 7.2% 2.6% 3.6% 1.75<br />
New York 41.2% 3.8% 11.9% 1.21<br />
Nova Scotia 18.2% 15.2% 15.8% 1.10<br />
Ontario 0.1% 0.0% 0.0% 0.00<br />
Prince Edward Island 0.3% 0.0% 0.1% 0.04<br />
Québec 12.8% 28.5% 25.1% 1.01<br />
Vermont 2.6% 3.3% 3.2% 0.62<br />
Totals 100.0% 100.0% 100.0%<br />
[ 13 ]
spatially explicit way. These mapping efforts take <strong>the</strong> form<br />
of <strong>the</strong> Current and Future Human Footprints. Building<br />
upon <strong>the</strong> global methodology developed by <strong>the</strong> Wildlife<br />
Conservation Society and Center for International Earth<br />
Science Information <strong>Network</strong> (Sanderson et al. 2002), <strong>the</strong><br />
Current Human Footprint (CHF) analysis measures direct<br />
human influence on <strong>the</strong> land within <strong>the</strong> ecoregion based<br />
on four categories of Human Influence: Access (roads, rail),<br />
Human Habitation (population density, dwelling density,<br />
urban areas), Human Landuse (agriculture, development,<br />
forestry, mining, large dams) and Electrical Power<br />
Infrastructure (utility corridors). The resulting high resolution<br />
(90 meter) map displays a composite of Human<br />
Influence relative <strong>to</strong> <strong>the</strong> ecoregion that reveals not only <strong>the</strong><br />
remaining wildness and potential ecological linkages<br />
within <strong>the</strong> area, but also identifies potential low-cost<br />
opportunities for conservation action, priority areas for<br />
res<strong>to</strong>ration, and hotspots of human development that present<br />
barriers <strong>to</strong> regional connectivity (Woolmer et al. In<br />
prep.). The Future Human Footprint (FHF) aims <strong>to</strong> forecast<br />
impacts from human development in<strong>to</strong> <strong>the</strong> future.<br />
The FHF is based on scenarios for <strong>the</strong> future growth of<br />
population, roads, and dwellings derived, from geographical<br />
analyses of past patterns and trends as well as modeling<br />
landuse use transitions, highlighting increasing<br />
threats from, amenity-focused development in wild areas<br />
such as around lakeshores.<br />
The threats facing this region, combined with vast<br />
opportunities for conservation and advances in conservation<br />
science, prompted The Nature Conservancy (TNC)<br />
and its partners <strong>to</strong> begin pursuing comprehensive conservation<br />
planning for <strong>the</strong> Nor<strong>the</strong>rn Appalachian/<strong>Acadia</strong>n<br />
and St. Lawrence/Champlain Valley ecoregions in <strong>the</strong> late<br />
1990s (Anderson et al. 1998). A key part of this planning<br />
in <strong>the</strong> Nor<strong>the</strong>rn Appalachian/<strong>Acadia</strong>n ecoregion involved<br />
identifying large representative examples of <strong>the</strong> “matrixforming”<br />
forests (matrix blocks) that dominate <strong>the</strong> landscape<br />
(Anderson et al. 1999; 2006). Many of <strong>the</strong> datasets<br />
developed as part of <strong>the</strong>ir ecoregional planning process<br />
were generously shared with us and have been used <strong>to</strong> create<br />
<strong>the</strong> wildlands network design described in this document.<br />
The processes used by TNC <strong>to</strong> delineate <strong>the</strong> matrix<br />
blocks, and how we <strong>to</strong>ok <strong>the</strong>ir locations in<strong>to</strong> account as we<br />
developed our network design, are described below<br />
(Methods for Creating <strong>the</strong> <strong>Wildlands</strong> <strong>Network</strong> Design)<br />
and in Appendix 1.<br />
[ 14 ]
A WILDLANDS NETWORK DESIGN FOR THE<br />
GREATER NORTHERN APPALACHIANS<br />
Study Area<br />
Our study area consists of <strong>the</strong> intersection of two ecoregions<br />
defined by The Nature Conservancy (TNC), <strong>the</strong> Nor<strong>the</strong>rn<br />
Appalachian/<strong>Acadia</strong>n and <strong>the</strong> St. Lawrence/Champlain<br />
Valley ecoregions, and encompasses 388,541 km 2<br />
(91,145,138 acres) (refer <strong>to</strong> Figure 3). For purposes of site<br />
selection analyses, <strong>the</strong> study area is fur<strong>the</strong>r buffered, extending<br />
in<strong>to</strong> a small portion of <strong>the</strong> Lower New England ecoregion,<br />
south of Lake Champlain and <strong>the</strong> mountains of<br />
Vermont. Despite gaps in uniform data availability for some<br />
of <strong>the</strong>se ecoregions, we chose <strong>to</strong> maintain <strong>the</strong>se study area<br />
and buffer boundaries because important wildlife linkages<br />
likely fall within <strong>the</strong> St Lawrence/Champlain and Lower<br />
New England ecoregions, and buffering is advantageous <strong>to</strong><br />
take in<strong>to</strong> account important contextual information just<br />
outside <strong>the</strong> study area. Data limitations are discussed below.<br />
Three-track Approach <strong>to</strong><br />
Conservation Planning<br />
The conservation planning methodology that we applied<br />
in <strong>the</strong> GNA region focused on environmental variation,<br />
special elements, and focal species, and is described more<br />
fully as follows.<br />
Environmental Variation To represent <strong>the</strong> variation in<br />
ecological conditions that exists across <strong>the</strong> region, we used<br />
a data layer of Ecological Land Units (ELUs) developed by<br />
The Nature Conservancy (TNC) (Anderson et al. 1999,<br />
2006; Groves et al. 2003). ELUs are unique combinations<br />
of three environmental fac<strong>to</strong>rs—elevation, geology and<br />
landform—that are important <strong>to</strong> <strong>the</strong> distribution and<br />
abundance of ecological communities in <strong>the</strong> ecoregion.<br />
Analyses by TNC and its partners indicate that smallerscale<br />
ecosystems, communities and species locations are<br />
highly correlated with <strong>the</strong> types and diversity of ELUs<br />
(Anderson et al. 2006). The original ELU layer provided<br />
by <strong>the</strong> TNC consisted of many hundreds of unique combinations<br />
of elevation, geology and landform. These were<br />
subsequently consolidated in consultation with a TNC<br />
ecologist by combining similar categories within each elevation,<br />
geology and landform class. The final layer consisted<br />
of 162 unique combinations of elevation, geology<br />
and landform (Figure 5, Appendix 2)<br />
Special Elements For our special elements track we used<br />
a geographic data layer of modeled occurrences of small <strong>to</strong><br />
moderately-sized, high-quality ecosystems developed by<br />
<strong>the</strong> Eastern Regional Office of TNC. This database consisted<br />
of nine ecosystem types: Open Wet Basins, Pine<br />
Barrens, Open Dry Flats, Beach Dune, River<br />
Systems/Coves, Floodplain, Forested Wetlands, Steep<br />
Slopes and Cliffs, and Summits. Predicted occurrences of<br />
each of <strong>the</strong> types were first modeled with existing ecological<br />
data. Modeled occurrences were <strong>the</strong>n reviewed by<br />
regional experts and high-quality occurrences of each type<br />
were identified (Anderson et al. 2006). In this study we<br />
used only <strong>the</strong>se high-quality occurrences as input data.<br />
In most such analyses, rare, threatened and endangered<br />
species occurrence data (e.g., G1 [critically imperiled<br />
globally] <strong>to</strong> G3 [vulnerable globally] and S1<br />
[extremely rare at state/province level] <strong>to</strong> S2 [very rare at<br />
state/province level]) as defined by TNC and o<strong>the</strong>r Natural<br />
Heritage programs) are used. However, in <strong>the</strong> case of <strong>the</strong><br />
Greater Nor<strong>the</strong>rn Appalachians study area, our data were<br />
of inconsistent availability and of questionable reliability.<br />
In particular, different species were moni<strong>to</strong>red in each<br />
state and province, and we could not access data for Maine<br />
and <strong>the</strong> Canadian provinces. Consequently, we used<br />
ecosystem occurrences 1) as a surrogate or coarse filter for<br />
<strong>the</strong>se species-based data and 2) <strong>to</strong> represent places of high<br />
conservation value (geographical clusters of diversity and<br />
rarity), as is also consistent with <strong>the</strong> definition of special<br />
elements 2 provided by Noss et al. (1999b). Ideally, if data<br />
sets are reasonably uniform, ei<strong>the</strong>r rare species element<br />
occurrences or modeled occurrences of ecosystems, or both,<br />
could be used as special elements.<br />
Focal Species Focal species planning complements special<br />
elements and representational (or environmental vari-<br />
2.Special elements are species and places of high conservation value such as critical areas for species at risk and geographical clusters of diversity and rarity<br />
(Noss et al. 1999b).<br />
[ 15 ]
[ 16 ]<br />
FIGURE 5 Ecological land units in <strong>the</strong> Nor<strong>the</strong>rn Appalachian/<strong>Acadia</strong>n ecoregion (Data source: The Nature Conservancy/Eastern Resource Office).
ation) approaches <strong>to</strong> <strong>the</strong> wildlands network design process.<br />
Special elements and representation help identify areas <strong>to</strong><br />
include in <strong>the</strong> network, whereas focal species are used primarily<br />
<strong>to</strong> help address how large <strong>the</strong> network components should be<br />
and how <strong>the</strong>y should be configured (Miller et al. 1998). A carefully<br />
selected set of focal species, effectively representing a<br />
broad range of life requisites, can be seen as surrogates for<br />
<strong>the</strong> protection of many o<strong>the</strong>r species.<br />
We used data from a focal-species analysis (Carroll<br />
2003, 2005) that identified areas of high quality (source)<br />
habitat for three species of carnivores: Canada lynx (Lynx<br />
canadensis), American marten (Martes americana), and eastern<br />
gray wolf (Canis lupus, or Canis lycaon [after Wilson et<br />
al. 2000]). These three mammalian carnivores are native <strong>to</strong><br />
<strong>the</strong> study area but are considered threatened or extirpated<br />
in some or all of <strong>the</strong> region. These three species differ in<br />
<strong>the</strong>ir basic habitat requirements and <strong>the</strong> fac<strong>to</strong>rs responsible<br />
for <strong>the</strong>ir decline (Carroll 2005). Vertebrate carnivores<br />
are used as focal species because <strong>the</strong>y are vulnerable or sensitive<br />
<strong>to</strong> human activities and human-induced landscape<br />
change (Weaver et al. 1996, Lambeck 1997, Carroll et al.<br />
2003). Lynx and marten are especially important in <strong>the</strong><br />
Greater Nor<strong>the</strong>rn Appalachians because <strong>the</strong>ir populations<br />
represent “peninsular extensions of broader boreal ranges<br />
(Carroll 2005:3).” As such <strong>the</strong>y may be particularly sensitive<br />
<strong>to</strong> climate change, such as changes in snowfall, and<br />
represent unique ecotypes of <strong>the</strong>se species at <strong>the</strong> sou<strong>the</strong>rn<br />
limit of <strong>the</strong>ir range (Carroll pers. comm. 2006).<br />
In developing <strong>the</strong> focal-species analyses, Carroll, a carnivore<br />
biologist with extensive experience in model development,<br />
obtained focal species data, and derived resourceselection<br />
functions (RSFs) (Boyce and McDonald 1999)<br />
and dynamic, individual-based models (e.g. PATCH,<br />
Schumaker 1998) for <strong>the</strong>se three species. Carroll built on<br />
extensive regional research on wolf (e.g., Harrison and<br />
Chapin 1998, Mladenoff and Sickley 1999, Paquet et al.<br />
1999), lynx (e.g., Hoving 2001, Hoving et al. 2003,<br />
2004, 2005) and marten (e.g., Hepinstall et al. In prep.,<br />
Chapin et al. 1998, Payer and Harrison 2003) <strong>to</strong> provide<br />
analyses of habitat, population viability and conservation<br />
needs for <strong>the</strong> study area.<br />
Though <strong>the</strong> input data varied for each species, <strong>the</strong>y<br />
generally consisted of spatially-explicit predictions of<br />
source habitat and of source habitat threatened under varying<br />
ecological scenarios. 3 Source habitats are areas with<br />
positive predicted population growth rates. For <strong>the</strong> wolf<br />
<strong>the</strong>re are two data layers: 1) predicted source habitat under<br />
current landscape conditions, and 2) predicted threatened<br />
source habitat under a condition of future landscape<br />
change due <strong>to</strong> human population growth. For <strong>the</strong> lynx<br />
<strong>the</strong>re are four data layers. The first pair of data layers consists<br />
of 1a) base scenario prediction of source habitat with<br />
no population cycling, and 1b) predicted threatened<br />
source habitat under scenario with population cycling.<br />
The second pair consists of 2a) base scenario prediction of<br />
source habitat with population cycling and no trapping of<br />
lynx, and 2b) predicted threatened source habitat under<br />
scenario with population cycling and trapping. For <strong>the</strong><br />
American marten, <strong>the</strong>re are also four data layers. The first<br />
pair consists of 1a) base scenario prediction of source habitat<br />
with trapping, and 1b) predicted threatened source<br />
habitat under increased trapping pressure. The second pair<br />
of data layers consists of 2a) base scenario prediction of<br />
source habitat under a scenario of habitat res<strong>to</strong>ration, and<br />
2b) predicted threatened source habitat under a scenario of<br />
timber harvest. In <strong>to</strong>tal, 10 data layers were used <strong>to</strong> represent<br />
<strong>the</strong> habitat requirements for <strong>the</strong> three focal species<br />
(Figure 6). These and o<strong>the</strong>r scenarios are described in more<br />
detail in Carroll (2003, 2005).<br />
Site Selection<br />
As discussed above, effective conservation planning relies<br />
upon explicit, systematic and efficient methodologies <strong>to</strong><br />
evaluate and rank myriad scenarios for a conservation area<br />
system in a given landscape (Margules and Pressey 2000).<br />
Recent advances in <strong>the</strong> field of conservation area system<br />
design have provided <strong>the</strong> <strong>to</strong>ols necessary <strong>to</strong> evaluate alternative<br />
scenarios (Soulé and Terborgh 1999, Scott et al.<br />
2001, Andelman and Willig 2003, and Rodrigues et al.<br />
2004). The primary aim of <strong>the</strong> conservation area design<br />
process is <strong>to</strong> select <strong>the</strong> minimum suite of sites that effectively<br />
meets designated conservation goals (Leslie et al.<br />
2003). While <strong>the</strong>re exist a variety of computer-based siting<br />
algorithms (e.g., simulated annealing, iterative, optimizing)<br />
that are designed <strong>to</strong> meet a set of conservation<br />
goals based on a set of conservation features or targets (see<br />
3. Threatened source habitat represents areas that occupy <strong>the</strong> upper right quadrant of irreplaceability/vulnerability graphs developed as part of <strong>the</strong> spatially<br />
explicit population modeling. Irreplaceability in this context is <strong>the</strong> relative value of an area as source habitat for a given species. Vulnerability is <strong>the</strong> likelihood<br />
that a site’s conservation value will be reduced over time. Values were plotted on a graph of irreplaceabiity (y-axis) versus vulnerability (x-axis),<br />
and <strong>the</strong> graph is divided in<strong>to</strong> four quadrants. The upper right quadrant includes sites with high irreplaceability and high vulnerability – threatened<br />
sources. These areas remain source habitat even under <strong>the</strong> threat scenarios. See Carroll (2005) and Carroll et al. (2003) for a detailed discussion.<br />
[ 17 ]
[ 18 ]<br />
FIGURE 6 Predicted source and threatened source habitats for three focal species (Data source: Carroll 2003, 2005).
eview in Leslie et al. 2003), <strong>the</strong> simulated annealing algorithm<br />
has been shown <strong>to</strong> meet conservation goals more<br />
effectively than o<strong>the</strong>r approaches (Ball 2000, Possingham<br />
et al. 2000), so we use that algorithm in this analysis.<br />
For each of <strong>the</strong> 181 conservation features (162 for<br />
environmental variation, 9 for special elements, and 10 for<br />
focal species), we compiled spatial data and set conservation<br />
goals (described below in Conservation Goals). Site<br />
selection software was used <strong>to</strong> generate alternative reserve<br />
design solutions, specifically MARXAN (v1.8.2), a software<br />
program for site selection (Ball and Possingham<br />
2000; Possingham et al. 2000). MARXAN allows for <strong>the</strong><br />
use of a spatially explicit simulated annealing optimization<br />
method <strong>to</strong> find a set of planning units that meets<br />
identified conservation goals while minimizing costs. The<br />
objective function used by MARXAN’s simulated annealing<br />
algorithm (hereafter referred <strong>to</strong> as a MARXAN analysis)<br />
is as follows:<br />
TotalCost= ∑Cost+BLM ∑ Boundary+ ∑ CFPF *<br />
Sites<br />
Sites ConValue<br />
Penalty+CostThresholdPenalty(t)<br />
In this equation, TotalCost is <strong>the</strong> <strong>to</strong>tal cost of <strong>the</strong><br />
reserve system used <strong>to</strong> compare alternative solutions; Cost<br />
is a measure of <strong>the</strong> cost, often <strong>the</strong> area, of each of <strong>the</strong> sites<br />
within <strong>the</strong> reserve system; Boundary is <strong>the</strong> length of <strong>the</strong><br />
boundary of <strong>the</strong> reserve system; BLM is <strong>the</strong> user defined<br />
boundary length modifier; CFPF, or conservation feature<br />
penalty fac<strong>to</strong>r, is <strong>the</strong> penalty fac<strong>to</strong>r for not reaching a conservation<br />
goal; and CostThresholdPenalty is a penalty<br />
added if <strong>the</strong> cost is exceeded. These MARXAN parameters<br />
are discussed in more detail below. The TotalCost of a specific<br />
simulated annealing run can <strong>the</strong>n be compared <strong>to</strong><br />
o<strong>the</strong>r such runs within <strong>the</strong> same set of input parameters,<br />
or across different sets of input parameters.<br />
Planning Units<br />
The aim of <strong>the</strong> reserve design process is <strong>to</strong> select a suite of<br />
planning units that, when incorporated in<strong>to</strong> a reserve system,<br />
meets a set of predetermined conservation goals. The<br />
process for setting conservation goals is described below.<br />
Planning units are <strong>the</strong> spatial areas in<strong>to</strong> which <strong>the</strong> study<br />
area is divided for <strong>the</strong> purposes of analyses and with which<br />
<strong>the</strong> data are associated, typically as hexagonal or square<br />
grid cells of a consistent size. In our study, we chose a<br />
hexagonal planning unit with a size of 1000 hectares (about<br />
2471 acres). The hexagonal shape provides a number of<br />
benefits. First, it approximates a circle and provides <strong>the</strong><br />
benefits of relatively smooth coverage of <strong>the</strong> planning area<br />
and a low edge-<strong>to</strong>-area ratio. Second, <strong>the</strong> smaller size will<br />
maximize <strong>the</strong> amount of internal homogeneity of a given<br />
planning unit and thus help increase <strong>the</strong> efficiency of <strong>the</strong><br />
site selection algorithm. Third, when <strong>the</strong> hexagons are relatively<br />
small, it will be easier <strong>to</strong> adapt <strong>the</strong> outputs of <strong>the</strong><br />
site selection algorithm <strong>to</strong> political boundaries and natural<br />
features (e.g., watersheds). The 1000 hectare (ha) size was<br />
sufficient <strong>to</strong> be larger than <strong>the</strong> coarsest data input, yet small<br />
enough <strong>to</strong> be useful for on-<strong>the</strong>-ground conservation efforts.<br />
Finally, it is adequately large <strong>to</strong> result in a manageable<br />
number of planning units across <strong>the</strong> study area so as <strong>to</strong> not<br />
exceed <strong>the</strong> computational limits of <strong>the</strong> software.<br />
An integral part of a systematic approach <strong>to</strong> <strong>the</strong><br />
design of reserve systems is <strong>to</strong> evaluate <strong>the</strong> conservation<br />
status of planning units, specifically <strong>to</strong> identify existing<br />
protected areas as well as those areas unavailable <strong>to</strong> conservation<br />
efforts. The MARXAN software allows for individual<br />
planning units <strong>to</strong> be au<strong>to</strong>matically included or<br />
excluded from <strong>the</strong> reserve design solution. One option is<br />
<strong>to</strong> “fix” or “lock” individual planning units in<strong>to</strong> <strong>the</strong> initial<br />
reserve, and consequently, during <strong>the</strong> simulated annealing<br />
process, <strong>the</strong> planning units will be “fixed” in<strong>to</strong> <strong>the</strong> final<br />
solution. Ano<strong>the</strong>r option is <strong>to</strong> fix/lock individual planning<br />
units out of <strong>the</strong> initial reserve and, during <strong>the</strong> simulated<br />
annealing process, <strong>the</strong> planning units will be excluded<br />
from <strong>the</strong> final solutions.<br />
To designate whe<strong>the</strong>r an individual planning unit<br />
should be fixed in <strong>the</strong> reserve design, we used existing<br />
information on <strong>the</strong> distribution of lands permanently<br />
secured from conservation <strong>to</strong> development (LPSCDs,<br />
Figure 4). We locked in<strong>to</strong> <strong>the</strong> reserve design analyses all<br />
hexagons with LPSCD Status 1 or 2 comprising >= 75%<br />
of <strong>the</strong> 1000 ha hexagon. All hexagons with >= 50% of <strong>the</strong><br />
1000 ha hexagon in urban zones, as derived from ESRI<br />
(2002) datasets, were locked out of <strong>the</strong> reserve design<br />
analyses. This serves <strong>to</strong> exclude areas whose current state<br />
of land conversion or development offers few opportunities<br />
for conservation even though <strong>the</strong>y may potentially represent<br />
conservation features.<br />
In preliminary site selection runs we also examined a<br />
number of runs without locking in hexagons meeting <strong>the</strong><br />
protected area cut-off. Site selection results with protected<br />
areas locked in or out did not visibly differ from one ano<strong>the</strong>r.<br />
Given few visible differences, we chose only <strong>to</strong> examine<br />
runs with protected areas locked in<strong>to</strong> <strong>the</strong> final solution.<br />
[ 19 ]
Sensitivity Analysis<br />
Within <strong>the</strong> conservation area design process, a number of<br />
input parameters influence <strong>the</strong> final conservation area<br />
design, such as <strong>the</strong> choice of conservation features, specific<br />
goals for those features, or <strong>the</strong> weight given <strong>to</strong> fragmentation<br />
(or spatial cohesiveness) parameters. It thus<br />
becomes vital <strong>to</strong> assess <strong>the</strong> sensitivity of <strong>the</strong> selection<br />
process <strong>to</strong> variations in certain input parameters. To investigate<br />
<strong>the</strong> sensitivity of <strong>the</strong> site selection process <strong>to</strong> variations<br />
in two primary input parameters, we examined <strong>the</strong><br />
sensitivity of <strong>the</strong> algorithm <strong>to</strong> variations in conservation<br />
goals by setting four different combinations of conservation<br />
goals, as described below. Second, we examined <strong>the</strong><br />
sensitivity <strong>to</strong> variations in <strong>the</strong> algorithm’s boundary<br />
length modifier (BLM) a parameter that influences <strong>the</strong> spatial<br />
cohesiveness of <strong>the</strong> planning units, and thus <strong>the</strong> configuration<br />
of <strong>the</strong> network. We conducted <strong>the</strong>se analyses<br />
with <strong>the</strong> goal of identifying planning units within a conservation<br />
area system that were relatively insensitive <strong>to</strong><br />
variations in <strong>the</strong>se two parameters.<br />
MARXAN Parameters<br />
MARXAN allows <strong>the</strong> user <strong>to</strong> cus<strong>to</strong>mize a range of model<br />
parameters, and <strong>the</strong>reby influence kinds of outputs produced<br />
by <strong>the</strong> model. We describe below four of <strong>the</strong> key<br />
parameters that we varied in <strong>the</strong> course of this analysis:<br />
site cost, species penalty fac<strong>to</strong>r, boundary length modifier,<br />
and goals for various conservation features.<br />
Site Cost The cost of including an individual planning<br />
unit in<strong>to</strong> <strong>the</strong> final reserve design is considered in <strong>the</strong> calculation<br />
of <strong>the</strong> <strong>to</strong>tal portfolio cost. This cost can be <strong>the</strong><br />
monetary cost of <strong>the</strong> land, but such information is not uniformly<br />
available at <strong>the</strong> scale of <strong>the</strong> study area, so we<br />
assigned each planning unit a cost = 1. Under this designation,<br />
<strong>the</strong> model <strong>to</strong>tal portfolio cost is driven by <strong>the</strong> conservation<br />
features and <strong>the</strong> model will seek <strong>to</strong> minimize <strong>the</strong><br />
area of <strong>the</strong> final conservation portfolio.<br />
Species Penalty Fac<strong>to</strong>r In addition <strong>to</strong> assigning a cost<br />
<strong>to</strong> individual planning units, MARXAN allows <strong>the</strong> user<br />
<strong>to</strong> assign a penalty fac<strong>to</strong>r <strong>to</strong> individual features for not<br />
meeting conservation goals. For all ELU and special elements<br />
features, we assigned a species penalty fac<strong>to</strong>r = 1.<br />
We altered this assignment, however, for <strong>the</strong> focal species<br />
where we had two features for <strong>the</strong> wolf and four features<br />
for <strong>the</strong> lynx and American marten. Here, we assigned each<br />
of <strong>the</strong> four lynx and four American marten features a<br />
penalty fac<strong>to</strong>r = 1, and assigned <strong>the</strong> two wolf features a<br />
penalty fac<strong>to</strong>r = 2, essentially weighing <strong>the</strong> wolf features<br />
equal <strong>to</strong> <strong>the</strong> lynx and American marten features.<br />
Boundary Length Fragmentation of habitat and reserves<br />
frequently has detrimental effects on <strong>the</strong> health of such<br />
reserves and <strong>the</strong>ir ability <strong>to</strong> support biological diversity<br />
(Newmark 1985, 1995; Paquet and Callahan 1996,<br />
Gibeau and Heuer 1996, Forman et al. 1997). In a reserve<br />
system, one measure of fragmentation is <strong>the</strong> length of <strong>the</strong><br />
reserve boundary relative <strong>to</strong> <strong>the</strong> area of <strong>the</strong> reserve. For a<br />
given <strong>to</strong>tal area of a reserve system, a longer <strong>to</strong>tal boundary<br />
length would be characteristic of a fragmented system,<br />
while a shorter length would characterize a relatively<br />
unfragmented reserve. MARXAN allows <strong>the</strong> user <strong>to</strong> control<br />
<strong>the</strong> degree of fragmentation or spatial cohesiveness in<br />
a reserve design by including a boundary length modifier<br />
in <strong>the</strong> objective function.<br />
To explore <strong>the</strong> effects of <strong>the</strong> boundary length modifier<br />
(BLM) on <strong>the</strong> reserve design, we varied <strong>the</strong> value of <strong>the</strong><br />
BLM in our analyses. After initial trial runs <strong>to</strong> determine<br />
workable values, we chose <strong>to</strong> run reserve design analyses<br />
using three boundary length modifier values: 0, 0.001,<br />
and 0.01. This range of values balances <strong>the</strong> benefits in flexibility<br />
and efficiency of using an unrestricted run (i.e., 0,<br />
which has no influence over clumping) with levels of spatial<br />
cohesion more realistic for ecological functioning such<br />
as species dispersal and migration.<br />
Conservation Goals Conservation goal setting presents<br />
many challenges, especially with <strong>the</strong> increasing emphasis<br />
on considering conservation at multiple spatial scales (Tear<br />
et al. 2005). Ideally one would establish a single quantitative<br />
goal for a given conservation feature based on extensive<br />
understanding of <strong>the</strong> needs of a given species or<br />
ecosystem. These data are rarely available, however, especially<br />
for more than 180 individual conservation features,<br />
so we adapted a method used by researchers modeling<br />
marine protected areas off <strong>the</strong> coast of British Columbia<br />
(Ardron 2003). Accordingly, ra<strong>the</strong>r than use a single set of<br />
parameters, we chose a range of scenarios based on different<br />
boundary length modifiers and goals for given targets.<br />
<strong>From</strong> <strong>the</strong>se, we <strong>the</strong>n examined <strong>the</strong> results for trends,<br />
focusing on areas that emerge under a variety of conditions.<br />
Those areas that are selected repeatedly can be interpreted<br />
as having a high utility or usefulness for <strong>the</strong> overall<br />
design. While <strong>the</strong>y may not necessarily meet all <strong>the</strong> goals,<br />
[ 20 ]
<strong>the</strong>se areas of high overlap provide clear guidance as <strong>to</strong><br />
where initial conservation efforts should be directed. The<br />
individual scenarios can also be used <strong>to</strong> provide guidance<br />
for areas that are not selected repeatedly but that may contribute<br />
<strong>to</strong> <strong>the</strong> overall network design.<br />
We set high, medium and low goals for each feature<br />
(Table 4) based on consultations with experts in site selection<br />
analysis and on goal levels in o<strong>the</strong>r studies that used a<br />
simulated annealing site selection algorithm (e.g., Carroll<br />
et al. 2003, Leslie et al. 2003; Foreman et al. 2003; Jones<br />
et al. 2004). We <strong>the</strong>n associated each of <strong>the</strong> goal levels with<br />
<strong>the</strong> three boundary modifier values described above (Table<br />
5). Additional scenarios were defined combining high<br />
(focal species and special element) and low (environmental<br />
variation) goals. In <strong>to</strong>tal <strong>the</strong>se combinations of goal levels<br />
and boundary modifiers comprise <strong>the</strong> site selection rules for<br />
12 distinct scenarios. All goals were applied <strong>to</strong> <strong>the</strong> study<br />
area as a whole; no sub-regional goals were set.<br />
MARXAN Runs & Summary Statistics For each of <strong>the</strong><br />
12 scenarios, we ran <strong>the</strong> model 100 times, each with<br />
1,000,000 annealing iterations. Each scenario produced<br />
TABLE 4 Percentage goals for each conservation feature.<br />
Feature Low goal Medium goal High goal<br />
Focal species<br />
Wolf<br />
1. Source habitat under current landscape conditions 40% 50% 60%<br />
2. Threatened source habitat under future landscape change scenario 40% 50% 60%<br />
Lynx<br />
1a. Base scenario prediction of source habitat with no population cycling 40% 50% 60%<br />
1b. Threatened source habitat under scenario with population cycling 40% 50% 60%<br />
2a. Base scenario prediction of source habitat with population cycling and 40% 50% 60%<br />
no trapping of lynx<br />
2b. Threatened source habitat with population cycling and trapping of lynx 40% 50% 60%<br />
American marten<br />
1a. Base scenario prediction of source habitat with trapping 40% 50% 60%<br />
1b. Threatened source habitat under increased trapping pressure 40% 50% 60%<br />
2a. Base scenario prediction of source habitat under scenario of habitat res<strong>to</strong>ration 40% 50% 60%<br />
2b. Threatened source habitat under scenario of timber harvest 40% 50% 60%<br />
Environmental variation (Ecological Land Units) 5–20%* 25–40%* 45–60%*<br />
Special elements<br />
Open wet basins 50% 66% 75%<br />
Barrens: Pine 50% 66% 75%<br />
Barrens: Open Dry Flats 50% 66% 75%<br />
Beach Dune 50% 66% 75%<br />
River Systems/Coves 50% 66% 75%<br />
Floodplain 50% 66% 75%<br />
Forested Wetlands 50% 66% 75%<br />
Steep Slopes and Cliffs 50% 66% 75%<br />
Summits 50% 66% 75%<br />
* Percentage goals for ELUs vary with rarity, with rarer ELU types having <strong>the</strong> highest and common types having <strong>the</strong> lowest.<br />
[ 21 ]
two outputs. First, MARXAN selected <strong>the</strong> single run (of<br />
<strong>the</strong> 100 <strong>to</strong>tal runs) that best met <strong>the</strong> conservation feature<br />
goals while minimizing <strong>the</strong> cost. This is termed <strong>the</strong> “Best<br />
Run.” MARXAN also tallies <strong>the</strong> number of times each<br />
individual planning unit is selected in each of <strong>the</strong> 100<br />
runs. This summary is termed <strong>the</strong> “Summed Runs” output.<br />
The summed runs output can also be thought of as<br />
summed “irreplaceability,” defined as <strong>the</strong> “extent <strong>to</strong> which<br />
<strong>the</strong> loss of <strong>the</strong> area will compromise regional conservation<br />
targets (Margules and Pressey 2000).” An area that scores<br />
highly in <strong>the</strong> summed runs output might not be included<br />
in <strong>the</strong> best solution, but could be considered an alternative<br />
site (Carroll et al. 2003).<br />
Due <strong>to</strong> our interest in controlling for variation in <strong>the</strong><br />
boundary length modifier and <strong>the</strong> goal levels, we calculated<br />
an additional summary variable. For all of <strong>the</strong> 12 scenarios,<br />
we summed <strong>the</strong> summed runs outputs. We call this<br />
output “summed-summed run.” Therefore, each planning<br />
unit could potentially have been selected from 0–1200<br />
runs. Those planning units selected a majority of times, as<br />
well as those selected infrequently, demonstrate a relative<br />
insensitivity <strong>to</strong> changes in <strong>the</strong> boundary length modifier<br />
and <strong>the</strong> goals. Thus, as discussed above, those areas that<br />
are selected repeatedly can be interpreted as having a high<br />
utility or usefulness for <strong>the</strong> overall design. Those planning<br />
units selected a moderate number of times are more sensitive<br />
<strong>to</strong> <strong>the</strong> input parameters, but still contribute <strong>to</strong> meeting<br />
<strong>the</strong> goals of <strong>the</strong> reserve design.<br />
Data Limitations<br />
With <strong>the</strong> assistance of The Nature Conservancy and its<br />
partners, we were able <strong>to</strong> assemble uniform data coverages<br />
for <strong>the</strong> tracks (representation, special elements, focal<br />
species) discussed above for <strong>the</strong> Nor<strong>the</strong>rn Appalachian/<br />
<strong>Acadia</strong>n portion of <strong>the</strong> region. We were not able, however,<br />
<strong>to</strong> obtain <strong>the</strong> following uniform datasets for incorporation<br />
in<strong>to</strong> <strong>the</strong> site selection analysis:<br />
■ land-use/land-cover (<strong>the</strong>se data were incorporated<br />
in<strong>to</strong> <strong>the</strong> focal species analyses, so <strong>the</strong>y do have some<br />
influence on <strong>the</strong> results, albeit not as a distinct conservation<br />
feature or target for which goals could be<br />
established);<br />
■ special element occurrences, such as G1/G2 or S1/S2<br />
species at <strong>the</strong> state and provincial level;<br />
■ TNC’s Tier 1 matrix forest blocks in <strong>the</strong> Nor<strong>the</strong>rn<br />
Appalachian/<strong>Acadia</strong>n ecoregion (we were able <strong>to</strong><br />
incorporate <strong>the</strong> matrix blocks in<strong>to</strong> <strong>the</strong> post site selection<br />
process of network design, as described below);<br />
■ data on most coastal shore and wetland ecosystems; and<br />
■ aquatic features.<br />
Focal species data were available for <strong>the</strong> lowland St.<br />
Lawrence/Champlain Valley ecoregion, and for a very<br />
small portion of <strong>the</strong> Lower New England ecoregion, but<br />
uniform data sets for representation and special elements<br />
were not available for those ecoregions.<br />
As a result of <strong>the</strong>se data gaps and <strong>the</strong> regional-scale<br />
TABLE 5 General goals for each conservation feature.<br />
Goal: Goal: Goal: Boundary<br />
Focal Environmental Special Length<br />
Scenario Species Variation Elements Modifier<br />
Low 1 Low Low Low 0.0<br />
2 Low Low Low 0.001<br />
3 Low Low Low 0.01<br />
Medium 4 Medium Medium Medium 0.0<br />
5 Medium Medium Medium 0.001<br />
6 Medium Medium Medium 0.01<br />
High-Low 7 High Low High 0.0<br />
8 High Low High 0.001<br />
9 High Low High 0.01<br />
High 10 High High High 0.0<br />
11 High High High 0.001<br />
12 High High High 0.01<br />
[ 22 ]
focus of our analyses, it is likely that we have not identified<br />
important smaller-scale habitats that warrant protection.<br />
The results of o<strong>the</strong>r, finer scale mapping efforts will<br />
identify additional important local areas of conservation,<br />
especially in coastal areas.<br />
Results of <strong>the</strong> Site Selection Analysis<br />
Below we present <strong>the</strong> results for <strong>the</strong> series of best runs<br />
(Table 6, Figure 7). In each of <strong>the</strong> 12 scenarios, <strong>the</strong> relevant<br />
goal levels (low, medium, high-low and high) are met<br />
for all conservation features. 4 The 12 scenarios in Figure 7<br />
are arranged such that <strong>the</strong> <strong>to</strong>p three are those with <strong>the</strong><br />
lowest goals, <strong>the</strong> middle two rows meet medium and<br />
high-low goals, respectively, and <strong>the</strong> bot<strong>to</strong>m row meets<br />
<strong>the</strong> highest goals. Similarly, <strong>the</strong> scenarios are arranged<br />
from left <strong>to</strong> right, such that <strong>the</strong> left column contains those<br />
with no boundary modifier (no clumping rules [0.0]),<br />
those in <strong>the</strong> middle column have medium clumping rules<br />
(0.001), and those in <strong>the</strong> right-hand column have higher<br />
clumping rules (0.01).<br />
The amount of area encompassed in a given best run<br />
varies considerably based on <strong>the</strong> combination of goal scenario<br />
and boundary length modifier. For <strong>the</strong> lowest set of<br />
goals, with no boundary length modifier (scenario 1), <strong>the</strong><br />
best run encompasses 81,836 km 2 (20,222,080 acres), or<br />
about 21% of <strong>the</strong> study area. Increasing <strong>the</strong> boundary<br />
length modifier <strong>to</strong> 0.001, and <strong>the</strong>refore <strong>the</strong> spatial cohesiveness<br />
or “clumpiness” of <strong>the</strong> output, while maintaining<br />
<strong>the</strong> same (low) goals, increases <strong>the</strong> best run area <strong>to</strong> 97,485<br />
km 2 (24,088,960 acres) or 25.2% of <strong>the</strong> study area (scenario<br />
2). The highest goals, without a boundary length<br />
modifier (scenario 10), increase <strong>the</strong> area of <strong>the</strong> output <strong>to</strong><br />
64,472 km 2 (41,262,080 acres), more than double <strong>the</strong> area<br />
of <strong>the</strong> lowest goal/boundary length modifier combination.<br />
As would be expected, <strong>the</strong> highest goals with <strong>the</strong> highest<br />
boundary length modifier (scenario 12) requires <strong>the</strong> highest<br />
area of all <strong>the</strong> scenarios, 50.5% of <strong>the</strong> study area.<br />
We also intersected <strong>the</strong> best run for each scenario with<br />
<strong>the</strong> corresponding summed run result for each scenario,<br />
<strong>the</strong>n classified <strong>the</strong> results as <strong>to</strong> how frequently a given<br />
planning unit was selected (Figure 8). These intersected<br />
outputs provide additional insight in<strong>to</strong> <strong>the</strong> relative importance<br />
or irreplaceability of a particular planning unit within<br />
a given scenario. That is, <strong>the</strong> more frequently a given<br />
planning unit is selected, <strong>the</strong> more it contributes <strong>to</strong> satisfying<br />
<strong>the</strong> goals set for <strong>the</strong> conservation features (put anoth-<br />
TABLE 6 Best runs under each MARXAN scenario, by area (km 2 , acres, and square miles) and as a<br />
percentage of <strong>the</strong> Greater Nor<strong>the</strong>rn Appalachian study area.<br />
Boundary<br />
Length<br />
Modifier Best Run Best Run Best Run % of<br />
Scenario Goals (BLM) (km 2 ) (sq. mi.) (acres) study area<br />
1 Low 0 81,836 31,597 20,222,080 21.1%<br />
2 Low 0.001 97,485 37,639 24,088,960 25.2%<br />
3 Low 0.01 123,721 47,769 30,572,160 31.9%<br />
4 Med 0 114,959 44,386 28,407,040 29.7%<br />
5 Med 0.001 131,217 50,663 32,424,320 33.9%<br />
6 Med 0.01 159,035 61,404 39,298,560 41.1%<br />
7 High-Low-High 0 122,358 47,243 30,235,520 31.6%<br />
8 High-Low-High 0.001 141,228 54,528 34,897,920 36.5%<br />
9 High-Low-High 0.01 172,540 66,618 42,635,520 44.5%<br />
10 High 0 166,980 64,472 41,262,080 43.1%<br />
11 High 0.001 176,427 68,119 43,596,160 45.5%<br />
12 High 0.01 195,815 75,604 48,386,560 50.5%<br />
4. There are a <strong>to</strong>tal of 2172 combinations of conservation features and goals (12 goal scenarios * 181 features). Although 23 of <strong>the</strong>se combinations did not<br />
meet 100% of <strong>the</strong>ir goals, in <strong>the</strong>se instances >99.9% of <strong>the</strong> goal was met, essentially meeting <strong>the</strong> 100% goal.<br />
[ 23 ]
[ 24 ]<br />
FIGURE 7 Map composition showing MARXAN best run for each scenario. Green planning units are those that were locked-in because <strong>the</strong>y contain status 1 and 2 LPSCDs.
FIGURE 8 Map composition showing MARXAN best run for each scenario intersected with corresponding summed run. Orange colors indicate planning<br />
units selected greater than 50% of <strong>the</strong> time. Green planning units are those that were locked-in because <strong>the</strong>y contain status 1 and 2 LPSCDs.<br />
[ 25 ]
FIGURE 9 Summed-summed run output. This output sums <strong>the</strong> summed run outputs of all 12 scenarios. Orange colors show those planning units<br />
selected greater than 50% of <strong>the</strong> time in all scenarios. Green planning units are those that were locked in because <strong>the</strong>y contain status 1 and 2 LPSCDs.<br />
[ 26 ]
er way, <strong>the</strong> more frequently a planning unit is selected, <strong>the</strong><br />
more irreplaceable it is), so we want <strong>to</strong> pay special attention<br />
<strong>to</strong> those units selected most frequently in developing<br />
our network design.<br />
Finally, we combined <strong>the</strong> summed runs for all 12 scenarios<br />
<strong>to</strong> create <strong>the</strong> summed-summed run output (Figure<br />
9), and similarly classified <strong>the</strong>se results by frequency of<br />
planning unit selection. These results show <strong>the</strong> relative<br />
importance of each planning unit for meeting <strong>the</strong> goals<br />
regardless of <strong>the</strong> scenario displayed.<br />
Methods for Creating <strong>the</strong><br />
<strong>Wildlands</strong> <strong>Network</strong> Design<br />
<strong>From</strong> Decision-support <strong>to</strong> Decision-making The output<br />
from <strong>the</strong> MARXAN analyses provides useful information<br />
<strong>to</strong> support decisions about <strong>the</strong> location and extent of<br />
<strong>the</strong> elements of a wildlands network design. However,<br />
since <strong>the</strong>re are several potential solutions, additional steps<br />
need <strong>to</strong> be taken <strong>to</strong> incorporate local knowledge, and o<strong>the</strong>r<br />
data that may not have been captured by <strong>the</strong> site selection<br />
algorithm, <strong>to</strong> make defensible decisions regarding <strong>the</strong> network<br />
design.<br />
Defining <strong>the</strong> <strong>Network</strong> Elements In <strong>the</strong>ory, a wildlands<br />
network design should be comprised of core wild areas,<br />
wildlife linkages and stewardship (or compatible use)<br />
lands. As described below, we were able <strong>to</strong> identify numerous<br />
new potential core areas. However, as we proceeded<br />
with <strong>the</strong> design, we found it difficult <strong>to</strong> distinguish<br />
between linkages and stewardship lands. We decided,<br />
<strong>the</strong>refore, <strong>to</strong> combine <strong>the</strong>se elements in<strong>to</strong> a single classification:<br />
“High Biological Significance (HBS).” This term<br />
has been used in o<strong>the</strong>r wildlands network designs (e.g.<br />
Foreman et al. 2003). Accordingly, we use <strong>the</strong> following<br />
elements in our wildlands network design.<br />
EXISTING CORE PROTECTED AREAS These are existing<br />
Status 1 or 2, Lands Permanently Secured from<br />
Conversion <strong>to</strong> Development (LPSCDs);<br />
PROPOSED CORE AREAS These are areas of concentration<br />
of high conservation values that we believe warrant<br />
a high level of protection based on <strong>the</strong> analysis;<br />
AREAS OF HIGH BIOLOGICAL SIGNIFICANCE (HBS)<br />
These are areas that we have identified as having significant<br />
conservation value at a regional scale based on <strong>the</strong><br />
analysis. Although <strong>the</strong> HBS lands are vital <strong>to</strong> achieving<br />
<strong>the</strong> conservation goals for <strong>the</strong> network as a whole, in general<br />
<strong>the</strong>y had somewhat lower conservation values than<br />
ei<strong>the</strong>r existing or proposed core areas. Some of <strong>the</strong>se lands<br />
are currently Status 3 LPSCDs. Additional study and discussion<br />
with stakeholders will be needed <strong>to</strong> determine <strong>the</strong><br />
precise conservation designation and management objectives<br />
for <strong>the</strong>se lands. Wildlife linkages have been included<br />
in <strong>the</strong> HBS category.<br />
LPSCDS NOT SELECTED AS PROPOSED CORE OR HBS<br />
LANDS We have also identified a fourth category of<br />
LPSCDs that we have not included in <strong>the</strong> network, but<br />
that we have indicated on some of <strong>the</strong> maps since <strong>the</strong>y can<br />
contribute <strong>to</strong> <strong>the</strong> functioning of <strong>the</strong> network and <strong>to</strong> biodiversity<br />
conservation. These are Status 3 LPSCDs, nearly all<br />
Crown Lands in Nova Scotia, New Brunswick and<br />
Québec, that we did not identify as ei<strong>the</strong>r proposed core or<br />
area of high biological significance but that supplement<br />
<strong>the</strong> network. These lands contribute <strong>to</strong> <strong>the</strong> functioning of<br />
<strong>the</strong> overall network and should be subject <strong>to</strong> best management<br />
practices, such as certification by <strong>the</strong> Forest<br />
Stewardship Council (FSC).<br />
To establish <strong>the</strong> location and extent of <strong>the</strong> network<br />
design elements, we used three major sources of information:<br />
1) <strong>the</strong> results of <strong>the</strong> site selection analyses discussed<br />
above; 2) The Nature Conservancy’s Tier 1 matrix forest<br />
blocks in <strong>the</strong> Nor<strong>the</strong>rn Appalachian/<strong>Acadia</strong>n ecoregion<br />
(Anderson et al. 2006); and 3) input from experts, such as<br />
local leaders in environmental non-governmental organizations,<br />
representatives from government wildlife agencies,<br />
and university scientists. To obtain expert input we<br />
conducted a series of meetings in Nova Scotia, New<br />
Brunswick, Québec, Vermont, New York and Maine from<br />
January through May 2006. 5<br />
The Nature Conservancy’s (TNC) Tier 1 matrix forest<br />
blocks (Figure 10) were identified after we had completed<br />
our site selection analyses, so <strong>the</strong>se blocks were not incorporated<br />
as distinct ecological features in <strong>the</strong> MARXAN<br />
algorithm. We were, however, able <strong>to</strong> incorporate <strong>the</strong><br />
blocks in<strong>to</strong> <strong>the</strong> expert-driven network design process that<br />
occurred after <strong>the</strong> site selection analyses were completed.<br />
Through consultations with TNC and o<strong>the</strong>r experts, <strong>the</strong><br />
matrix blocks were overlain with <strong>the</strong> results of <strong>the</strong> site<br />
selection analyses and taken in<strong>to</strong> account in choosing and<br />
refining <strong>the</strong> preferred scenarios. In some cases, <strong>the</strong> network<br />
boundaries were expanded or adjusted <strong>to</strong> incorporate a<br />
5. Massachusetts was excluded from <strong>the</strong> analysis because only a very small portion of <strong>the</strong> state falls within <strong>the</strong> study area. Prince Edward Island was excluded<br />
because it is separated from <strong>the</strong> mainland by water and because its environment is so highly modified.<br />
[ 27 ]
FIGURE 10 The 176 critical forest sites, or Tier 1 matrix forest blocks, in <strong>the</strong> Nor<strong>the</strong>rn Appalachian/<strong>Acadia</strong>n ecoregion. TNC<br />
and partners recommend a 10,000-hectare (25,000 acre) core reserve in each block devoted <strong>to</strong> <strong>the</strong> res<strong>to</strong>ration of complete<br />
forest ecosystems surrounded by lands secured from conversion <strong>to</strong> development. Source: Anderson et al. (2006).<br />
[ 28 ]
Tier 1 block that local experts considered an exceptional<br />
example of conservation values, ei<strong>the</strong>r in addition <strong>to</strong> or<br />
instead of representing <strong>the</strong>se values elsewhere in <strong>the</strong> network.<br />
Occasionally a Tier 1 block was not added or incorporated<br />
in<strong>to</strong> <strong>the</strong> network design, such as when its conservation<br />
value was considered adequately captured by ano<strong>the</strong>r<br />
area within <strong>the</strong> network design. In some of <strong>the</strong>se cases,<br />
<strong>the</strong> area selected by <strong>the</strong> site selection analyses overlapped<br />
with Tier 2 blocks identified by TNC as alternatives <strong>to</strong> or<br />
of similar conservation value as Tier 1 blocks. (The multistep<br />
process utilized by TNC <strong>to</strong> delineate <strong>the</strong> Tier 1 and 2<br />
matrix forest blocks is summarized in Appendix 1 and<br />
described in detail in Anderson et al. [2006]) As a consequence<br />
of <strong>the</strong>se and o<strong>the</strong>r refinements, <strong>the</strong> network design<br />
includes 76% of <strong>the</strong> <strong>to</strong>tal area of <strong>the</strong> Tier 1 matrix blocks.<br />
In addition <strong>to</strong> those based on TNC’s matrix forest<br />
blocks, a summary of <strong>the</strong> refinements from expert input<br />
received during <strong>the</strong> series of meetings in each state or<br />
province follows (see Appendix 3 for detailed descriptions<br />
of <strong>the</strong>se refinements).<br />
NOVA SCOTIA Participants chose <strong>the</strong> best run of scenario<br />
6 (medium goals for all features; highest BLM of<br />
0.01) as <strong>the</strong> base scenario because it captures many of <strong>the</strong><br />
known conservation priorities in <strong>the</strong> province. They also<br />
recommended that we add certain elements from <strong>the</strong> best<br />
run of scenario 12 (highest goals for all features; highest<br />
BLM of 0.01) <strong>to</strong> capture o<strong>the</strong>r known areas of high ecological<br />
value and importance for connectivity. Participants<br />
also recommended that we reduce <strong>the</strong> scope of <strong>the</strong> design<br />
from that shown in scenario 6 in certain areas, such as <strong>the</strong><br />
west coast and sou<strong>the</strong>rn end of Cape Bre<strong>to</strong>n. A number of<br />
linkages were also added based on expert knowledge. In<br />
refining <strong>the</strong> network for Nova Scotia we were able <strong>to</strong> draw<br />
on <strong>the</strong> work of Beazley et al. (2005), which delineated<br />
potential areas of core and connectivity based on analysis<br />
of representation, special elements and focal species. We<br />
also drew on <strong>the</strong> work by <strong>the</strong> Nova Scotia Public Lands<br />
Coalition/Ecology Action Center <strong>to</strong> delineate new wilderness<br />
areas in <strong>the</strong> Chignec<strong>to</strong> and Ship Harbor Long Lake<br />
regions.<br />
NEW BRUNSWICK Participants chose <strong>the</strong> best run of<br />
scenario 12 a base scenario because it captures many of <strong>the</strong><br />
known conservation priorities in <strong>the</strong> province, but recommended<br />
that we add elements of <strong>the</strong> best run of scenario 9<br />
(higher focal species goals, lower representation goals,<br />
higher special element goals; highest BLM of 0.01). A<br />
number of HBS lands that did not occur in ei<strong>the</strong>r scenario<br />
9 or 12 were added based on expert opinion, including<br />
unfragmented sections of Gage<strong>to</strong>wn military reserve.<br />
Participants also recommended that we reduce <strong>the</strong> scope of<br />
<strong>the</strong> design plan from that shown in scenario 12 in <strong>the</strong><br />
heavily used agricultural areas on <strong>the</strong> western border of<br />
New Brunswick. We also added a five-km-wide buffer<br />
around <strong>the</strong> network design elements. The buffering is<br />
intended <strong>to</strong> provide flexibility in ensuring a portion of <strong>the</strong><br />
area will always be managed in support of <strong>the</strong> larger network<br />
while determining how and where resources will be<br />
managed within <strong>the</strong> area. For example, functional linkages<br />
between core areas should always be maintained somewhere<br />
within <strong>the</strong>se buffer areas, while allowing for shifting<br />
linkages over space and time.<br />
QUÉBEC Local experts divided <strong>the</strong> portion of <strong>the</strong><br />
province that falls within <strong>the</strong> study area in<strong>to</strong> three smaller<br />
regions: “Eastern,” “Central,” and Western,” and selected<br />
a preferred scenario for each subregion. These sections<br />
are similar <strong>to</strong> <strong>the</strong> sub-regions described in Québec’s ecological<br />
land classification system (Anderson et al. 2006).<br />
The Eastern section is equivalent <strong>to</strong> <strong>the</strong> Gaspé Peninsula;<br />
<strong>the</strong> Central section comprises <strong>the</strong> Temiscouata Hills, with<br />
its limit somewhat offset <strong>to</strong> <strong>the</strong> west and capturing part of<br />
<strong>the</strong> Beauce area; and <strong>the</strong> Western section encompasses <strong>the</strong><br />
two remaining Appalachian subregions: <strong>the</strong> Estrie-Beauce<br />
Plateaus and Hills and <strong>the</strong> Green and White Mountains.<br />
For <strong>the</strong> Eastern section, planning units were included<br />
from <strong>the</strong> best run of scenario 9. Within <strong>the</strong> Eastern section,<br />
cores were delineated where <strong>the</strong> summed-run values,<br />
within <strong>the</strong> best-run outline from scenario 9, were greater<br />
than 80%. All planning units within <strong>the</strong> best-run outline<br />
with summed-run values less than 80% were included as<br />
HBS lands. For <strong>the</strong> Central section, planning units were<br />
included from <strong>the</strong> best run of scenario 9. Within this best<br />
run, core areas were identified as those with summed-run<br />
values of greater than 70%. For <strong>the</strong> Western section, planning<br />
units were included from <strong>the</strong> best runs of scenario 6<br />
and scenario 12. Planning units with values greater than<br />
50% for scenario 6, and 60% for scenario 12 were included<br />
as cores.<br />
VERMONT Meeting participants identified scenario<br />
11 (higher goals for focal species, representation, and special<br />
elements; moderate BLM of 0.01) as <strong>the</strong> preferred scenario.<br />
After reviewing <strong>the</strong> results of <strong>the</strong> analysis for <strong>the</strong> St.<br />
Lawrence/Champlain Valley portion of Vermont, local<br />
experts concluded that <strong>the</strong> results were not robust enough<br />
<strong>to</strong> support <strong>the</strong> identification of a network design in that<br />
ecoregion, since <strong>the</strong> input data consisted only of focalspecies<br />
features. The Lower New England ecoregion has<br />
focal-species data only; <strong>the</strong>re is, however, a probable linkage<br />
between <strong>the</strong> <strong>Adirondacks</strong> and Vermont in this ecore-<br />
[ 29 ]
gion. The site selection analysis under Scenario 11 shows a<br />
large block of planning units selected with high frequency.<br />
We reviewed <strong>the</strong>se results with local experts and <strong>the</strong>y<br />
concurred that <strong>the</strong> planning units selected with high frequency,<br />
mostly in <strong>the</strong> Lake Bomoseen area <strong>to</strong> <strong>the</strong> east of<br />
Lake George, were indeed important and should be<br />
included in <strong>the</strong> network. Linkages between <strong>the</strong> Lake<br />
Bomoseen complex and important core and proposed core<br />
areas in sou<strong>the</strong>rn Vermont were also identified during <strong>the</strong><br />
review process.<br />
NEW YORK Workshop participants recommended<br />
that we add relatively small amounts of new core protected<br />
areas <strong>to</strong> <strong>the</strong> base of existing protected areas within <strong>the</strong><br />
“Blue Line” Adirondack Park boundary, focusing instead<br />
on ensuring that connectivity between <strong>the</strong> Park and o<strong>the</strong>r<br />
areas of <strong>the</strong> region be maintained or res<strong>to</strong>red. Important<br />
connectivity regions identified include <strong>the</strong> linkage with<br />
Tug Hill Plateau, <strong>the</strong> Algonquin <strong>to</strong> Adirondack linkage<br />
with Algonquin Provincial Park (Quinby et al. 1999,<br />
2000), and <strong>the</strong> linkage with Vermont, south of Lake<br />
Champlain. We excluded planning units selected within<br />
<strong>the</strong> St. Lawrence/Champlain Valley ecoregion except those<br />
within <strong>the</strong> three linkages noted above, and those in selected<br />
hamlets within <strong>the</strong> Blue Line (reflecting feedback from<br />
meeting participants).<br />
MAINE We conducted five meetings that did not<br />
achieve consensus around a single scenario that should<br />
serve as <strong>the</strong> basis for fur<strong>the</strong>r conservation planning,<br />
though <strong>the</strong>re was somewhat more agreement around scenario<br />
8 (higher goals for focal species, lower goals for representation,<br />
and higher goals for special elements, moderate<br />
BLM of 0.001). The best run of scenario 8 was consequently<br />
used as <strong>the</strong> basis for a first draft, along with o<strong>the</strong>r<br />
inputs. We returned <strong>to</strong> Maine in May 2006 <strong>to</strong> review this<br />
first draft with a set of experts in a daylong workshop.<br />
That workshop produced several changes that have been<br />
incorporated in<strong>to</strong> <strong>the</strong> current network design, including<br />
<strong>the</strong> addition of lands of high biological significance in<br />
Downeast Maine (based on scenario 12), <strong>the</strong> addition of a<br />
linkage along <strong>the</strong> upper St. John River in far nor<strong>the</strong>rn<br />
Maine (based on expert opinion), and <strong>the</strong> elimination of<br />
several gaps within and between HBS lands in nor<strong>the</strong>rn<br />
and western Maine (based on expert opinion plus<br />
summed-summed runs and alternate scenarios.)<br />
NEW HAMPSHIRE We did not conduct face-<strong>to</strong>-face<br />
meetings in New Hampshire because such a large portion<br />
of <strong>the</strong> state in <strong>the</strong> study area is already in some form of<br />
conservation. Instead we drafted a proposed design for <strong>the</strong><br />
state and sent it <strong>to</strong> several external reviewers for <strong>the</strong>ir consideration.<br />
Two experts from New Hampshire attended<br />
face-<strong>to</strong>-face meetings in Maine. The design outline included<br />
planning units containing more than 50% of Tier 1<br />
matrix blocks, more than 10% of Status 1 or 2 LPSCDs,<br />
and more than 25% of Status 3 LPSCDs. We delineated<br />
proposed cores by intersecting <strong>the</strong> network outline with<br />
summed runs values from scenario 11. Planning units<br />
selected 70% or more were included as cores. Planning<br />
units selected less than 70% were included as areas of high<br />
biological significance. A reviewer noted some gaps in <strong>the</strong><br />
resulting design, which were corrected.<br />
Methodological Limitations and Strengths<br />
<strong>Wildlands</strong> network design is an interplay of applied science<br />
and expert judgment and as a consequence <strong>the</strong> results<br />
that are produced will vary with <strong>the</strong> assumptions made,<br />
<strong>the</strong> fac<strong>to</strong>rs considered, and <strong>the</strong> quality of <strong>the</strong> input data.<br />
As previously described, <strong>the</strong>re are several issues related <strong>to</strong><br />
gaps in <strong>the</strong> availability of consistent data across <strong>the</strong> study<br />
area. With updated and more-detailed data, it is possible<br />
that certain planning units would be identified as of<br />
greater or lesser importance, potentially influencing network<br />
design. None<strong>the</strong>less, we have made every attempt <strong>to</strong><br />
acquire and utilize <strong>the</strong> best available data at this time.<br />
One fac<strong>to</strong>r with <strong>the</strong> potential <strong>to</strong> influence <strong>the</strong> network<br />
design involves <strong>the</strong> suite of focal species used. Wolf, lynx<br />
and marten all occur or have occurred throughout <strong>the</strong><br />
study area. However, as <strong>the</strong> results of Carroll (2003, 2005)<br />
demonstrate, source habitats for <strong>the</strong>se species will likely be<br />
concentrated in <strong>the</strong> boreal and sub-boreal portions of <strong>the</strong><br />
study area, in good part because this is where snowfall, a<br />
critical fac<strong>to</strong>r in marten and lynx viability, is greatest.<br />
Carroll (2005:36) observes that “decreased snowfall<br />
impacts marten and lynx through decreased prey abundance<br />
and/or vulnerability, and decreased competitive<br />
advantage over sympatric carnivores (Krohn et al. 1995,<br />
Mowat et al. 2000).” Carroll (2005: 36) fur<strong>the</strong>r notes that<br />
“this relationship may change as competi<strong>to</strong>r and prey<br />
species <strong>the</strong>mselves each respond individualistically <strong>to</strong> climate<br />
change. However, <strong>the</strong> application of climate change<br />
predictions here is valuable as an initial exploration of <strong>the</strong><br />
potential effects of decreased snowfall and <strong>the</strong> interaction<br />
of climate change with o<strong>the</strong>r threat fac<strong>to</strong>rs.”<br />
In any event, ano<strong>the</strong>r set of focal species analyses<br />
should be conducted with a suite of species that are more<br />
specific <strong>to</strong> <strong>the</strong> non-boreal and <strong>Acadia</strong>n portions of <strong>the</strong><br />
ecoregion and more prevalent in landscapes with more<br />
[ 30 ]
human influence. For example, reviewers in Maine focused<br />
on <strong>the</strong> region encompassing Skowhegan, Farming<strong>to</strong>n,<br />
Augusta, and Waterville, and suggested that moose, fisher<br />
and brook trout may be better focal species for that<br />
region. These and o<strong>the</strong>r species have also been identified as<br />
potential focal species for Maine and Nova Scotia (Beazley<br />
and Cardinal 2004), with potentially broader applicability<br />
<strong>to</strong> <strong>the</strong> Nor<strong>the</strong>rn Appalachian/<strong>Acadia</strong>n ecoregion. In <strong>the</strong>ir<br />
conservation system planning for Nova Scotia, Beazley et<br />
al. (2005) used moose, marten and goshawk.<br />
The analyses do not adequately consider aquatic systems,<br />
particularly riverine connectivity. This is at least<br />
partially as a consequence of data limitations, which led <strong>to</strong><br />
an early decision <strong>to</strong> exclude aquatic considerations, a problem<br />
that is not uncommon <strong>to</strong> network design analyses.<br />
River corridors in particular are threatened by development<br />
and ELUs associated with rivers are not well represented<br />
in <strong>the</strong> draft network. Reviewers in Maine, for<br />
example, noted that <strong>the</strong>re are no complete pathways from<br />
<strong>the</strong> coast <strong>to</strong> <strong>the</strong> rest of interior Maine and agreed that those<br />
connections are important.<br />
It is also important <strong>to</strong> remember that goals were set at<br />
a regional versus sub-regional scale. Since goals for <strong>the</strong><br />
conservation features could be met anywhere in <strong>the</strong> study<br />
area, site selection occurs over <strong>the</strong> region as a whole—an<br />
area in <strong>Acadia</strong>n Nova Scotia is as valid as one in <strong>the</strong><br />
<strong>Adirondacks</strong> of New York in meeting a given set of goals.<br />
This may cause <strong>the</strong> results <strong>to</strong> cluster in areas such as nor<strong>the</strong>rn<br />
Maine and <strong>the</strong> Gaspé Peninsula of Québec where <strong>the</strong><br />
goals may be satisfied in a more efficient manner, such as<br />
by capturing several goals in one location and by responding<br />
<strong>to</strong> boundary modifier rules. In o<strong>the</strong>r studies (e.g.,<br />
Carroll et al. 2003) subregional-scale goals have been set<br />
within a region. This approach in <strong>the</strong> Nor<strong>the</strong>rn<br />
Appalachian/<strong>Acadia</strong>n ecoregion would likely change <strong>the</strong><br />
distribution of <strong>the</strong> outputs, perhaps providing a more even<br />
distribution of sites throughout <strong>the</strong> study area. We recommend<br />
that future site selection analyses stratify <strong>the</strong><br />
study area in<strong>to</strong> smaller regions and establish goals for<br />
those regions, while maintaining regional goals.<br />
During our visits <strong>to</strong> Maine, reviewers expressed concern<br />
that <strong>the</strong> focal species data set might not capture <strong>the</strong><br />
actual lynx source habitat in <strong>the</strong> nor<strong>the</strong>rn part of <strong>the</strong> state.<br />
We asked lynx researchers at <strong>the</strong> University of Maine<br />
about this critique and <strong>the</strong>ir opinion was that <strong>the</strong> dataset<br />
is accurate, though perhaps conservative in estimates of<br />
source habitat in <strong>the</strong> north. They recommended that we<br />
use scenario 8, with its high focal species goals, as a base<br />
and that we identify connectivity <strong>to</strong> important source<br />
areas in New Brunswick and Québec. The connectivity<br />
recommendations by <strong>the</strong> University of Maine researchers<br />
closely matched those of Carroll (2005). We incorporated<br />
<strong>the</strong>se recommendations in<strong>to</strong> our design for Maine. We also<br />
note that <strong>the</strong> inputs <strong>to</strong> <strong>the</strong> lynx PATCH scenarios were<br />
based on Hoving et al. (2005), which is <strong>the</strong> best published<br />
material on regional lynx habitat. Based on this assessment,<br />
we believe that this dataset is sound for <strong>the</strong> purposes<br />
of <strong>the</strong> conservation planning presented here, but it<br />
should be carefully reviewed and updated as necessary.<br />
For focal species conservation features and goals, we<br />
used a combination of predicted source and threatened<br />
source data as inputs in<strong>to</strong> <strong>the</strong> site selection analysis.<br />
Unlike some o<strong>the</strong>r analyses that have used a combination<br />
of dynamic population model results and a site selection<br />
algorithm (e.g., Carroll et al. 2003), we were not able <strong>to</strong><br />
quantitatively evaluate <strong>the</strong> resulting network design <strong>to</strong><br />
confirm that it provides a threshold amount of source and<br />
o<strong>the</strong>r habitat necessary <strong>to</strong> insure population viability. We<br />
did, however, consult with relevant wildlife experts who<br />
indicated, on <strong>the</strong> basis of <strong>the</strong>ir familiarity with <strong>the</strong> species<br />
and <strong>the</strong> region and <strong>the</strong>ir best judgment, that <strong>the</strong>re<br />
appeared <strong>to</strong> be sufficient habitat area encompassed by <strong>the</strong><br />
network in key areas such as nor<strong>the</strong>rn Maine. None<strong>the</strong>less,<br />
we recommend that <strong>the</strong>re be capacity, as part of a package<br />
of future focal species studies, <strong>to</strong> evaluate <strong>the</strong> network<br />
design for its ability <strong>to</strong> provide sufficient habitat <strong>to</strong> support<br />
viable populations of a range of focal species.<br />
The boundary length modifier function of MARXAN<br />
enables <strong>the</strong> site selection algorithms <strong>to</strong> “generate options<br />
that are well connected (Leslie et al. 2003).” Caution<br />
should be exercised, however, in using <strong>the</strong> linkages that<br />
result, since <strong>the</strong>re is no guarantee that <strong>the</strong>se connectivity<br />
options are appropriate for specific species. We have<br />
attempted <strong>to</strong> use <strong>the</strong> results of <strong>the</strong> PATCH analyses, and<br />
<strong>the</strong>ir identification of important source areas and broad<br />
linkage outlines, as guides in <strong>the</strong> network design refinement<br />
process. Researchers using similar combinations of<br />
site selection algorithms and dynamic population models<br />
(Carroll et al. 2003) have used <strong>the</strong> technique of starting<br />
with best run outputs from <strong>the</strong> site selection, <strong>the</strong>n adding<br />
additional areas <strong>to</strong> serve as linkages based on information<br />
derived from PATCH. Summed-run results can be used in<br />
this context <strong>to</strong> more precisely determine <strong>the</strong> linkage locations.<br />
Although we have attempted <strong>to</strong> follow this method,<br />
linkage delineation in this region would benefit from<br />
additional field data, future analyses of least-cost paths in<br />
selected areas, additional local and expert input, and<br />
remotely-sensed data such as high-resolution satellite<br />
[ 31 ]
imagery and aerial pho<strong>to</strong>s.<br />
It is critical <strong>to</strong> rerun <strong>the</strong> site selection algorithm on a<br />
regular basis <strong>to</strong> incorporate new data and changes in<br />
potential conservation areas, such as <strong>the</strong> establishment of<br />
new protected areas and <strong>the</strong> conversion of natural areas <strong>to</strong><br />
urban land uses. The comprehensive conservation planning<br />
initiative envisioned by 2C1Forest in 2006 and<br />
2007, described below, anticipates increasing <strong>the</strong> capacity<br />
among researchers in <strong>the</strong> region <strong>to</strong> use this software, and<br />
we strongly endorse this effort.<br />
Despite <strong>the</strong>se cautions in interpreting <strong>the</strong> results, it is<br />
important <strong>to</strong> acknowledge <strong>the</strong> strengths of this analysis.<br />
First, <strong>the</strong> analysis incorporates a comprehensive, ecoregional-scale<br />
focal species dimension <strong>to</strong> conservation planning<br />
for this region. As Carroll (2003: 2) observes, “comprehensive<br />
analysis of viability needs for <strong>the</strong> three species can<br />
result in a stronger and more efficient res<strong>to</strong>ration strategy<br />
than would separate single-species recovery efforts.”<br />
Second, we were able <strong>to</strong> assemble, through collaborations<br />
with generous partners, a uniform dataset for a broad, representative<br />
array of conservation features. Third, we applied<br />
a site selection algorithm at an ecoregional scale, bringing<br />
this powerful <strong>to</strong>ol <strong>to</strong> bear on conservation decision-making<br />
in this region. We hope that this dataset, and <strong>the</strong> underlying<br />
grid of planning units, can serve as a springboard for<br />
refined conservation planning as well as a moni<strong>to</strong>ring<br />
framework <strong>to</strong> track conservation progress. While this network<br />
design should be refined as new data and resources<br />
become available, it does provide important insights in<strong>to</strong><br />
<strong>the</strong> major regional patterns of high terrestrial conservation<br />
value and landscape linkages. Regardless of future adjustments,<br />
it is unlikely that concentrated areas of <strong>the</strong> most<br />
highly irreplaceable conservation features at <strong>the</strong> regional<br />
scale identified through this analysis will vary significantly.<br />
Results of <strong>the</strong> <strong>Network</strong> Design<br />
The composite wildlands network design created as a consequence<br />
of <strong>the</strong> MARXAN analyses and subsequent consultations<br />
with local experts encompasses approximately<br />
47% of <strong>the</strong> study area (Figure 11). It consists of existing<br />
and proposed core protected areas, and o<strong>the</strong>r areas of high<br />
biological significance (including potential stewardship/buffer<br />
areas and linkages between core protected<br />
areas), and is supported by additional LPSCDs outside of<br />
<strong>the</strong> network.<br />
We classify proposed core areas in<strong>to</strong> primary and secondary<br />
categories based on information from <strong>the</strong><br />
summed-summed runs output (Figure 12). We recommend<br />
that all proposed cores receive status 1 or 2 protection<br />
over time. Primary cores likely have <strong>the</strong> highest conservation<br />
value based on <strong>the</strong> analysis and thus may be<br />
higher priority. Similarly, we classify high biological significance<br />
lands in<strong>to</strong> three categories (primary, secondary,<br />
and tertiary) based on summed-summed runs data.<br />
Primary HBS lands likely have higher conservation value<br />
than o<strong>the</strong>r HBS lands and so should be given priority<br />
both in terms of future assessments and conservation.<br />
None<strong>the</strong>less all are important <strong>to</strong> achieving <strong>the</strong> percentage<br />
conservation goals for special elements, environmental<br />
variation, and source habitat for focal species. That is, <strong>the</strong><br />
network as a whole identifies those conservation areas that<br />
are likely essential for long-term persistence of biodiversity<br />
in this region.<br />
Due <strong>to</strong> <strong>the</strong> data gaps in <strong>the</strong> St. Lawrence/Champlain<br />
Valley ecoregion, we have restricted most of our network<br />
design elements <strong>to</strong> <strong>the</strong> Nor<strong>the</strong>rn Appalachian/<strong>Acadia</strong>n<br />
portion of <strong>the</strong> study area, with <strong>the</strong> exception of obvious<br />
linkages within <strong>the</strong> St. Lawrence/Champlain Valley<br />
region. Because of this exclusion, <strong>the</strong> statistics cited below<br />
and summarized in Tables 7 and 8 are likely conservative<br />
estimates of <strong>the</strong> amount of land that should be included in<br />
a comprehensive network design.<br />
■ The <strong>to</strong>tal proposed network would span 181,519 km 2<br />
(44,835,112 acres) or about 47% of <strong>the</strong> study area.<br />
■ All existing status 1 and 2 lands, currently 24,661<br />
km 2 (6,091,267 acres), or 6.4% of <strong>the</strong> region, are captured<br />
in <strong>the</strong> proposed network.<br />
■ An additional 42,053 km 2 (10,387,010 acres) in<br />
proposed core areas, about 11% of <strong>the</strong> region, are<br />
identified.<br />
■ About 60,235 km 2 (14,878,045 acres) of current status<br />
3 LPSCDs, or 68% of <strong>the</strong> current <strong>to</strong>tal of 88,952<br />
km 2 (21,971,035 acres) in <strong>the</strong> study area as whole, are<br />
included in <strong>the</strong> network.<br />
■ We identified 114,805 km 2 (28,356,835 acres) of<br />
lands of high biological significance, about 29.5% of<br />
<strong>the</strong> region.<br />
■ Of <strong>the</strong> <strong>to</strong>tal proposed network, about 14% is in existing<br />
core protected areas, about 23% is in proposed<br />
core areas and <strong>the</strong> remaining 63% is in high biological<br />
significance lands. Thirty-three percent of <strong>the</strong> proposed<br />
network is currently in status/gap 3 or<br />
Public/Crown lands.<br />
■ A <strong>to</strong>tal of 96,623 km 2 (23,865,800 acres) remain<br />
unsecured from development, or about 53% of <strong>the</strong><br />
<strong>to</strong>tal proposed network (Figure 13).<br />
[ 32 ]
■ There are 28,717 km 2 (7,092,990 acres) of status 3<br />
LPSCDs, nearly all Crown Lands in Nova Scotia, New<br />
Brunswick and Québec, that we did not identify as<br />
ei<strong>the</strong>r proposed core or area of high biological significance<br />
but that supplement <strong>the</strong> network. These lands<br />
contribute <strong>to</strong> <strong>the</strong> functioning of <strong>the</strong> overall network<br />
and should be subject <strong>to</strong> best management practices,<br />
such as certification by <strong>the</strong> Forest Stewardship<br />
Council (FSC). When combined, <strong>the</strong> proposed network<br />
and non-selected LPSCDs <strong>to</strong>tal 210,235 km 2<br />
(51,928,102 acres) or about 54% of <strong>the</strong> planning area.<br />
We have identified several broad high-priority areas,<br />
based on a combination of empirical information about<br />
regional biological importance (as derived from one or<br />
more site selection scenarios and <strong>the</strong> summed-summed<br />
runs output), contribution <strong>to</strong> regional and local connectivity<br />
(as derived from Carroll [2003, 2005], site selection<br />
scenarios and consultations with local experts), and qualitative<br />
threat information gleaned from local expert input,<br />
such as planning officials and non-governmental organizations<br />
(Figure 14). We have not established conservation<br />
priority among <strong>the</strong> areas listed below, so <strong>the</strong>y are numbered<br />
on a rough east-<strong>to</strong>-west basis.<br />
1) CHIGNECTO ISTHMUS LINKAGE This linkage connects<br />
Nova Scotia with <strong>the</strong> rest of <strong>the</strong> ecoregion, preventing<br />
<strong>the</strong> functional isolation of populations of focal species:<br />
“although holding little suitable habitat currently, [<strong>the</strong><br />
isthmus] may support occasional dispersals which may be<br />
critical over <strong>the</strong> long term for maintenance of genetic viability<br />
in <strong>the</strong> isolated lynx and marten populations of Cape<br />
Bre<strong>to</strong>n Island (Carroll 2005: 40).” It is also identified as<br />
critical by Beazley et al. (2005).<br />
2) GASPÉ PENINSULA With large forest blocks, and<br />
low road and population densities, <strong>the</strong> Gaspé Peninsula<br />
represents an important source area for lynx and marten.<br />
Much of <strong>the</strong> peninsula is selected with high frequency<br />
across all site selection scenarios (refer <strong>to</strong> Figure 9). A high<br />
percentage of this area is in some form of public ownership.<br />
3) LOWER GASPÉ/UPPER RESTIGOUCHE RIVER<br />
WATERSHED This area, with large forest blocks, is also<br />
important for lynx and marten. Portions of this area are<br />
selected with high frequency across all site selection scenarios<br />
(Figure 9) and Carroll (2003, 2005) broadly identifies<br />
habitat connectivity for one or more focal species in<br />
this area. According <strong>to</strong> local conservation groups, sizable<br />
blocks of old forest on Crown Land in this part of New<br />
Brunswick are threatened by logging operations.<br />
4) LINKAGE FROM NORTHERN MAINE TO<br />
RESTIGOUCHE A number of researchers (Carroll [2005]<br />
and local experts) identified this linkage as important for<br />
lynx and marten.<br />
5) CENTRAL NEW BRUNSWICK LINKAGE This area is<br />
broadly identified by Carroll (2003, 2005) as a linkage<br />
between potential reestablished wolf populations in Maine<br />
and New Brunswick. The area encompasses Canaan Bog<br />
protected area and clusters of sites <strong>to</strong> <strong>the</strong> nor<strong>the</strong>ast of<br />
Frederic<strong>to</strong>n that that are selected with high frequency<br />
across a range of site selection scenarios.<br />
6) NOTRE DAME MOUNTAINS OF QUÉBEC/ST. JOHN<br />
RIVER REGION OF MAINE A particularly important connection<br />
between core areas in <strong>the</strong> Gaspé and <strong>the</strong> rest of <strong>the</strong><br />
region is provided by this area. It is selected with high<br />
frequency across all site selection scenarios (Figure 9).<br />
7) NORTHCENTRAL MAINE This area, much of which<br />
is in private ownership, contains critical focal species habitat<br />
and retains large forest blocks with low or no human<br />
population density. The area is selected with high frequency<br />
across a range of site selection scenarios (Figure 9).<br />
8) WESTERN/BOUNDARY MOUNTAIN REGION<br />
OF MAINE A broad diversity of habitats and terrain,<br />
including <strong>the</strong> upper Androscoggin watershed, are located<br />
in this region and this area is selected with high frequency<br />
across a range of site selection scenarios (Figure 9). This<br />
region may be coming under increasing threat from<br />
increases in residential development according <strong>to</strong> Hagen<br />
et al. (2005) and land use officials in Maine.<br />
9) MOUNT MEGANTIC (QUÉBEC)/CONNECTICUT<br />
LAKES/NORTHEASTERN HIGHLANDS OF VERMONT As<br />
with <strong>the</strong> Boundary Mountains, this diverse terrain supports<br />
important representative landscapes and serves as an important<br />
landscape linkage. Portions of this area are under<br />
increasing threat from road and residential development<br />
according <strong>to</strong> local conservation groups. This area is selected<br />
with high frequency across a range of site selection scenarios<br />
(Figure 9).<br />
10) GREEN MOUNTAINS (VERMONT)/SUTTON<br />
MOUNTAINS (QUÉBEC) The Green Mountain spine,<br />
which transitions in<strong>to</strong> <strong>the</strong> Sut<strong>to</strong>n Mountains of Québec,<br />
may provide a north-south linkage along <strong>the</strong> main stem of<br />
<strong>the</strong> Appalachians.<br />
11) SOUTHERN LAKE CHAMPLAIN LINKAGE Three<br />
ecoregions come <strong>to</strong>ge<strong>the</strong>r in this critical link between <strong>the</strong><br />
<strong>Adirondacks</strong> of New York and <strong>the</strong> Green Mountains of<br />
Vermont. Portions of this area are selected with high frequency<br />
in several site selection scenarios and local experts<br />
confirmed its importance.<br />
12) ADIRONDACK-TO-TUG HILL LINKAGE Carroll<br />
(2003) suggests that long-term wolf viability in <strong>the</strong><br />
[ 33 ]
TABLE 7 Summary statistics for wildlands network design for <strong>the</strong> study area as a whole and by state and province.<br />
Km 2 ME NB NH NY NS QC VT Total<br />
Existing Protected 2,199 2,192 1,771 10,196 4,492 3,161 650 24,661<br />
Areas (Status 1<br />
and 2 LPSCD)<br />
Proposed Core 10,157 8,099 1,768 4,095 6,726 9,045 2,163 42,035<br />
High Biological 31,243 18,182 2,611 8,631 13,509 33,282 7,347 114,805<br />
Significance<br />
(HBS) lands<br />
Total <strong>Network</strong> 43,599 28,473 6,150 22,922 24,727 45,488 10,160 181,519<br />
Status 3 LPSCD 767 15,244 62 594 5,490 6,398 161 28,717<br />
not in <strong>Network</strong><br />
Total 44,366 43,717 6,212 23,428 30,217 51,886 10,321 210,235<br />
Acres<br />
Existing Protected 543,153 541,424 437,437 2,518,412 1,109,524 780,767 160,550 6,091,267<br />
Areas (Status 1<br />
and 2 LPSCD)<br />
Proposed Core 2,508,671 2,000,461 436,813 1,011,396 1,661,238 2,234,072 534,359 10,387,010<br />
High Biological 7,717,021 4,490,954 644,917 2,131,857 3,336,723 8,220,654 1,814,709 28,356,835<br />
Significance<br />
(HBS) lands<br />
Total <strong>Network</strong> 10,768,845 7,032,839 1,519,167 5,661,665 6,107,485 11,235,493 2,509,618 44,835,112<br />
Status 3 LPSCD 189,545 3,765,327 15,253 146,721 1,356,080 1,580,372 39,693 7,092,990<br />
not in <strong>Network</strong><br />
Total 10,958,391 10,798,165 1,534,420 5,808,386 7,463,565 12,815,865 2,549,311 51,928,102<br />
TABLE 8 Summary statistics, as percentages, for <strong>the</strong> wildlands network<br />
design by province/state and for <strong>the</strong> study area as a whole.<br />
ME NB NH NY NS QC VT Study Area Total<br />
Existing Protected 2.9% 3.0% 22.2% 26.5% 8.0% 3.3% 3.2% 6.3%<br />
Areas (Status 1<br />
and 2 LPSCD)<br />
Proposed Core 13.2% 11.1% 22.1% 10.7% 12.0% 9.3% 10.8% 10.8%<br />
High Biological 40.7% 24.9% 32.7% 22.52% 24.1% 34.4% 36.7% 29.5%<br />
Significance<br />
(HBS) lands<br />
Total <strong>Network</strong> 56.9% 39.0% 77.0% 59.64% 44.1% 47.0% 50.8% 46.7%<br />
Status 3 LPSCD 1.0% 20.9% 0.8% 1.56% 9.8% 6.6% 0.8% 7.4%<br />
not in <strong>Network</strong><br />
Total of <strong>Network</strong> + 57.9% 59.8% 77.8% 61.2% 53.9% 53.6% 51.6% 54.1%<br />
Non-selected LPSCDs<br />
[ 34 ]
FIGURE 11 Proposed <strong>Wildlands</strong> <strong>Network</strong> Design for <strong>the</strong> Greater Nor<strong>the</strong>rn Appalachians. The area included in <strong>the</strong> network design is<br />
shown in light green. Current protected areas (status 1 & 2 LPSCDs) within <strong>the</strong> network are shown in dark green. The New Brunswick<br />
buffer (see text for description) is shown in <strong>the</strong> lightest green. Status 3 LPSCDs not included in <strong>the</strong> network are shown in brown.<br />
[ 35 ]
FIGURE 12 Proposed <strong>Wildlands</strong> <strong>Network</strong> Design for <strong>the</strong> Greater Nor<strong>the</strong>rn Appalachians. Current status 1 and 2 protected<br />
areas are shown in dark green, primary and secondary proposed cores are shown in shades of maroon, and areas of high<br />
biological significance are shown in shades of brown. Status 3 LPSCDs not included in <strong>the</strong> network are in light green.<br />
[ 36 ]
FIGURE 13 Outline of wildlands network design showing lands secured and unsecured from development. Secured lands are shown in tan, unsecured lands in brown.<br />
A large block of land in Downeast Maine with recently secured conservation easements is not shown. Status 3 LPSCDs not included in <strong>the</strong> network are in light green.<br />
[ 37 ]
FIGURE 14 Priority conservation areas (delineated by ovals) in <strong>the</strong> <strong>Wildlands</strong> <strong>Network</strong> Design. See text for brief description of each<br />
numbered area. We have not established priority among <strong>the</strong> areas indicated below, so <strong>the</strong>y are numbered on a rough east-<strong>to</strong>-west basis.<br />
[ 38 ]
Adirondack region would be dependent on <strong>the</strong> Tug Hill<br />
habitat outside <strong>the</strong> Blue Line, <strong>to</strong> <strong>the</strong> west of <strong>the</strong> Park. The<br />
Black River Valley that separates <strong>the</strong> <strong>Adirondacks</strong> from<br />
Tug Hill is heavily settled.<br />
13) ALGONQUIN-TO-ADIRONDACK LINKAGE Some<br />
of this linkage falls outside of <strong>the</strong> study area. It has been<br />
identified as a likely linkage between <strong>the</strong> Nor<strong>the</strong>rn<br />
Appalachians/<strong>Acadia</strong>n ecoregion and <strong>the</strong> boreal regions of<br />
<strong>the</strong> sou<strong>the</strong>rn Canadian Shield (Quinby et al. 1999, 2000).<br />
Goal Attainment in <strong>the</strong> <strong>Network</strong> Design<br />
The outline of <strong>the</strong> proposed wildlands network was intersected<br />
with <strong>the</strong> three-tracks of <strong>the</strong> MARXAN inputs <strong>to</strong><br />
evaluate how well <strong>the</strong> goals are met (Table 9). The network<br />
captures 68% or more of each of <strong>the</strong> 10 focal species features,<br />
exceeding <strong>the</strong> high-goal level (60%; refer <strong>to</strong> Table<br />
5). High (75%) goals were met for each special element<br />
with <strong>the</strong> exception of beach dune and open wet basins.<br />
Open wet basins met low (50%) goals, with 61.8% captured,<br />
and 48% of beach dune is represented. The draft<br />
network captures an average of 79.5% of each special element.<br />
Two ELU types 6 (out of 162) are not captured in <strong>the</strong><br />
draft network (Appendix 2). The network captures<br />
between 13% and 100% of <strong>the</strong> remaining ELUs. The network<br />
captures nine of <strong>the</strong> ELU types at <strong>the</strong> low goal<br />
(5–20%) level and 150 types at <strong>the</strong> medium goal<br />
(25–40%) level or higher. At least 118 ELU types are captured<br />
at <strong>the</strong> high goal (45–60%) level. On average <strong>the</strong><br />
draft network captures 68.3% of each ELU type, greater<br />
than <strong>the</strong> high goal range set for ELUs.<br />
TABLE 9 Focal species and special element<br />
features captured in network design 7<br />
Conservation<br />
Feature<br />
Focal Species<br />
Wolf<br />
1. Source habitat under current landscape<br />
conditions<br />
2. Threatened source habitat under future<br />
landscape change scenario<br />
Lynx<br />
1.a. Base scenario prediction of source<br />
habitat with no population cycling<br />
1.b. Threatened source habitat under<br />
scenario with population cycling<br />
2.a. Base scenario prediction of source<br />
habitat with population cycling and no<br />
trapping of lynx<br />
2.b. Threatened source habitat with<br />
population cycling and trapping of lynx<br />
American marten<br />
1.a. Base scenario prediction of source<br />
habitat with trapping<br />
1.b. Threatened source habitat under<br />
increased trapping pressure<br />
2.a. Base scenario prediction of source<br />
habitat under scenario of habitat<br />
res<strong>to</strong>ration<br />
2.b. Threatened source habitat under<br />
scenario of timber harvest<br />
Average<br />
Special Elements<br />
Percent captured<br />
by draft network<br />
68.0%<br />
67.9%<br />
73.0%<br />
71.6%<br />
73.2%<br />
71.0%<br />
69.4%<br />
68.2%<br />
67.6%<br />
73.6%<br />
70.4%<br />
Beach Dune<br />
Barrens: Open Dry Flats<br />
Barrens: Pine<br />
River Systems/Coves<br />
Floodplain<br />
Forested Wetlands<br />
Steep Slopes and Cliffs<br />
Summits<br />
Open Wet Basins<br />
Average<br />
48.1%<br />
84.4%<br />
86.3%<br />
84.6%<br />
75.5%<br />
95.6%<br />
89.1%<br />
90.5%<br />
61.8%<br />
79.5%<br />
6. These two ELU types, very low elevation coves and flats underlain by ultramafic bedrock, are very small coastal features on islands off <strong>the</strong> coast of Maine.<br />
We do not include <strong>the</strong>m in our design but <strong>the</strong>y should be captured by finer scale conservation planning.<br />
7. For goal attainment of ELUs, refer <strong>to</strong> Appendix 2.<br />
[ 39 ]
DISCUSSION<br />
THE WILDLANDS NETWORK DESIGN PRESENTED<br />
here is <strong>the</strong> first draft of our vision for a set of linked conservation<br />
areas that, when implemented over <strong>the</strong> course of<br />
many years, should contribute <strong>to</strong> <strong>the</strong> protection and<br />
res<strong>to</strong>ration of ecological integrity in <strong>the</strong> Greater Nor<strong>the</strong>rn<br />
Appalachians. Its implementation will depend in part on<br />
its consideration by officials, planners and o<strong>the</strong>r decision<br />
makers throughout <strong>the</strong> region who influence <strong>the</strong> course of<br />
development and conservation priorities. The strength of<br />
this design is its capacity <strong>to</strong> identify <strong>the</strong> major terrestrial<br />
conservation “nodes” in this region and <strong>the</strong> potential linkages<br />
among <strong>the</strong>m. The network captures nearly all <strong>the</strong><br />
conservation features included in <strong>the</strong> assessment, many of<br />
<strong>the</strong>m at high goal levels.<br />
This network design highlights <strong>the</strong> great importance<br />
of nor<strong>the</strong>rn Maine and <strong>the</strong> Gaspé Peninsula for long-term<br />
conservation in this region, not only for species like lynx,<br />
marten and (potentially) wolf, but also as <strong>the</strong> remaining<br />
places in <strong>the</strong> region where large new wildlands could be<br />
established. These two large forested areas are <strong>the</strong> “heart”<br />
of <strong>the</strong> ecoregion in many respects. However, it is also<br />
essential <strong>to</strong> maintain <strong>the</strong> connections between <strong>the</strong>se areas;<br />
several connections should be maintained from nor<strong>the</strong>rn<br />
Maine through <strong>the</strong> base of <strong>the</strong> Gaspé, and through nor<strong>the</strong>rn<br />
Maine in<strong>to</strong> <strong>the</strong> Restigouche region of New Brunswick<br />
and Québec. The north-south linkages from <strong>the</strong> Gaspé<br />
in<strong>to</strong> <strong>the</strong> heart of New Brunswick are also critical, especially<br />
with climate change.<br />
There are currently good linkages between sou<strong>the</strong>astern<br />
New Brunswick and Downeast Maine, and <strong>the</strong>se<br />
should be maintained and reinforced through continuing<br />
efforts <strong>to</strong> establish new conservation areas on both sides of<br />
<strong>the</strong> border. There is still a tenuous connection between<br />
New Brunswick and Nova Scotia through <strong>the</strong> Chignec<strong>to</strong><br />
Isthmus; this is an area warranting critical conservation<br />
attention, as is well recognized by local and regional conservation<br />
groups. Nova Scotia has two large protected<br />
“anchors” at opposite ends of <strong>the</strong> province in <strong>the</strong> form of<br />
<strong>the</strong> Cape Bre<strong>to</strong>n Highlands and <strong>the</strong> Tobeatic/Kejimkujik<br />
complexes, yet <strong>the</strong>re remains a great need <strong>to</strong> establish permanent<br />
connections between <strong>the</strong>se complexes and with<br />
<strong>the</strong> rest of North America.<br />
Returning <strong>to</strong> nor<strong>the</strong>rn Maine, it will be essential <strong>to</strong><br />
ensure <strong>the</strong> long-term connections along <strong>the</strong> Appalachians<br />
in Québec and western Maine in<strong>to</strong> nor<strong>the</strong>rn New<br />
Hampshire, nor<strong>the</strong>rn Vermont and spine of <strong>the</strong> Green<br />
Mountains. Current development patterns (Woolmer et al.<br />
In prep.), however, indicate potential threats <strong>to</strong> substantial<br />
portions of sou<strong>the</strong>rn Québec and Vermont. The boundary<br />
mountains region of western Maine is important in its<br />
own right, and is a key part of <strong>the</strong> linkage from Québec<br />
and Maine <strong>to</strong> <strong>the</strong> rest of <strong>the</strong> Appalachians, yet is relatively<br />
unsecured from development.<br />
There is a critical linkage <strong>to</strong> <strong>the</strong> <strong>Adirondacks</strong> via <strong>the</strong><br />
sou<strong>the</strong>rn Lake Champlain region. Within <strong>the</strong> Blue Line of<br />
<strong>the</strong> Adirondack Park, <strong>the</strong>re is an extensive, relatively wellestablished<br />
complex of protected lands with an administrative<br />
body, <strong>the</strong> Adirondack Park Authority, that provides<br />
substantial control and oversight of development for<br />
<strong>the</strong> most part. To <strong>the</strong> west of <strong>the</strong> <strong>Adirondacks</strong> is <strong>the</strong> Tug<br />
Hill area, which should be viewed as an extension of <strong>the</strong><br />
<strong>Adirondacks</strong>, given its importance, for example, for longterm<br />
wolf viability. Yet <strong>the</strong> valley connecting <strong>the</strong><br />
<strong>Adirondacks</strong> and Tug Hill is heavily settled, so <strong>the</strong>re is at<br />
best a tenuous ecological connection between <strong>the</strong>se two<br />
areas. Conservation action <strong>to</strong> maintain or res<strong>to</strong>re <strong>the</strong> linkage<br />
is warranted. The Algonquin <strong>to</strong> Adirondack (A2A)<br />
(Quinby et al. 1999, 2000) linkage that ties <strong>the</strong><br />
<strong>Adirondacks</strong> <strong>to</strong> <strong>the</strong> rest of <strong>the</strong> sou<strong>the</strong>rn Canadian Shield<br />
via <strong>the</strong> Frontenac Axis appears somewhat less threatened<br />
than <strong>the</strong> Adirondack-Tug Hill linkage, but also merits<br />
additional conservation assessment and action.<br />
New Brunswick presents somewhat of a network<br />
design conundrum. As shown in Table 3, New Brunswick<br />
has <strong>the</strong> highest ratio of LPSCDS <strong>to</strong> state/province area in<br />
<strong>the</strong> study region, with <strong>the</strong> exception of New Hampshire. A<br />
substantial amount of <strong>the</strong> province appears <strong>to</strong> have a basic<br />
level of conservation in place because of <strong>the</strong> large amount<br />
of public Crown Land. Local conservationists quickly point<br />
out, however, that this is a false sense of security. There is<br />
pressure for conversion of natural forest <strong>to</strong> plantations and<br />
<strong>the</strong> amount of older forest on Crown Lands continues <strong>to</strong><br />
decline driven by heavy demand for forest products<br />
throughout <strong>the</strong> province (Legislative Assembly of New<br />
Brunswick 2004). When we visited New Brunswick <strong>to</strong><br />
review <strong>the</strong> site selection scenarios with local experts, <strong>the</strong>y<br />
chose two of <strong>the</strong> highest goal scenarios (9 and 12) as <strong>the</strong><br />
basis for network design, and <strong>the</strong> resulting design broadly<br />
follows <strong>the</strong> footprint of those scenarios. It is important <strong>to</strong><br />
emphasize that while New Brunswick has numerous<br />
[ 40 ]
egionally important areas, as identified in <strong>the</strong> site selection<br />
scenarios, <strong>the</strong>se same scenarios also suggest that New<br />
Brunswick may be somewhat less regionally vital than <strong>the</strong><br />
Gaspé Peninsula and nor<strong>the</strong>rn and western Maine (refer <strong>to</strong><br />
Figures 7, 8 and 9). At <strong>the</strong> recommendation of local<br />
experts, we reduced <strong>the</strong> size of <strong>the</strong> proposed linkages in <strong>the</strong><br />
agricultural areas of western New Brunswick, but also<br />
added linkages in areas, such as Gage<strong>to</strong>wn, that were not<br />
initially identified. Local conservationists and ecological<br />
researchers, cognizant of <strong>the</strong> local political climate, also<br />
recommended that we incorporate a management buffer<br />
around high biological significance lands that would allow<br />
flexibility in resource management while still supporting<br />
<strong>the</strong> broader conservation goals of <strong>the</strong> network design, such<br />
as <strong>to</strong> maintain a linkage between core areas over time.<br />
None<strong>the</strong>less, we assume that status 3 LPSCDs—Crown<br />
Lands—will provide at least a minimum amount of conservation<br />
over time, and, indeed, that management practices<br />
will improve on those lands. In light of <strong>the</strong> ongoing<br />
challenges <strong>to</strong> those lands, we recognize that this is a large<br />
assumption and that much effort will be required <strong>to</strong> ensure<br />
that this assumption proves true.<br />
As currently delineated, <strong>the</strong> network as a whole<br />
would encompass nearly 47% of <strong>the</strong> study area. Adding<br />
existing lands secured from development outside of <strong>the</strong><br />
network as supplemental elements, <strong>the</strong> <strong>to</strong>tal rises <strong>to</strong> more<br />
than 53%. We propose new core protected areas that<br />
encompass about 11% of <strong>the</strong> region, which would bring<br />
<strong>the</strong> <strong>to</strong>tal in existing and proposed core areas <strong>to</strong> more than<br />
17%. It is possible that with fur<strong>the</strong>r analysis <strong>the</strong> proportion<br />
of <strong>the</strong> network that should be in core protected area<br />
would rise. Moreover, as noted above, due <strong>to</strong> <strong>the</strong> data gaps<br />
in <strong>the</strong> St. Lawrence /Champlain Valley ecoregion, we have<br />
restricted most of our network design elements <strong>to</strong> <strong>the</strong><br />
Nor<strong>the</strong>rn Appalachian/<strong>Acadia</strong>n portion of <strong>the</strong> study area,<br />
with <strong>the</strong> exception of obvious linkages within <strong>the</strong> St.<br />
Lawrence/Champlain Valley region. Because of this exclusion,<br />
<strong>the</strong>se statistics are conservative estimates of <strong>the</strong><br />
amount of land that should be included in a comprehensive<br />
network design.<br />
It is illustrative <strong>to</strong> compare our results against those<br />
from similar studies in eastern and western North<br />
America. In a report issued in 2005, scientists in<br />
Massachusetts called for establishing 250,000 acres (just<br />
over 1,000 km 2 ) of large new wildlands reserves in <strong>the</strong><br />
state, predominantly on public land. Under that plan,<br />
50% of state-owned lands would be managed as core protected<br />
areas. In <strong>to</strong>tal about 5% percent of Massachusetts<br />
would be managed as core protected area. This report also<br />
called for securing from development an additional 2.25<br />
million acres (about 9,100 km 2 ) as “well-managed<br />
Woodlands <strong>to</strong> support sustainable timber harvesting,<br />
extensive wildlife habitat and human recreation and enjoyment<br />
(Foster et al. 2005).” Toge<strong>the</strong>r, <strong>the</strong>se initiatives<br />
would entail securing up <strong>to</strong> 50% of <strong>the</strong> state of<br />
Massachusetts from development. To implement this bold<br />
plan, <strong>the</strong> authors advocate <strong>the</strong> formation of “Woodland<br />
Councils” throughout <strong>the</strong> state.<br />
In Nova Scotia, Beazley et al. (2005) determined that<br />
about 60% of Nova Scotia, including 32% in core areas,<br />
should be managed for conservation objectives <strong>to</strong> maintain<br />
genes, species and ecosystems over time. These figures are<br />
strikingly consistent with those of Noss et al. (1999a) who<br />
proposed 60–65% in strict and moderate protection, and<br />
about 34% in core areas in <strong>the</strong>ir conservation plan for <strong>the</strong><br />
Klamath-Siskiyou Ecoregion.<br />
The Heart of <strong>the</strong> West Conservation Plan, which<br />
focuses on <strong>the</strong> lowlands of <strong>the</strong> Wyoming Basins Ecoregion<br />
and Utah-Wyoming Mountains Ecoregion, recommends<br />
that about 45% of <strong>the</strong> study area be managed as core protected<br />
area or landscape linkage (Jones et al. 2004). When<br />
this lowland area is connected <strong>to</strong> <strong>the</strong> Utah-Wyoming<br />
Mountains Ecoregion (Noss et al. 2002), over 53% of <strong>the</strong><br />
larger Heart of <strong>the</strong> West region would be managed as <strong>the</strong><br />
equivalent of core protected area (Jones et al. 2004).<br />
Comparatively, <strong>the</strong> amount of land recommended<br />
here for inclusion in <strong>the</strong> network falls well within <strong>the</strong><br />
ranges of <strong>the</strong>se o<strong>the</strong>r plans. Indeed, since <strong>the</strong> goal for<br />
Massachusetts, a much more populated area than <strong>the</strong><br />
Greater Nor<strong>the</strong>rn Appalachians, is 50% of <strong>the</strong> state<br />
secured from development, <strong>the</strong> goal for <strong>the</strong> Greater<br />
Nor<strong>the</strong>rn Appalachians (GNA) could be higher. Foster et<br />
al. (2005) call for placing about 5% of Massachusetts in<br />
wildlands (core protection). Again, given lower population<br />
densities and larger blocks of undeveloped land in <strong>the</strong><br />
GNA region, our proposal for at least 17% of <strong>the</strong> GNA<br />
region in core protection is modest.<br />
We have stressed in <strong>the</strong> limitations section that several<br />
important datasets were not included in <strong>the</strong> site selection<br />
analyses, that subregional goals were not set, and that<br />
<strong>the</strong> boundary modifier influenced <strong>the</strong> clumping of selected<br />
areas. As a result, this design is likely biased <strong>to</strong>ward <strong>the</strong><br />
central, nor<strong>the</strong>rn and more boreal and sub-boreal portions<br />
of <strong>the</strong> study area, away from <strong>the</strong> <strong>Acadia</strong>n and de-centralized<br />
sub-regions. Several reviewers noted that important<br />
areas of conservation value, particularly in central interior<br />
Maine, and along <strong>the</strong> coastal portions of <strong>the</strong> study area, are<br />
not well represented in this design. For <strong>the</strong>se reasons, we<br />
[ 41 ]
do not consider that this design fully captures important<br />
localized conservation features in <strong>the</strong> more sou<strong>the</strong>rly and<br />
coastal sub-regions of <strong>the</strong> study area as a whole. The<br />
Nature Conservancy’s assessment for <strong>the</strong> Nor<strong>the</strong>rn<br />
Appalachian/<strong>Acadia</strong>n ecoregion (Anderson et al. 2006),<br />
and o<strong>the</strong>r state-and province-level efforts, provide finerscaled<br />
detail and identify important sub-regional and<br />
localized conservation priorities for this <strong>Acadia</strong>n subregion.<br />
To gain more insight in<strong>to</strong> <strong>the</strong> habitat needs and dispersal<br />
corridors for species in <strong>the</strong> non-boreal sub-regions,<br />
we recommend a broader suite of focal species, and a morethorough<br />
syn<strong>the</strong>sis of o<strong>the</strong>r significant examples of existing<br />
research. Such research and syn<strong>the</strong>sis should also<br />
examine <strong>the</strong> potential for riparian corridors in <strong>the</strong> many<br />
rivers that run inland from coastal Maine.<br />
The network design presented here is complementary<br />
<strong>to</strong> <strong>the</strong> results presented in <strong>the</strong> ecoregional assessment<br />
prepared by The Nature Conservancy and its partners for<br />
<strong>the</strong> Nor<strong>the</strong>rn Appalachian/<strong>Acadia</strong>n ecoregion (Anderson<br />
et al. 2006). Although we used some of <strong>the</strong> same datasets,<br />
our approach differs in fundamental ways. For example,<br />
we used 1000 ha planning units as our basic unit of analyses<br />
and defined boundary length modifiers <strong>to</strong> minimize<br />
fragmentation within <strong>the</strong> network design, ra<strong>the</strong>r than<br />
stipulating a minimum-size criterion. Second, we excluded<br />
urban areas and incorporated current habitat conditions<br />
in<strong>to</strong> our focal species inputs ra<strong>the</strong>r than directly<br />
assessing current landuse/landcover conditions. In considering<br />
connectivity, we sought <strong>to</strong> avoid areas that were<br />
clearly dominated by human developments and settlements,<br />
or were identified populations sinks for focal<br />
species; however, we did not necessarily avoid highways<br />
and o<strong>the</strong>r barriers because of <strong>the</strong> potential <strong>to</strong> mitigate<br />
<strong>the</strong>se if <strong>the</strong> conservation values are high. This approach<br />
provides <strong>the</strong> opportunity <strong>to</strong> create a network design that<br />
includes <strong>the</strong> future potential for res<strong>to</strong>ration of <strong>the</strong> landscape.<br />
For example, areas that currently are not in good<br />
condition but that provide a combination of representation<br />
values for ELUs and future source areas for focal<br />
species are not excluded from consideration. Such areas<br />
may play important conservation roles under future<br />
change scenarios related <strong>to</strong> development patterns,<br />
resource harvesting activities and/or climate change.<br />
Third, we used a combination of site selection algorithms<br />
and consultations with local experts <strong>to</strong> select sites<br />
that met our conservation goals in an efficient manner.<br />
This provides a consolidated network of sites and linkages;<br />
however fur<strong>the</strong>r assessment is required <strong>to</strong> refine <strong>the</strong><br />
boundary delineation on <strong>the</strong> basis of ecological features<br />
ra<strong>the</strong>r than <strong>the</strong> hexagonal edges of <strong>the</strong> planning units.<br />
Finally, our approach integrated focal species considerations<br />
along with special elements and ELUs, and identified<br />
linkages between core protected areas as fundamental<br />
<strong>to</strong> <strong>the</strong> goals of <strong>the</strong> network. Conversely, TNC and its<br />
partners invested considerable effort in representing ELUs<br />
and special elements, including rare species, and considering<br />
both minimum size and land-cover condition in identifying<br />
matrix blocks in <strong>the</strong>ir ecoregional plan, and in<br />
delineating boundaries for <strong>the</strong>ir matrix blocks based on<br />
many fac<strong>to</strong>rs, including roads and o<strong>the</strong>r geographic features.<br />
Both approaches provide important information for<br />
conservation planning, and despite <strong>the</strong>ir differences <strong>the</strong>y<br />
display considerable overlap. Indeed, when overlaid with<br />
<strong>the</strong> wildlands network design, 76% of <strong>the</strong> land area of <strong>the</strong><br />
Tier 1 matrix forest blocks are captured in <strong>the</strong> network<br />
(Figure 14).<br />
Under <strong>the</strong> broad umbrella of additional scientific<br />
work required <strong>to</strong> integrate and refine a comprehensive network<br />
design for <strong>the</strong> region, <strong>the</strong> efforts of Two Countries,<br />
One Forest (2C1Forest) are of considerable interest.<br />
Among <strong>the</strong> initiatives <strong>the</strong>y envision is <strong>the</strong> opportunity <strong>to</strong><br />
meld <strong>the</strong> approaches used by <strong>the</strong> <strong>Wildlands</strong> Project and<br />
The Nature Conservancy. 2C1Forest is leading a process<br />
that aims <strong>to</strong> integrate <strong>the</strong> hexagonal planning units and<br />
site selection algorithm used in this analysis, additional<br />
datasets, and <strong>the</strong> results of <strong>the</strong> TNC’s ecoregional planning.<br />
These new results can <strong>the</strong>n be linked <strong>to</strong> threat data<br />
from <strong>the</strong> Current and Future Human Footprint projects <strong>to</strong><br />
provide greater insight in<strong>to</strong> conservation priorities.<br />
This wildlands network design and o<strong>the</strong>r planning<br />
and threat assessment efforts taking place in this region<br />
highlight <strong>the</strong> importance of considering conservation<br />
issues at a large spatial scale. Wide ranging species, for<br />
example, must be considered in this broader context.<br />
Species like wolf and lynx, with <strong>the</strong>ir demands for substantial<br />
amounts of relatively secure habitat (low road and<br />
human population density), provide a critical perspective<br />
on <strong>the</strong> placement and size of habitat. Identifying <strong>the</strong> connectivity<br />
needs for <strong>the</strong>se species will not only contribute <strong>to</strong><br />
<strong>the</strong>ir long-term viability but will aid countless o<strong>the</strong>r<br />
species, particularly in <strong>the</strong> context of climate change.<br />
Indeed, research by Carroll (2005) suggests that climate<br />
change will interact with o<strong>the</strong>r threats <strong>to</strong> form an “extinction<br />
vortex” that may substantially affect population viability<br />
of lynx and marten. Carroll’s conclusion is reinforced<br />
by new findings by Cardillo et al. (2006) that <strong>the</strong>re may be<br />
a latent extinction risk for mammals in Eastern Canadian<br />
Forests. Such a possibility highlights <strong>the</strong> need <strong>to</strong> move <strong>to</strong><br />
[ 42 ]
FIGURE 15 Tier 1 matrix forest blocks overlaid on <strong>the</strong> wildlands network design (Source of matrix forest block data: Anderson et al. [2006]).<br />
[ 43 ]
“more precautionary and regionally-coordinated management<br />
of <strong>the</strong>se species […] or <strong>the</strong>y may suffer range contraction<br />
in areas that are now considered <strong>the</strong> core of <strong>the</strong>ir<br />
regional range (Gaspé for <strong>the</strong> lynx and nor<strong>the</strong>rn Maine for<br />
<strong>the</strong> marten) (Carroll 2005: 3).”<br />
Carroll’s recommendation for cross-border, regionallycoordinated<br />
management of high profile species such as<br />
lynx and marten extends <strong>to</strong> o<strong>the</strong>r large-scale conservation<br />
issues as well, such as regional-scale transportation projects<br />
and acid and mercury deposition. However, as this analysis<br />
demonstrates (in conjunction with o<strong>the</strong>r efforts), even<br />
smaller-scale threats can have a broad regional effect. We<br />
hope, <strong>the</strong>n, that by providing a big picture overview we can<br />
help focus conservation efforts on <strong>the</strong> places and issues, at<br />
various scales, with <strong>the</strong> greatest conservation need.<br />
We stress that this analysis is most accurate at <strong>the</strong><br />
regional scale and conceptual level—it can help identify<br />
big picture conservation needs and opportunities.<br />
However, at <strong>the</strong> scale of implementation, finer-scale analysis,<br />
such as local conservation area planning, least-cost<br />
path analyses, and engagement of a broader set of stakeholders,<br />
will help refine where and how conservation<br />
actions should be carried out.<br />
Although we cannot treat implementation exhaustively<br />
here, we can identify some major elements of work<br />
that will be necessary <strong>to</strong> advance conservation action in <strong>the</strong><br />
Greater Nor<strong>the</strong>rn Appalachians. The first broad track<br />
involves raising awareness of <strong>the</strong> ecological and cultural<br />
values/features/characteristics of <strong>the</strong> region as a whole, as<br />
well as <strong>the</strong> threats and conservation opportunities available.<br />
It is also necessary <strong>to</strong> convene scientists, advocates,<br />
land trusts, and donors with ecoregional interests who can<br />
advance a broad-scale conservation agenda. The Two<br />
Countries, One Forest collaborative was formed for precisely<br />
<strong>the</strong>se purposes and is advancing this work. Entities<br />
such as <strong>the</strong> Nor<strong>the</strong>rn Forest Alliance in <strong>the</strong> U.S., and similar<br />
alliances in Canada, will also be important in advancing<br />
<strong>the</strong>se networking and communications efforts.<br />
A second major element of work, also being advanced<br />
by 2C1Forest, involves “bringing-<strong>to</strong>-ground” focused conservation<br />
work in areas of high conservation priority. This<br />
network design identifies 13 areas that we believe warrant<br />
particular attention because of <strong>the</strong>ir biological importance,<br />
contribution <strong>to</strong> regional connectivity, and exposure<br />
<strong>to</strong> threat. In <strong>the</strong>se areas, finer-scale conservation planning,<br />
outreach <strong>to</strong> local conservation and policy stakeholders, and<br />
locally-targeted communications efforts should be implemented,<br />
with <strong>the</strong> ultimate goal of bringing more land<br />
under some form of conservation. Implementation details<br />
will vary widely from area <strong>to</strong> area and will depend a great<br />
deal on <strong>the</strong> local capacity <strong>to</strong> implement conservation activities.<br />
Some priority areas, such as <strong>the</strong> Chignec<strong>to</strong> Isthmus,<br />
Green Mountains/Sut<strong>to</strong>n Mountains, and Sou<strong>the</strong>rn Lake<br />
Champlain, have good exisiting local capacity <strong>to</strong> move forward.<br />
O<strong>the</strong>r areas, such as <strong>the</strong> Adirondack-<strong>to</strong>-Tug Hill<br />
and Lower Gaspé/Upper Restigouche River Watershed,<br />
have much less local capacity and may require organizational<br />
development <strong>to</strong> advance conservation activities.<br />
A third major implementation element involves<br />
public policy at <strong>the</strong> federal, state and provincial levels, as<br />
well as across political boundaries. For example, much of<br />
<strong>the</strong> land in Maine included in <strong>the</strong> proposed network falls<br />
within <strong>the</strong> State’s plantations and unorganized <strong>to</strong>wnships—areas<br />
under <strong>the</strong> jurisdiction of <strong>the</strong> Land Use<br />
Regula<strong>to</strong>ry Commission (LURC). The Commission has<br />
land use regula<strong>to</strong>ry jurisdiction over <strong>the</strong>se areas because<br />
<strong>the</strong>y have no form of local government <strong>to</strong> administer<br />
land use controls or, if <strong>the</strong>y have local government, <strong>the</strong>y<br />
choose not <strong>to</strong> administer land use controls at <strong>the</strong> local<br />
level (LURC 1997). This 420,800-ha area (10.4 million<br />
acres) covers over half <strong>the</strong> state and represents one of <strong>the</strong><br />
largest contiguous undeveloped areas in <strong>the</strong> nor<strong>the</strong>ast<br />
U.S., and perhaps <strong>the</strong> eastern U.S. The size and regional<br />
conservation priority of <strong>the</strong> area thus highlights <strong>the</strong> critical<br />
role of <strong>the</strong> Commission in future conservation policy<br />
and action.<br />
The results of this network design, and o<strong>the</strong>r scientific<br />
products at this ecoregional scale, may help <strong>to</strong> influence<br />
<strong>the</strong> decisions of this Commission and should be provided<br />
<strong>to</strong> <strong>the</strong>m.<br />
In New Brunswick, a 2002 report by <strong>the</strong> Jaakko<br />
Poyry consulting firm proposed nearly doubling softwood<br />
supply for industrial purposes during <strong>the</strong> next 50 <strong>to</strong> 60<br />
years by increasing, among o<strong>the</strong>r things, <strong>the</strong> amount of<br />
land in softwood plantations and <strong>the</strong> harvest in Special<br />
Management Zones (<strong>the</strong>se are areas that contain mature<br />
coniferous habitat and deer wintering areas, among o<strong>the</strong>r<br />
features). These changes would likely have had substantial<br />
impacts on <strong>the</strong> diversity of New Brunswick forests, and<br />
<strong>the</strong> recommendations were broadly criticized. A Select<br />
Committee of <strong>the</strong> New Brunswick legislature concluded<br />
that it did not view <strong>the</strong> Jaakko Poyry report as a “go forward”<br />
document (Legislative Assembly of New Brunswick<br />
2004) so major changes <strong>to</strong> forest management policy in<br />
New Brunswick have been averted for <strong>the</strong> time being.<br />
Never<strong>the</strong>less, <strong>the</strong> pressures for increased wood supply<br />
remain and represent a substantial challenge <strong>to</strong> increased<br />
conservation on public and private land, and <strong>to</strong> more bio-<br />
[ 44 ]
diversity-oriented forestry practices. As in Maine, this and<br />
o<strong>the</strong>r ecoregional-scale studies may help provide information<br />
about <strong>the</strong> importance of New Brunswick’s forests for<br />
regional biodiversity conservation.<br />
Conclusion<br />
The network design presented here calls for a significant<br />
amount of new conservation land. However, this region<br />
has great conservation potential, and <strong>the</strong> amount of land<br />
identified is very much in line, or moderate, in comparison<br />
with similar analyses both within and outside of this<br />
region that identify areas necessary <strong>to</strong> <strong>the</strong> conservation of<br />
<strong>the</strong> full range of biodiversity. Indeed, <strong>the</strong> use of detailed,<br />
regionally-uniform datasets and a site selection algorithm<br />
has allowed us <strong>to</strong> identify areas that meet high conservation<br />
goals in a relatively compact network design. While<br />
we acknowledge that this network should be refined as<br />
new data and resources become available, this design provides<br />
important insights in<strong>to</strong> <strong>the</strong> major regional patterns<br />
of high terrestrial conservation value and landscape linkages.<br />
Regardless of future adjustments, it is unlikely that<br />
concentrated areas of <strong>the</strong> most highly irreplaceable conservation<br />
features at <strong>the</strong> regional scale identified through this<br />
analysis will vary significantly.<br />
ACKNOWLEDGMENTS<br />
A GREAT MANY PEOPLE AND ORGANIZATIONS MADE<br />
this wildlands network design possible. Our scientific<br />
advisors include: Mark Anderson, Robert Baldwin, Carlos<br />
Carroll, Kathleen Daly, Graham Forbes, Louise Grat<strong>to</strong>n,<br />
Reed Noss, David Publicover, Peter Quinby, Justina Ray,<br />
Michael Soulé, John Terborgh, Stephen Trombulak, and<br />
Gillian Woolmer. Many o<strong>the</strong>rs have provided advice,<br />
reviews and technical support: Dana Allen, Michael<br />
Ballard, Emily Bateson, Douglas Bechtel, Andrew Boyce,<br />
Tom Butler, Roberta Clowater, Kevin Cross, John Davis,<br />
Charles Ferree, Kathleen Fitzgerald, Mary Granskou,<br />
William Hegman, Chris<strong>to</strong>pher McGrory Klyza, Leanne<br />
Klyza Linck, Robert Long, Paula MacKay, Margo<br />
McKnight, John Nordgren, Jim Northup, Joshua Royte,<br />
Nadia Steinzor, James Sullivan, Ken Vance-Borland, and<br />
Barbara Vickery. Advisors and o<strong>the</strong>rs acknowledged do not<br />
necessarily endorse <strong>the</strong> views expressed in this document.<br />
We would also like <strong>to</strong> thank <strong>the</strong> organizations that funded<br />
this work: Common Stream, The Fine Family<br />
Foundation, The Henry P. Kendall Foundation, The<br />
Norcross Wildlife Foundation, Patagonia, Sweet Water<br />
Trust, The Frank and Brinna Sands Foundation, and <strong>the</strong><br />
Environmental Systems Research Institute.<br />
[ 45 ]
APPENDICES<br />
APPENDIX 1<br />
Methods Used by TNC, NCC and <strong>the</strong>ir Partners <strong>to</strong> Delineate Matrix Forest Blocks<br />
To identify representative examples of <strong>the</strong> “matrix-forming”<br />
forests that make up so much of <strong>the</strong> Nor<strong>the</strong>rn<br />
Appalachian/<strong>Acadia</strong>n ecoregion, TNC, NCC and <strong>the</strong>ir<br />
partners developed a multi-step strategy <strong>to</strong> assess <strong>the</strong><br />
matrix forest system (Anderson et al. 2006):<br />
■ subdivide <strong>the</strong> entire forest in<strong>to</strong> smaller semi-discrete<br />
“forest blocks” using roads and o<strong>the</strong>r fragmenting features;<br />
■ classify all forest blocks in<strong>to</strong> representative forest<br />
landscape;<br />
■ screen each forest block, using size, condition and<br />
landcover in <strong>the</strong> surrounding landscape context as<br />
indica<strong>to</strong>rs of biodiversity value and resilience; and<br />
■ identify for conservation action a network of functional<br />
forest blocks representative of <strong>the</strong> diversity of<br />
forest types and landscape elements of <strong>the</strong> ecoregion.<br />
Once forest blocks were identified and <strong>the</strong>ir<br />
forest–landscape types characterized, <strong>the</strong>y were screened<br />
using size, condition and landscape context criteria.<br />
Blocks had <strong>to</strong> be a minimum of 10,000 hectares (25,000<br />
acres), have little internal fragmentation, contain some<br />
elements of old-growth or mature forest, have outstanding<br />
features like high quality headwaters or examples of smaller-scale<br />
ecosystems and species, and be substantially surrounded<br />
by natural or semi-natural land cover (see<br />
Anderson et al. 2006 for details).<br />
The planning team <strong>the</strong>n stratified forest block selection<br />
across all forest-landscape types in <strong>the</strong> ecoregion <strong>to</strong><br />
maximize <strong>the</strong> inclusion of different communities and<br />
species within <strong>the</strong> blocks. Ecological lands units and o<strong>the</strong>r<br />
features were used <strong>to</strong> identify 72 distinct strata or “ELU-<br />
Groups.” One or more blocks were <strong>the</strong>n selected within<br />
each group based on biodiversity values, forest condition,<br />
feasibility of protection, landscape context and complementarities<br />
<strong>to</strong> <strong>the</strong> o<strong>the</strong>r blocks. A <strong>to</strong>tal of 176 “Tier 1”<br />
matrix forest blocks were identified (refer <strong>to</strong> Figure 10).<br />
Tier 2 blocks were also identified; <strong>the</strong>y met <strong>the</strong> criteria,<br />
but, based on current condition or feasibility or o<strong>the</strong>r fac<strong>to</strong>rs<br />
were deemed lower priority or alternate candidates at<br />
this time. The Tier 1 blocks encompass 27% of <strong>the</strong> ecoregion,<br />
however, <strong>the</strong> block boundaries are not necessarily<br />
intended as conservation area boundaries. TNC recommends<br />
a 10,000-hectare (25,000 acre) core reserve devoted<br />
<strong>to</strong> <strong>the</strong> res<strong>to</strong>ration of complete forest ecosystems with<br />
biological legacies and “old-growth” characteristics within<br />
each block, surrounded by lands secured from conversion<br />
<strong>to</strong> development. (Anderson et al. 2006).<br />
[ 46 ]
APPENDIX 2<br />
Ecological Land Unit Types Captured by Draft <strong>Wildlands</strong> <strong>Network</strong><br />
To represent <strong>the</strong> variation in ecological conditions that<br />
exists across <strong>the</strong> region, we used a data layer of Ecological<br />
Land Units (ELUs) developed by The Nature Conservancy<br />
(TNC) (Anderson et al. 1999, 2006; Groves et al. 2003).<br />
ELUs are unique combinations of three environmental fac<strong>to</strong>rs—elevation,<br />
geology and landform—that are important<br />
<strong>to</strong> <strong>the</strong> distribution and abundance of ecological communities<br />
in <strong>the</strong> ecoregion (Figure 16).<br />
Analyses by TNC and its partners indicated that<br />
smaller-scale ecosystems, communities and species locations<br />
were highly correlated with <strong>the</strong> types and diversity<br />
of ELUs (Anderson et al. 2006). The original ELU layer<br />
provided by <strong>the</strong> TNC consisted of many hundreds of<br />
unique combinations of elevation, geology and landform.<br />
These were subsequently consolidated in consultation<br />
with a TNC ecologist by combining similar categories<br />
within each elevation, geology and landform class (Table<br />
10). The final layer consisted of 162 unique combinations<br />
of elevation, geology and landform.<br />
The following is an example of a consolidated<br />
<strong>Wildlands</strong> Project ELU type:<br />
300000 Mid + 50000 Acidic Grantic + 2000<br />
Sideslope = 352000 Mid Elevation Acidic<br />
Granitic Sideslope<br />
Two ELU types (out of 162), very low elevation coves<br />
and flats underlain by ultramafic bedrock, are not captured<br />
in <strong>the</strong> draft network (Table 11). These ELU types are<br />
found on islands off <strong>the</strong> coast of Maine. The network captures<br />
between 13% and 100% of <strong>the</strong> remaining ELUs. On<br />
average <strong>the</strong> draft network captures 68.3% of each ELU<br />
type, greater than <strong>the</strong> high goal range set for ELUs<br />
(45–60%).<br />
FIGURE 16 Ecological Land Unit (ELU) key developed by TNC.<br />
Elevation Class (in feet) + Bedrock Class + Topographic Feature<br />
1000 very low 0–800 100 acidic sed/metased<br />
2000 low 800–1700 200 acidic shale<br />
3000 mid 1700–2500 300 calcareous sed/metased<br />
4000 high 2500–4000 400 mod calcareous sed/metased<br />
5000 alpine 4000+ 500 acidic granite<br />
600 mafic/intermediate granitic<br />
700 ultramafic<br />
Example:<br />
2000 low + 500 acidic granite + 32 wet flat = ELU2532<br />
low acidic granite wet flat<br />
10’s: Steep Slopes<br />
10 cliff<br />
11 steep slope<br />
12 slope crest<br />
13 upper slope<br />
14 flat summit<br />
20’s: Side Slopes<br />
20 sideslope—N/E<br />
21 cove—N/E<br />
22 sideslope—S/SW<br />
23 cove—S/SW<br />
30’s: Flats<br />
30 dry flat till or patchy sediment<br />
31 dry flat fine-grained sediment<br />
32 wet/moist flat<br />
33 slope bot<strong>to</strong>m<br />
34 dry flat coarse-grained sediment<br />
40’s: Aquatic<br />
40 stream<br />
41 river<br />
42 lake<br />
[ 47 ]
TABLE 10 Crosswalk and consolidation of <strong>Wildlands</strong> Project and TNC ELU layers.<br />
Ecological Land Unit Component TNC Code WP Code<br />
Elevation Class<br />
Coastal 0-20ft (0–6m) 1000 100000<br />
Very Low 20-800ft (6–244m) 2000 200000<br />
Low 800-1700ft (244–518m) 3000 300000<br />
High 1700-2500ft (518–762m) 4000 400000<br />
Very High 2500-4000ft (762–1219m) 5000 500000<br />
Alpine 4000+ ft (1219+ m) 6000 500000<br />
Bedrock Class<br />
Acidic sedimentary/metamorphic bedrock 100 10000<br />
Acidic shale bedrock 200 10000<br />
Calcareous sedimentary/metamorphic bedrock 300 30000<br />
Moderately calc sedimentary/metamorphic bedrock 400 30000<br />
Acidic granitic bedrock 500 50000<br />
Mafic/intermediate granitic bedrock 600 50000<br />
Ultramafic bedrock 700 70000<br />
Deep coarse sediments 800 80000<br />
Deep fine sediments 900 90000<br />
Topographic Feature<br />
Cliff 10 1000<br />
Steep slope 11 1000<br />
Slope crest 12 1200<br />
Upper Slope 13 1300<br />
Flat summit 14 1200<br />
Sideslope NE aspect 20 2000<br />
Cove NE aspect 21 2100<br />
Sideslope SW aspect 22 2000<br />
Cove SW aspect 23 2100<br />
Gently sloping flat 24 2400<br />
Dry flats 30 2400<br />
Wet flat 32 3200<br />
Slope bot<strong>to</strong>m 33 2100<br />
[ 48 ]
TABLE 11 Consolidated ELU types captured by Greater Nor<strong>the</strong>rn Appalachians wildlands network.<br />
Percent Percent Percent Percent<br />
captured captured captured captured<br />
by draft by draft by draft by draft<br />
ELU Type network ELU Type network ELU Type network ELU Type network<br />
102000 50% 231300 49% 351300 63% 471300 99%<br />
102100 28% 232000 37% 352000 66% 472000 98%<br />
102400 63% 232100 45% 352100 73% 472100 100%<br />
103200 100% 232400 29% 352400 67% 472400 99%<br />
111000 20% 233200 34% 353200 73% 473200 100%<br />
112000 28% 251000 67% 371000 99% 482100 97%<br />
112100 30% 251200 44% 371200 80% 482400 95%<br />
112400 24% 251300 42% 371300 75% 483200 96%<br />
113200 39% 252000 41% 372000 74% 511000 105%<br />
131000 100% 252100 46% 372100 79% 511200 98%<br />
132000 21% 252400 43% 372400 80% 511300 96%<br />
132100 34% 253200 54% 373200 87% 512000 97%<br />
132400 17% 271000 100% 382100 73% 512100 99%<br />
133200 26% 271200 91% 382400 64% 512400 95%<br />
151000 95% 271300 86% 383200 68% 513200 99%<br />
152000 32% 272000 71% 392100 53% 531000 97%<br />
152100 33% 272100 77% 392400 62% 531200 86%<br />
152400 24% 272400 77% 393200 63% 531300 79%<br />
153200 27% 273200 79% 411000 95% 532000 84%<br />
172100 0% 282100 38% 411200 81% 532100 95%<br />
172400 0% 282400 30% 411300 81% 532400 84%<br />
182100 29% 283200 34% 412000 86% 533200 100%<br />
182400 36% 292100 34% 412100 90% 551000 99%<br />
183200 42% 292400 22% 412400 88% 551200 99%<br />
192100 13% 293200 21% 413200 95% 551300 98%<br />
192400 20% 311000 61% 431000 102% 552000 99%<br />
193200 31% 311200 58% 431200 71% 552100 100%<br />
201000 59% 311300 59% 431300 74% 552400 100%<br />
202000 26% 312000 63% 432000 79% 553200 100%<br />
202100 41% 312100 68% 432100 81% 571000 100%<br />
202400 100% 312400 66% 432400 81% 571200 100%<br />
203200 100% 313200 70% 433200 83% 571300 100%<br />
211000 45% 331000 86% 451000 96% 572000 100%<br />
211200 39% 331200 48% 451200 90% 572100 100%<br />
211300 41% 331300 48% 451300 90% 572400 100%<br />
212000 42% 332000 52% 452000 93% 573200 100%<br />
212100 50% 332100 58% 452100 96% 582100 100%<br />
212400 36% 332400 55% 452400 92% 582400 100%<br />
213200 42% 333200 52% 453200 95%<br />
231000 74% 351000 81% 471000 100%<br />
231200 41% 351200 64% 471200 99%<br />
[ 49 ]
APPENDIX 3<br />
Detailed Methods Used <strong>to</strong> Create <strong>the</strong> <strong>Wildlands</strong> <strong>Network</strong><br />
Design at <strong>the</strong> State and Provincial Level<br />
To establish <strong>the</strong> location and extent of <strong>the</strong> network design<br />
elements, we used three major sources of information: 1)<br />
<strong>the</strong> results of <strong>the</strong> site selection analyses discussed above; 2)<br />
The Nature Conservancy’s Tier 1 matrix forest blocks<br />
(Anderson et al. 2006) 8 and 3) input from experts in <strong>the</strong><br />
states and provinces.<br />
To obtain expert input we conducted a series of meetings<br />
in Nova Scotia, New Brunswick, Québec, Vermont,<br />
New York and Maine from January through May 2006. 9<br />
We also consulted some experts by telephone.<br />
In those meetings we presented <strong>the</strong> results of <strong>the</strong> site<br />
selection analysis, <strong>the</strong>n sought <strong>to</strong>:<br />
■ determine <strong>the</strong> preferred scenario, or combination of<br />
scenarios, for <strong>the</strong> state or province based on local conservation<br />
knowledge;<br />
■ determine overlap with known areas of conservation<br />
value;<br />
■ identify areas of known conservation value that are<br />
not captured;<br />
■ discuss problems/deficiencies in <strong>the</strong> analysis; and<br />
■ discuss how this study should be communicated with<br />
o<strong>the</strong>r audiences.<br />
Nova Scotia Participants chose <strong>the</strong> best run of scenario 6<br />
(medium goals for all features; highest BLM of 0.01)—as<br />
<strong>the</strong> base scenario. They also recommended that we add certain<br />
elements from <strong>the</strong> best run of scenario 12 (highest goals<br />
for all features; highest BLM of 0.01), <strong>to</strong> capture o<strong>the</strong>r<br />
known areas of high ecological value and importance for<br />
connectivity. Participants also recommended that we reduce<br />
<strong>the</strong> scope of <strong>the</strong> design from that shown in scenario 6 in certain<br />
areas, such as <strong>the</strong> west coast and sou<strong>the</strong>rn end of Cape<br />
Bre<strong>to</strong>n. A number of linkages were also added based on<br />
expert knowledge. Proposed cores were based on planning<br />
units selected more than 50% of <strong>the</strong> time in scenario 6.<br />
Areas of High Biological Significance (HBS) were based on<br />
ei<strong>the</strong>r a) planning units selected 50% or less of <strong>the</strong> time in<br />
scenario 6, b) selected planning units added from scenario<br />
12, or c) hexagons added because <strong>the</strong>y represented important<br />
linkages, and were delineated using focal species source<br />
habitat data, existing Status 3 LPSCD’s, and color ortho<br />
maps from Google Earth. Where possible, all 3 types of<br />
HBS were matched <strong>to</strong> <strong>the</strong> boundaries of TNC’s Tier 1 Forest<br />
Matrix Blocks. In refining <strong>the</strong> network for Nova Scotia we<br />
were able <strong>to</strong> draw on <strong>the</strong> work of Beazley et al. (2005),<br />
which delineated potential areas of core and connectivity<br />
based on a representation, special elements, and focal species<br />
approach for <strong>the</strong> province.<br />
New Brunswick Participants chose <strong>the</strong> best run of scenario<br />
12 as <strong>the</strong> base scenario, <strong>the</strong>n recommended that we<br />
add elements of <strong>the</strong> best run of scenario 9 (higher focal<br />
species goals, lower representation goals, higher special<br />
element goals; highest BLM of 0.01). A number of linkages<br />
were added based on expert opinion that did not<br />
occur in ei<strong>the</strong>r scenario 9 or 12. Participants also recommended<br />
that we add blocks of old forest in <strong>the</strong><br />
Restigouche region that had been identified in separate<br />
mapping exercises. Proposed cores were delineated based<br />
on planning units selected more than 60% of <strong>the</strong> time in<br />
scenario 12. HBS lands were delineated based on ei<strong>the</strong>r a)<br />
planning units selected 60% or less of <strong>the</strong> time in scenario<br />
12, b) selected planning units added from scenario 9, c)<br />
unfragmented sections of Gage<strong>to</strong>wn military reserve, or d)<br />
hexagons added because <strong>the</strong>y represented important linkages<br />
based on expert opinion, and were delineated using<br />
focal species source habitat data, existing Status 3<br />
LPSCD’s, and color ortho maps from Google Earth. Where<br />
possible, HBS lands were matched <strong>to</strong> <strong>the</strong> boundaries of<br />
TNC’s Tier 1 Forest Matrix Blocks. Participants also recommended<br />
that we reduce <strong>the</strong> scope of <strong>the</strong> design plan<br />
from that shown in scenario 12 in <strong>the</strong> heavily used agricultural<br />
areas on <strong>the</strong> western border of New Brunswick.<br />
We also added a five km buffer around <strong>the</strong> network design<br />
elements. The area of this buffer is not included in <strong>the</strong> proposed<br />
network—only <strong>the</strong> area of <strong>the</strong> core, proposed core,<br />
or HBS land is included. The buffering is designed <strong>to</strong> provide<br />
flexibility in how resources are managed within a<br />
given area, while ensuring that a portion of <strong>the</strong> area will<br />
always be managed in support of <strong>the</strong> larger network.<br />
8. These matrix blocks were identified by TNC as part of <strong>the</strong>ir ecoregional assessment for <strong>the</strong> Nor<strong>the</strong>rn Appalachian/<strong>Acadia</strong>n ecoregion (Anderson et al.<br />
2006).<br />
9. Massachusetts was excluded from <strong>the</strong> analysis because only a very small portion of <strong>the</strong> state falls within <strong>the</strong> study area. Prince Edward Island was excluded<br />
because it is separated from <strong>the</strong> mainland by water and because its environment is so highly modified.<br />
[ 50 ]
Québec Local experts divided <strong>the</strong> area of <strong>the</strong> province in<br />
<strong>the</strong> study area in<strong>to</strong> three smaller regions: “Eastern,”<br />
“Central,” and Western,” and selected a preferred scenario<br />
for each subregion. These sections are similar <strong>to</strong> <strong>the</strong> subregions<br />
described Quebec’s ecological land classification<br />
system (Anderson et al. 2006). The Eastern section is<br />
equivalent <strong>to</strong> <strong>the</strong> Gaspé Peninsula; <strong>the</strong> Central section<br />
comprises <strong>the</strong> Temiscouata Hills with its limit somewhat<br />
offset <strong>to</strong> <strong>the</strong> west and capturing part of <strong>the</strong> Beauce area;<br />
and <strong>the</strong> Western section encompasses <strong>the</strong> two remaining<br />
Appalachian subregions: <strong>the</strong> Estrie-Beauce Plateaus and<br />
Hills and <strong>the</strong> Greens and White Mountains.<br />
For <strong>the</strong> Eastern section, planning units were included<br />
from <strong>the</strong> best run of scenario 9. Within <strong>the</strong> Eastern section,<br />
cores were delineated where <strong>the</strong> summed runs values from<br />
scenario 9 were greater than 80%. Planning units with values<br />
less than 80% were included as areas of high biological<br />
significance (HBS). For <strong>the</strong> Central section, planning units<br />
were included from <strong>the</strong> best run of scenario 9. Within this<br />
best run, core areas were identified as those with summedrun<br />
values of greater than 70%. We chose relatively high<br />
cu<strong>to</strong>ff percentages for <strong>the</strong> Eastern and Central regions, in<br />
consultation with local experts, because of <strong>the</strong> large amount<br />
of public land and core protected areas in this part of Québec.<br />
For <strong>the</strong> Western section, planning units were included from<br />
<strong>the</strong> best runs of scenario 6 and scenario 12. Planning units<br />
with summed-runs values greater than 50% for scenario 6,<br />
and 60% for scenario 12 were included as cores.<br />
Vermont Meeting participants identified <strong>the</strong> summed<br />
runs of scenario 11 (higher goals for focal species, representation,<br />
and special elements; moderate BLM of 0.01) as<br />
<strong>the</strong> preferred scenario. In <strong>the</strong> network outline we included<br />
planning units containing more than 50% of Tier 1 or 2<br />
matrix blocks, more than 10% of Status 1 or 2 LPSCDs,<br />
and more than 25% of Status 3 LPSCDs. We also included<br />
additional planning units using <strong>the</strong> summed runs for<br />
Scenario 11. As much as possible, <strong>the</strong>se planning units<br />
were added based on focal species data, Vermont Land<br />
Cover data, and <strong>the</strong> recommendations of <strong>the</strong> Vermont<br />
meeting. Cores were delineated within <strong>the</strong> draft network<br />
based on high summed run values, wilderness, proposed<br />
wilderness and roadless areas, Tier 1 Matrix blocks, and<br />
land use/land cover. After reviewing <strong>the</strong> results of <strong>the</strong><br />
analysis for <strong>the</strong> St. Lawrence/Champlain portion of<br />
Vermont, local experts concluded that <strong>the</strong> results were not<br />
robust enough <strong>to</strong> support <strong>the</strong> identification of a network<br />
design in most of <strong>the</strong> St. Lawrence/Champlain ecoregion<br />
since <strong>the</strong> input data consisted only of focal-species features.<br />
The Lower New England ecoregion has similar data<br />
gaps; <strong>the</strong>re is however a probable linkage between <strong>the</strong><br />
<strong>Adirondacks</strong> and Vermont in this ecoregion. The site<br />
selection analysis under Scenario 11 shows a large block of<br />
planning units selected with high frequency. We reviewed<br />
<strong>the</strong>se results with local experts and <strong>the</strong>y concurred that <strong>the</strong><br />
planning units selected with high frequency, mostly in <strong>the</strong><br />
Lake Bomoseen area <strong>to</strong> <strong>the</strong> east of Lake George, were<br />
indeed important and should be included in <strong>the</strong> network.<br />
Linkages between <strong>the</strong> Lake Bomoseen complex and important<br />
core and proposed core areas in sou<strong>the</strong>rn Vermont<br />
were also identified by during <strong>the</strong> review process.<br />
New York Workshop participants recommended that we<br />
add relatively small amounts of new core protected areas <strong>to</strong><br />
<strong>the</strong> base of exiting protected areas within <strong>the</strong> “Blue Line”<br />
Adirondack Park boundary, focusing on ensuring that connectivity<br />
between <strong>the</strong> Park and o<strong>the</strong>r areas of <strong>the</strong> region be<br />
maintained or res<strong>to</strong>red. Important connectivity regions<br />
identified include: 1) <strong>the</strong> linkage with Tug Hill Plateau, 2)<br />
<strong>the</strong> Algonquin <strong>to</strong> Adirondack linkage with Algonquin<br />
Provincial Park (Quinby et al. 1999, 2000) and 3) <strong>the</strong><br />
linkage with Vermont south of Lake Champlain. In <strong>the</strong><br />
network outline we included planning units containing<br />
more than 50% of Tier 1 matrix blocks, more than 10% of<br />
Status 1 or 2 LPSCDs and more than 25% of Status 3<br />
LPSCDs. We also included planning units using <strong>the</strong> best<br />
runs for scenario 5 (medium goals for all 3 tracks; moderate<br />
BLM of 0.01) intersected with values from <strong>the</strong><br />
summed runs of scenario 5. Those planning units included<br />
in <strong>the</strong> best run and selected more than 50% of <strong>the</strong> time<br />
in <strong>the</strong> summed runs were included in <strong>the</strong> network. We<br />
excluded planning units selected within <strong>the</strong> St.<br />
Lawrence/Champlain ecoregion unless <strong>the</strong>y fall within <strong>the</strong><br />
three linkages noted above, and planning units falling on<br />
selected hamlets within <strong>the</strong> Blue Line (reflecting feedback<br />
from meeting participants).<br />
Maine We conducted five meetings that did not achieve<br />
consensus around a single scenario that should serve as <strong>the</strong><br />
basis for fur<strong>the</strong>r conservation planning, though <strong>the</strong>re was<br />
somewhat more agreement around scenario 8 (higher<br />
goals for focal species, lower goals for representation, and<br />
higher goals for special elements, moderate BLM of<br />
0.001). The best run of scenario 8 was consequently used<br />
as <strong>the</strong> basis for a first draft, with o<strong>the</strong>r inputs, as follows:<br />
1) include planning units containing more than 10% of<br />
Status 1 and 2 lands; 2) include planning units containing<br />
more than 50% of Status 3 lands; 3) include planning<br />
[ 51 ]
units containing more than 50% of Tier 1 Matrix Blocks;<br />
4) include planning units from <strong>the</strong> best run of scenario 8<br />
that were selected more than 60% of <strong>the</strong> time when <strong>the</strong><br />
summed runs output is overlaid on <strong>to</strong>p of <strong>the</strong> best run for<br />
<strong>the</strong> scenario; include linkages that were not in any of <strong>the</strong><br />
sources above, but that were identified by local experts in<br />
meetings on 15-17 March 2006. As much as possible,<br />
focal species data was used in <strong>the</strong> placement of <strong>the</strong>se linkages.<br />
This entire outline was <strong>the</strong>n intersected with values<br />
from <strong>the</strong> unclipped summed runs of scenario 8. Those<br />
planning units selected 80% or more were designated as<br />
cores. Planning units selected 80% or less were designated<br />
as areas of High Biological Significance.<br />
We returned in May 2006 <strong>to</strong> review <strong>the</strong> first draft with<br />
a set of experts in a daylong meeting. That meeting produced<br />
several changes that have been incorporated in<strong>to</strong> <strong>the</strong><br />
current network design , including <strong>the</strong> addition of lands of<br />
high biological significance in Downeast Maine (based on<br />
scenario 12), <strong>the</strong> addition of a linkage along <strong>the</strong> upper St.<br />
John river in far nor<strong>the</strong>rn Maine (based on expert opinion),<br />
and <strong>the</strong> elimination of several gaps within and between HBS<br />
lands in nor<strong>the</strong>rn and western Maine (based on expert opinion<br />
plus summed-summed runs and alternate scenarios.)<br />
During both visits, reviewers questioned <strong>the</strong> gaps in<br />
<strong>the</strong> lynx source and threatened source dataset used as an<br />
input <strong>to</strong> <strong>the</strong> MARXAN model. See <strong>the</strong> discussion of this<br />
issue in limitations<br />
New Hampshire We did not conduct face-<strong>to</strong>-face meetings<br />
in New Hampshire because such a large portion of <strong>the</strong><br />
state in <strong>the</strong> study area is already in some form of conservation.<br />
Instead we drafted a proposed design for <strong>the</strong> state and<br />
sent it <strong>to</strong> several local external reviewers for <strong>the</strong>ir consideration.<br />
In addition, two experts from New Hampshire<br />
attended face-<strong>to</strong>-face meetings in Maine. The design outline<br />
included planning units containing more than 50% of<br />
Tier 1 matrix blocks, more than 10% of Status 1 or 2<br />
LPSCDs, and more than 25% of Status 3 LPSCDs. We<br />
delineated proposed cores by intersecting <strong>the</strong> network outline<br />
with summed runs values from scenario 11. We used<br />
scenario 11 because of its use in both Vermont and Maine.<br />
Planning units selected 70% or more were included as<br />
cores. Planning units selected less than 70% were included<br />
as areas of high biological significance. One reviewer<br />
recommended some additions <strong>to</strong> <strong>the</strong> resulting design<br />
based on local knowledge, which were incorporated.<br />
After our initial visits or contacts with reviewers, we<br />
developed draft network designs for each state or province.<br />
These were sent <strong>to</strong> reviewers with <strong>the</strong> following questions.<br />
■ Does this draft design capture major elements of terrestrial<br />
biodiversity<br />
■ Are <strong>the</strong>re major areas lacking<br />
■ Is <strong>the</strong> extent and placement of proposed cores correct<br />
and adequate Too much, <strong>to</strong>o little<br />
■ Is <strong>the</strong> extent and placement of areas of High<br />
Biological Significance correct and adequate<br />
■ Are linkages, in-state and <strong>to</strong> o<strong>the</strong>r states and<br />
provinces, in <strong>the</strong> right places<br />
■ Does this reflect <strong>the</strong> input you provided during <strong>the</strong><br />
review meeting(s)<br />
[ 52 ]
APPENDIX 4<br />
Experts Who Participated in Meetings or Were O<strong>the</strong>rwise<br />
Consulted in <strong>the</strong> Development of <strong>the</strong> <strong>Network</strong> Design<br />
The following individuals participated in meetings conducted in <strong>the</strong> states<br />
and provinces, or were o<strong>the</strong>rwise consulted, during <strong>the</strong> January–May 2006<br />
network design process. Their participation does not imply endorsement of<br />
<strong>the</strong> views or findings in this document.<br />
Name<br />
Mark Anderson, Ph.D.<br />
Elizabeth Dennis Baldwin, Ph.D.<br />
Robert Baldwin, Ph.D.<br />
Peter Bauer<br />
Douglas Bechtel<br />
Kathleen Bell, Ph.D.<br />
Mat<strong>the</strong>w Betts, Ph.D.<br />
Bill Brown<br />
Robert Bryan, M.S.<br />
Dirk Bryant<br />
Michael Carr<br />
Carlos Carroll, Ph.D.<br />
Barbara Charry, M.S.<br />
Diano Circo<br />
Roberta Clowater<br />
Charles Clusen<br />
David Coon<br />
Andrew Cutko<br />
Kathleen Daly<br />
John Davis<br />
Kermit deGooyer<br />
Bart DeWolf, Ph.D.<br />
Michael DiNunzio<br />
Maureen Drouin<br />
Stéphanie Duguay<br />
Kathleen Fitzgerald<br />
Graham Forbes, Ph.D.<br />
Fritz Gerhardt, Ph.D.<br />
David Gibson<br />
William Ginn<br />
Michale Glennon, Ph.D.<br />
Louise Grat<strong>to</strong>n<br />
John Harbison<br />
Daniel Harrison, Ph.D.<br />
Francine Hone<br />
Brian Houseal<br />
Donald Katnik, Ph.D.<br />
Affiliation<br />
The Nature Conservancy<br />
University of Maine<br />
Two Countries, One Forest<br />
Residents Committee <strong>to</strong> Protect <strong>the</strong> <strong>Adirondacks</strong><br />
The Nature Conservancy<br />
University of Maine<br />
Greater Fundy Ecosystem Research Group, University of New Brunswick<br />
Adirondack Nature Conservancy and Land Trust<br />
Maine Audubon<br />
Adirondack Nature Conservancy and Land Trust<br />
Adirondack Nature Conservancy and Land Trust<br />
Klamath Center for Conservation Research<br />
Maine Audubon<br />
Natural Resources Council of Maine<br />
Canadian Parks and Wilderness Society New Brunswick Chapter<br />
Natural Resources Defense Council<br />
Conservation Council of New Brunswick<br />
NatureServe<br />
Trust for Public Land<br />
Adirondack Council<br />
Ecology Action Centre<br />
Elliotsville Plantation<br />
Association for <strong>the</strong> Protection of <strong>the</strong> <strong>Adirondacks</strong><br />
Sierra Club—Maine Office<br />
Appalachian Corridor<br />
No<strong>the</strong>ast Wilderness Trust<br />
University of New Brunswick<br />
Northwoods Stewardship Center<br />
Association for <strong>the</strong> Protection of <strong>the</strong> <strong>Adirondacks</strong><br />
The Nature Conservancy<br />
Wildlife Conservation Society<br />
Nature Conservancy of Canada/Appalachian Corridor<br />
Sierra Club<br />
University of Maine<br />
Appalachian Corridor<br />
Adirondack Council<br />
Maine Department of Inland Fisheries &Wildlife<br />
[ 53 ]
Kasey Legaard<br />
Robert Long, Ph.D.<br />
Alex MacDonald<br />
Josette Maillet<br />
Chris<strong>to</strong>pher Miller, Ph.D.<br />
Margo Morrison<br />
John Nordgren<br />
James Northup<br />
Jamie Phillips<br />
Spencer Phillips, Ph.D.<br />
Agnieszka Pinette<br />
Raymond Plourde<br />
Connie Prickett<br />
David Publicover, D.F.<br />
Kristen Puryear<br />
Peter Quinby, Ph.D.<br />
Justina Ray, Ph.D.<br />
Clément Robidoux<br />
John Roe<br />
Joshua Royte<br />
Steven Sader, Ph.D.<br />
Jim Shallow<br />
Margo Sheppard<br />
Inuk Simard<br />
Erin Simons<br />
Michael Soulé, Ph.D.<br />
Jym St. Pierre<br />
Sally S<strong>to</strong>ckwell, Ph.D.<br />
James Sullivan<br />
Bonnie Su<strong>the</strong>rland<br />
John Terborgh, Ph.D.<br />
Michael Tetreault<br />
Elizabeth Thompson<br />
Stephen Trombulak, Ph.D.<br />
Barbara Vickery<br />
Karen Woodsum<br />
Gillian Woolmer<br />
University of Maine<br />
University of Vermont<br />
Canadian Parks and Wilderness Society Nova Scotia Chapter<br />
Nature Conservancy of Canada<br />
Ecologist<br />
Nature Conservancy of Canada<br />
The Henry P. Kendall Foundation<br />
Forest Watch<br />
Eddy Foundation/<strong>Wildlands</strong> Project<br />
Northwoods Stewardship Center<br />
Maine Department of Conservation, Land Use Regulation Commission<br />
Ecology Action Centre<br />
Adirondack Nature Conservancy and Land Trust<br />
Appalachian Mountain Club<br />
Maine Department of Conservation<br />
Pymatuning Labora<strong>to</strong>ry of Ecology, University of Pittsburgh<br />
Wildlife Conservation Society Canada<br />
Appalachian Corridor<br />
The Nature Conservancy<br />
The Nature Conservancy<br />
University of Maine<br />
Audubon Vermont<br />
Nature Trust of New Brunswick<br />
Conservation Council of New Brunswick<br />
University of Maine<br />
UC Santa Cruz/<strong>Wildlands</strong> Project<br />
RESTORE: The North Woods<br />
Maine Audubon<br />
Two Countries, One Forest<br />
Nova Scotia Nature Trust<br />
Duke University/<strong>Wildlands</strong> Project<br />
The Nature Conservancy<br />
University of Vermont/Vermont Land Trust/The Nature Conservancy<br />
Middlebury College<br />
The Nature Conservancy<br />
Sierra Club—Maine Office<br />
Wildlife Conservation Society Canada<br />
[ 54 ]
REFERENCES<br />
Andelman, S.J., and M.R. Willig. 2003. Present patterns and future<br />
prospects for biodiversity in <strong>the</strong> Western Hemisphere. Ecology<br />
Letters 6:818-824.<br />
Anderson, M., F. Biasi, and S. Buttrick. 1998. Conservation Site Selection:<br />
Ecoregional Planning for Biodiversity. Environmental Systems<br />
Research Institute (ESRI) Proceedings of 1998 User Conference.<br />
http://gis.esri.com/library/userconf/proc98/proceed/<strong>to</strong>500/pap465/p4<br />
65.htm<br />
Anderson, M., P. Comer, D. Grossman, C. Groves, K. Poiani, M. Reid,<br />
R. Schneider, B. Vickery and A. Weakley. 1999. Guidelines for representing<br />
ecological communities in ecoregional conservation plans.<br />
Bos<strong>to</strong>n, MA: The Nature Conservancy.<br />
Anderson, M., et. al. 2006. Nor<strong>the</strong>rn Appalachian/<strong>Acadia</strong>n Ecoregional<br />
Plan. Bos<strong>to</strong>n, MA: The Nature Conservancy.<br />
Ardron, J. 2003. BC Coast Information Team Marine Ecosystem Spatial<br />
Analysis, v. 1.2. Excerpted and revised from: Rumsey, C., J. Ardron,<br />
K. Ciruna, T. Curtis, F. Doyle, Z. Ferdana, T. Hamil<strong>to</strong>n, K.<br />
Heinemyer, P. Iachetti, R. Jeo, G. Kaiser, D. Narver, R. Noss, D.<br />
Sizemore, A. Tautz, R. Tingey, K. Vance-Borland. An ecosystem<br />
analysis for Haida Gwaii, Central Coast, and North Coast British<br />
Columbia. DRAFT, Sept. 22, 2003. (184 pages.) www.livingoceans.org/library.htm.<br />
44 pages.<br />
Austin P., 2005. Plum Creek’s big plan. Hallowell, ME: Maine<br />
Environmental Policy Institute.<br />
Bailey, R. G. 1998. Ecoregions: <strong>the</strong> ecosystem geography of oceans and<br />
continents. New York: Springer-Verlag.<br />
Bailey, R. G. 2002. Ecoregions: ecoregion-based design for sustainability.<br />
New York: Springer-Verlag.<br />
Bailey, R.G., P.E. Avers, T. King, and W. H. McNab (eds.). 1994.<br />
Ecoregions and subregions of <strong>the</strong> United States (map) (supplementary<br />
table of map unit descriptions compiled and edited by McNab,<br />
W.H. and Bailey, R.G.): Washing<strong>to</strong>n, D.C., U.S. Department of<br />
Agriculture-Forest Service, scale 1:7,500,000. (See also<br />
http://www.fs.fed.us/land/pubs/ecoregions/index.html; Maps and<br />
descriptions are available at: http://www.fs.fed.us/institute/ecolink.html.)<br />
Ball, I. R., 2000. Ma<strong>the</strong>matical applications for conservation ecology:<br />
<strong>the</strong> dynamics of tree hollows and <strong>the</strong> design of nature reserves. PhD<br />
Thesis. Adelaide, Australia: The University of Adelaide.<br />
Ball, I. R. and H. P. Possingham. 2000. MARXAN (V1.8.2): Marine<br />
reserve design using spatially explicit annealing, a manual.<br />
http://www.ecology.uq.edu.au/marxan.htm. Accessed 10 November<br />
2005.<br />
Beazley, K. and N. Cardinal. 2004. A systematic approach for selecting<br />
focal species for conservation in <strong>the</strong> forests of Nova Scotia and Maine.<br />
Environmental Conservation 31(2): 91-101.<br />
Beazley, K., L. Smandych, T. snaith, F. MacKinnon, P. Austin-Smith,<br />
and P. Duinker. 2005. Biodiversity considerations in conservation<br />
system planning: map-based approach for Nova Scotia, Canada.<br />
Ecological Applications 15(6): 2192-2208.<br />
Cardillo, M., G. M. Mace, J. L. Gittleman and A. Purvis. 2006. Latent<br />
extinction risk and <strong>the</strong> future battlegrounds of mammal conservation.<br />
Proceedings of <strong>the</strong> National Academy of Science (PNAS) 103<br />
(11): 4157-4161.<br />
Carroll, C. 2003. Impacts of landscape change on wolf viability in <strong>the</strong><br />
nor<strong>the</strong>astern U.S. and sou<strong>the</strong>astern Canada: implications for wolf<br />
recovery. <strong>Wildlands</strong> Project Special Paper No. 5. Richmond, VT:<br />
<strong>Wildlands</strong> Project. 31 pp.<br />
Carroll, C. 2005. Carnivore res<strong>to</strong>ration in <strong>the</strong> nor<strong>the</strong>astern U.S. and<br />
sou<strong>the</strong>astern Canada: a regional-scale analysis of habitat and population<br />
viability for wolf, lynx, and marten (Report 2: lynx and marten<br />
viability analysis). <strong>Wildlands</strong> Project Special Paper No. 6.<br />
Richmond, VT: <strong>Wildlands</strong> Project. 46 pp.<br />
Carroll, C., R. F. Noss, and P. C. Paquet. 2001. Carnivores as focal<br />
species for conservation planning in <strong>the</strong> Rocky Mountain region.<br />
Ecological Applications 11:961-980.<br />
Carroll, C., R. F. Noss, P. C. Paquet, and N. H. Schumaker. 2003. Use<br />
of population viability analysis and reserve selection algorithms in<br />
regional conservation plans. Ecological Applications 13:1773-1789.<br />
Chapin, T. G., D. J. Harrison, and D. D. Katnik. 1998. Influence of<br />
landscape pattern on habitat use by American marten in an industrial<br />
forest. Conservation Biology 12:1327-1337.<br />
Charles, T., L. Hughes, S. Walker, R. Colman, S. Wilson, J. Scott, and<br />
A. Lavers. 1999. Introduction <strong>to</strong> <strong>the</strong> GPI natural resource accounts.<br />
Genuine Progress Index for Atlantic Canada (GPIAtlantic).<br />
www.gpiatlantic.org. Accessed 22 May 2006.<br />
Cogbill, C. V., J. Burk, and G. Motzkin. 2002. The forests of presettlement<br />
New England, USA: spatial and compositional patterns based<br />
on <strong>to</strong>wn proprie<strong>to</strong>r surveys. Biogeography 29 (10/11):1279-1304.<br />
Crist, P. J. 2000. Mapping and Categorizing Land Stewardship. Version<br />
2.1.0. U.S. Geological Survey. National GAP Program. February<br />
2000.<br />
deCalesta, D. S. 1994. Effect of white-tailed deer on songbirds within<br />
managed forests in Pennsylvania. Journal of Wildlife Management<br />
58 (4):711-718.<br />
ESRI. 2002. ESRI Data & Maps [CD-ROM]. Redlands, CA:<br />
Environmental Systems Research Institute.<br />
Ecological Stratification Working Group (ESWG). 1996. National ecological<br />
framework for Canada. (available at http://sis.agr.gc.ca/cansis/publications/ecostrat/).<br />
Estes, J. A., N. S. Smith and J. F. Palmisano. 1978. Sea otter predation<br />
and community organization in <strong>the</strong> western Aleutian Islands,<br />
Alaska. Ecology 59:822-833.<br />
Evers, D. 2005. Mercury Connections: The extent and effects of mercury<br />
pollution in nor<strong>the</strong>astern North America. Gorham, ME:<br />
BioDiversity Research Institute. 28 pages. www.briloon.org<br />
Forman, R.T.T., D. S. Friedman, D. Fitzhenry, J. D. Martin, A. S. Chen,<br />
and L. E. Alexander. 1997. Ecological effects of roads: Toward three<br />
summary indices and an overview of North America. In: Canter, K.<br />
[ 55 ]
(ed.) Habitat Fragmentation and Infrastructure. Minister of<br />
Transport and Public Works and Water Management. Delft,<br />
Ne<strong>the</strong>rlands, pp. 40-54.<br />
Foreman, D., K. Daly, R. Noss, M. Clark, K. Menke, D. R. Parsons and<br />
R. Howard. 2003. New Mexico highlands wildlands network vision:<br />
connecting <strong>the</strong> Sky Islands <strong>to</strong> <strong>the</strong> Sou<strong>the</strong>rn Rockies. Richmond,<br />
Vermont: <strong>Wildlands</strong> Project.<br />
Foster, D. R., D. Kittredge, B. Donahue, G. Motzkin, D. Orwig, A.<br />
Ellison, B. Hall, B. Colburn and A. D’Ama<strong>to</strong>. 2005. <strong>Wildlands</strong> and<br />
woodlands: a vision for <strong>the</strong> forests of Massachusetts. Petersham, MA:<br />
Harvard Forest, Harvard University. http://harvardforest.fas.harvard.edu/wandw/index.html<br />
Gibeau, M.L. and K. Heuer. 1996. Effects of transportation corridors on<br />
large carnivores in <strong>the</strong> Bow River Valley, Alberta. Florida<br />
Department of Transportation Report FL-ER-58-96, pp. 75-89.<br />
Groves, C. R., and M. W. Beck, J. V. Higgins and E. C. Saxon. 2003.<br />
Drafting a conservation blueprint: a practitioner’s guide <strong>to</strong> planning<br />
for biodiversity. Washing<strong>to</strong>n, DC: Island Press.<br />
Henke, S. E. and F. C. Bryant. 1999. Effects of coyote removal on <strong>the</strong><br />
faunal community in Western Texas. Journal of Wildlife<br />
Management 63(4):1066-1081.<br />
Hagan, J.M., L.C. Irland, and A.A. Whitman. 2005. Changing timberland<br />
ownership in <strong>the</strong> nor<strong>the</strong>rn forest and implications for biodiversity.<br />
Brunswick, ME: Manomet Center for Conservation Sciences,<br />
Report # MCCS-FCP- 2005-1. 25 pp.<br />
Harrison, D. J. and T. G. Chapin. 1998. Extent and connectivity of<br />
habitat for wolves in eastern North America. Wildlife Society<br />
Bulletin 26(4): 767-775.<br />
Hepinstall, J. A., D. J. Harrison, and D. C. Payer. In prep. Predicting<br />
changes in habitat supply and potential abundance for American<br />
marten in Maine.<br />
Hoving, C. L. 2001. His<strong>to</strong>rical occurrence and habitat ecology of<br />
Canada Lynx (Lynx canadensis) in eastern North America. M.S.<br />
Thesis, University of Maine, Orono, ME. 226 pp.<br />
Hoving, C. L., R. A. Joseph, and W. B. Krohn. 2003. Recent and his<strong>to</strong>rical<br />
distributions of Canada lynx in Maine and <strong>the</strong> nor<strong>the</strong>ast.<br />
Nor<strong>the</strong>astern naturalist 10:363-382.<br />
Hoving, C. L., D. J. Harrison, W. B. Krohn, W. J. Jakubas, and M. A.<br />
McCollough. 2004. Canada lynx habitat and forest succession in<br />
nor<strong>the</strong>rn Maine, United States. Wildlife Biology 10:285-294.<br />
Hoving, C. L., D. J. Harrison, W. B. Krohn, R. A. Joseph, and M.<br />
O’Brien. 2005. Broad-scale predictions of Canada lynx occurrence in<br />
eastern North America. Journal of Wildlife Management 69(2):<br />
739-751.<br />
Irland, L. C. 1999. The Nor<strong>the</strong>ast’s changing forest. Hanover, NH:<br />
University Press of New England.<br />
Jones, A, J. Catlin, T. Lind, J. Frelich, K. Robinson, L. Flaherty, E.<br />
Molvar, J. Kessler, K. Daly. 2004. Heart of <strong>the</strong> west conservation<br />
plan. Salt Lake City, UT: Wild Utah Project. www.wildutahproject.org.<br />
Kavanagh, K., M. Sims, T. Gray, N. Zinger, L. Grat<strong>to</strong>n. 2001. Eastern<br />
Great Lakes lowland forests (NA0407). World Wildlife Fund.<br />
Keys, Jr., J.; C. Carpenter, S. Hooks, F. Koenig, W. H. McNab, W.<br />
Russell, M. L. Smith. 1995. Ecological units of <strong>the</strong> eastern United<br />
States—first approximation. Washing<strong>to</strong>n, DC: U.S. Department of<br />
Agriculture, Forest Service. (available at: http://www.srs.fs.usda.gov/<br />
econ/data/keys/).<br />
Kullberg, C. and J. Ekman. 2000. Does predation maintain tit community<br />
diversity Oikos 89:41-45.<br />
Lambeck, R. J. 1997. Focal species: A multi-species umbrella for nature<br />
conservation. Conservation Biology 11(4):849-856.<br />
Lawler, J. J., D. White, and L. L. Master. 2003. Integrating representation<br />
and vulnerability: two approaches for prioritizing areas for conservation.<br />
Ecological Applications 13 (6): 1762-1772.<br />
Leslie, H., M. Ruckelshaus, I. R. Ball, S. Andelman, and H. P.<br />
Possingham. 2003. Using siting algorithms in <strong>the</strong> design of marine<br />
reserve networks. Ecological Applications 13:S185–S198.<br />
Li, T and J.P. Ducruc. 1999. Les province naturelles. Niveau I du<br />
écologique de référence du Québec. Ministère de l’Environnement,<br />
Direction de la conservation et du patrimoine écologique. (see also:<br />
http://www.mddep.gouv.qc.ca/biodiversite/aires_protegees/province<br />
s/index.htm)<br />
Legislative Assembly of New Brunswick. 2004. Final report on wood<br />
supply in New Brunswick. Select Committee on Wood Supply. First<br />
Session, Fifty-fifth Legislature. September 2004.<br />
Lorimer, C. G. 1977. The presettlement forest and natural disturbance<br />
cycle of nor<strong>the</strong>astern Maine. Ecology 58:139-148.<br />
Land Use Regulation Commission (LURC). 1997. Comprehensive Land<br />
Use Plan For Areas Within <strong>the</strong> Jurisdiction of <strong>the</strong> Maine Land Use<br />
Regulation Commission. Augusta, ME: Land Use Regulation<br />
Commission.<br />
Margules, C. R., and R. L. Pressey. 2000. Systematic conservation planning.<br />
Nature 405:243-253.<br />
Marshall, I. B. and P. H. Schut. 1999. A national ecological framework<br />
for Canada: overview. Ecosystems Science Direc<strong>to</strong>rate, Environment<br />
Canada and Research Branch, Agriculture and Agri-Food Canada<br />
(available at http://sis.agr.gc.ca/cansis/nsdb/ecostrat/)<br />
McGraw, J. B. and M. A. Furedi. 2005. Deer browsing and population<br />
viability of a forest unders<strong>to</strong>ry plant. Science 307:920-922.<br />
McKibben, W. 1995. An explosion of green. Atlantic Monthly<br />
275(4):61-83.<br />
McShea, W. J. and J. H. Rappole. 1997. Herbivores and <strong>the</strong> ecology of<br />
forest unders<strong>to</strong>ry birds. In: The science of overabundance: deer ecology<br />
and population management, ed. W. J. McShea, H. B.<br />
Underwood, and J. H. Rappole. Washing<strong>to</strong>n, D.C.: Smithsonian<br />
Institution Press.<br />
Miller, B., D. Foreman, M. Fink, D. Shinneman, J. Smith, M. DeMarco,<br />
M. Soulé, R. Howard. 2003. Sou<strong>the</strong>rn Rockies wildlands network<br />
vision: a science-based approach <strong>to</strong> rewilding <strong>the</strong> Sou<strong>the</strong>rn Rockies.<br />
Boulder, CO: Sou<strong>the</strong>rn Rockies Ecosystem Project.<br />
Miller, B., R. Reading, J. Strittholt, C. Carroll, R. F. Noss, M. E. Soulé,<br />
O. Sanchez, J. Terborgh, D. Brightsmith, T. Cheeseman, and D.<br />
Foreman. 1998. Using focal species in <strong>the</strong> design of reserve networks.<br />
Wild Earth 8(4): 81-92.<br />
[ 56 ]
Mladenoff, D. J., and T. A. Sickley. 1999. Assessing potential gray wolf<br />
res<strong>to</strong>ration in <strong>the</strong> nor<strong>the</strong>astern United States: a spatial prediction of<br />
favorable habitat and potential population levels. Journal of Wildlife<br />
Management 62:1-10.<br />
Neily, Peter D., E. Quigley, L. Benjamin, B. Stewart, T. Duke. 2003.<br />
Ecological land classification for Nova Scotia: Volume 1—Mapping<br />
Nova Scotia’s terrestrial ecosystems. Nova Scotia Department of<br />
Natural Resources, Renewable Resources Branch, April 2003,<br />
Report DNR 2003-2 (available at: http://www.gov.ns.ca/natr/<br />
forestry/reports/ELCrevised2.pdf)<br />
Newmark, W.D. 1985. Legal and biotic boundaries of western North<br />
American national parks: a problem of congruence. Biological<br />
Conservation 33:197-208.<br />
Newmark, W.D. 1995. Extinction of mammal populations in western<br />
North American national parks. Conservation Biology 9(3):512-<br />
526.<br />
Nor<strong>the</strong>rn Forest Alliance. 1999. Forestry for <strong>the</strong> future. Montpelier, VT:<br />
Nor<strong>the</strong>rn Forest Alliance.<br />
Nor<strong>the</strong>rn Forest Alliance. 2002. Shaping <strong>the</strong> nor<strong>the</strong>rn forest economy:<br />
strategies for a sustainable future. Montpelier, VT: Nor<strong>the</strong>rn Forest<br />
Alliance. http://www.nor<strong>the</strong>rnforestalliance.org/newspubs/pdfs/<br />
2002econreport.pdf.<br />
Nor<strong>the</strong>rn Forest Lands Council (NFLC). 2005. 10th anniversary forum:<br />
final report. Recommendations for <strong>the</strong> conservation of <strong>the</strong> nor<strong>the</strong>rn<br />
forest. Concord, NH: North East State Foresters Association.<br />
Noss, R. 2003. A checklist for wildlands network designs. Conservation<br />
Biology 17(5):1-7.<br />
Noss, R. F. and A. Y. Cooperrider. 1994. Saving nature’s legacy: protecting<br />
and res<strong>to</strong>ring biodiversity. Washing<strong>to</strong>n, D.C.: Island Press.<br />
Noss, R. F., J. R. Strittholt, K. Vance-Borland, C. Carroll and P. Frost.<br />
1999a. A conservation plan for <strong>the</strong> Klamath-Siskiyou ecoregion.<br />
Natural Areas Journal 19:392–411.<br />
Noss, R.F., E. Dinerstein, B. Gilbert, M. Gilpin, B. Miller, J. Terborgh,<br />
and S. Trombulak. 1999b. Core areas: where nature reigns. In: Soulé,<br />
M. E. and J. Terborgh (eds.) Continental Conservation: scientific<br />
foundations of regional reserve networks. Washing<strong>to</strong>n, DC: Island<br />
Press.<br />
Noss, R. F., C. Carroll, K. Vance-Borland and G. Wuerthner. 2002. A<br />
multicriteria assessment of <strong>the</strong> irreplaceability and vulnerability of<br />
sites in <strong>the</strong> greater Yellows<strong>to</strong>ne ecosystem. Conservation Biology<br />
16(4): 895-908.<br />
Olson, D. M., E. Dinerstein, E. D. Wikramanaya, N. D. Burgess, G. V.<br />
N. Powell, E. C. Underwood, J. A. D’amico, I. I. Toua, H. E. Strand,<br />
J. C. Morrison, C. J. Loucks, T. F. Allnutt, T. H. Ricketts, Y. Kura,<br />
J. F. Lamoreux, W. W. Wettengel, P. Hedao, and K. R. Kassem.<br />
2001. Terrestrial ecoregions of <strong>the</strong> world: a new map of life on earth.<br />
Bioscience 51(11): 933-938.<br />
Omernik, J.M. 1987. Ecoregions of <strong>the</strong> conterminous United States.<br />
Map (scale 1:7,500,000). Annals of <strong>the</strong> Association of American<br />
Geographers 77(1):118-125. (See also U.S. EPA website:<br />
http://www.epa.gov/wed/pages/ecoregions/level_iii.htm#Ecoregions)<br />
Paquet, P., and C. Callahan. 1996. Effects of linear developments on<br />
winter movements of gray wolves in <strong>the</strong> Bow River Valley of Banff<br />
National Park, Alberta. Florida Department of Transportation<br />
Report FL-ER-58-96, pp. 51-73.<br />
Paquet, P. C., J. R. Strittholt and N. L. Staus. 1999. Wolf reintroduction<br />
feasibility in <strong>the</strong> Adirondack Park. Corvalis, OR: Conservation<br />
Biology Institute.<br />
Payer, D. C., and D. J. Harrison. 2003. Influence of forest structure on<br />
habitat use by American marten in an industrial forest. Forest<br />
Ecology and Management 179:145–156.<br />
Possingham, H. P., I. R. Ball, and S. Andelman. 2000. Ma<strong>the</strong>matical<br />
methods for identifying representative reserve networks. In: Ferson,<br />
S. and M. Burgman (eds.). Quantitative methods for conservation<br />
biology. Pages 291-306. New York: Springer-Verlag.<br />
Power, M. E., D. Tilman, J. E. Estes, M. A. Menge, W. J. Bond, L. S.<br />
Mills, G. Daily, J. C. Castilla, J. Lubchenco, and R. T. Paine. 1996.<br />
Challenges in <strong>the</strong> quest for keys<strong>to</strong>nes. BioScience 46: 609-620.<br />
Quinby, P., S. Trombulak, T. Lee, J. Lane, M. Henry, R. Long, and P.<br />
MacKay. 1999. Opportunities for wildlife habitat connectivity<br />
between Algonquin Provincial Park and <strong>the</strong> Adirondack Park.<br />
Powassan, Ontario: Ancient Forest Exploration & Research.<br />
http://www.ancientforest.org/a2a.html )<br />
Quinby, P., S. Trombulak, T. Lee, R. Long, P. MacKay, J. Lane, and M.<br />
Henry. 2000. Opportunities for wildlife habitat connectivity<br />
between Algonquin Provincial Park and <strong>the</strong> Adirondack Park. Wild<br />
Earth 10(2): 75-80.<br />
Ray, J. C. 2005. Is large carnivore conservation equivalent <strong>to</strong> biodiversity<br />
conservation In: Ray, J. C., K. H. Redford, R. S. Steneck, and<br />
J. Berger (eds). Large carnivores and <strong>the</strong> conservation of biodiversity.<br />
Washing<strong>to</strong>n, DC: Island Press.<br />
Ray, J. C., K. H. Redford, R. S. Steneck, and J. Berger (eds). 2005. Large<br />
carnivores and <strong>the</strong> conservation of biodiversity. Washing<strong>to</strong>n, DC:<br />
Island Press.<br />
Ricketts, T. H., E. Dinerstein, D. M. Olson, C. J. Loucks, W. Eichbaum,<br />
D. DellaSala, K. Kavanagh, P. Hedao, P. T. Hurley, K. M. Carney, R.<br />
Abell, S. Walters. 1999. Terrestrial ecoregions of North America: a<br />
conservation assessment. Washing<strong>to</strong>n, DC: Island Press and World<br />
Wildlife Fund.<br />
Rodrigues et al. 2004. Effectiveness of <strong>the</strong> global protected area network<br />
in representing species diversity. Nature 428:640-643.<br />
Rogers, C. M. and M. J. Caro. 1998, Song sparrows, <strong>to</strong>p carnivores and<br />
nest predation: a test of <strong>the</strong> mesopreda<strong>to</strong>r release hypo<strong>the</strong>sis.<br />
Oecologia 116:227-233.<br />
Sala, O. E., F. S. Chapin III, J. J. Armes<strong>to</strong>, E. Berlow, J. Bloomfield, R.<br />
Dirzo, E. Huber-Sanwald, L. F. Huenneke, R. B. Jackson, A. Kinzig,<br />
R. Leemans, D. M. Lodge, H. A. Mooney, M. Oesterheld, N. L. Poff,<br />
M. T. Sykes, B. H. Walker, M. Walker, and D. H. Wall. 2000.<br />
Global biodiversity scenarios for <strong>the</strong> year 2100. Science<br />
287:1770–1774.<br />
Sanderson, E., J. Malanding, M. Levy, K. Redford, A. Wannebo, And G.<br />
Woolmer. 2002. The human footprint and <strong>the</strong> last of <strong>the</strong> wild.<br />
BioScience 52(10):891-904.<br />
Scott, J. M., F. W. Davis, R. G. McGhie, R. G. Wright, C. Groves, J.<br />
Estes. 2001. Nature reserves: do <strong>the</strong>y capture <strong>the</strong> full range of<br />
America’s biological diversity Ecological Applications 11:999-1007.<br />
[ 57 ]
Soulé, M. E. and R. F. Noss. 1998. Rewilding and biodiversity: complementary<br />
goals for continental conservation. Wild Earth 8(3)18-28.<br />
Soulé, M.E., and J. Terborgh. 1999a. Conserving nature at regional and<br />
continental scales—a scientific program for North America.<br />
Bioscience 49(10):809-817.<br />
Soulé, M. E. and J. Terborgh. 1999b. The Policy and Science of Regional<br />
Conservation. In: Soulé, M. E. and J. Terborgh (eds.) Continental<br />
conservation: scientific foundations of regional reserve networks.<br />
Washing<strong>to</strong>n, DC: Island Press.<br />
Soulé, M. E., J. A. Estes, J. Berger, and C. Martinez del Rio. 2003.<br />
Ecological effectiveness: conservation goals for interactive species.<br />
Conservation Biology 17(5):1238-1250.<br />
Soulé, M. E., J. A Estes, B. Miller, and D. L. Honnold. 2005. Strongly<br />
interacting species: conservation policy, management, and ethics.<br />
BioScience 55(2):168-176.<br />
Tear, T. H., P. Kareiva, P. L. Angermeier, P. Comer, B. Czech, R. Kautz,<br />
L. Landon, D. Mehlman, K. Murphy, M. H. Ruckelshaus, J. M.<br />
Scott, G. Wilhere. 2005. How much is enough The recurrent problem<br />
of setting measurable objectives in conservation. Bioscience 55:<br />
835-849.<br />
Terborgh, J., J. Estes, P. Paquet, K. Ralls, D. Boyd-Heger, B. Miller, R.<br />
Noss. 1999. The role of <strong>to</strong>p carnivores in regulating terrestrial<br />
ecosystems. In: Soulé, M. E. and J. Terborgh (eds.) Continental conservation:<br />
scientific foundations of regional reserve networks.<br />
Washing<strong>to</strong>n, DC: Island Press.<br />
Thompson, E. H. 2002. Vermont’s natural heritage: conserving biodiversity<br />
in <strong>the</strong> green mountain state. A report from <strong>the</strong> Vermont biodiversity<br />
project. 48 pp.<br />
Thompson, E., K. Moss, D. Hunt, P. Novak, E. Sorenson, A. Ruesink,<br />
M. Anderson, A. Olivero, C. Ferree, and S. Khanna. 2002. St.<br />
Lawrence—ChamplainValley ecoregion biodiversity conservation<br />
plan. The Nature Conservancy. http://conserveonline.org/docs/<br />
2005/03/STL_report.pdf. Accessed 22 May 2006.<br />
Trombulak, S. C. 2001. Ecological reserve design in <strong>the</strong> Nor<strong>the</strong>ast. In:<br />
Klyza, C. M. (ed.) Wilderness comes home: rewilding <strong>the</strong> Nor<strong>the</strong>ast.<br />
Hanover, NH and London, UK: University Press of New England.<br />
Trombulak, S. C. 2003. An integrative model of landscape-scale conservation<br />
in <strong>the</strong> 21st century. In: Minteer, B.A. and R.E. Manning<br />
(eds.). Reconstructing conservation: his<strong>to</strong>ry, values and practice.<br />
Washing<strong>to</strong>n, DC: Island Press.<br />
Waller, D. M. and W. S. Alverson. 1997. The white-tailed deer: a keys<strong>to</strong>ne<br />
herbivore. Wildlife Society Bulletin 25:217-226.<br />
Weaver, J. L., P. C. Paquet, and L. F.Ruggiero. 1996. Resilience and<br />
conservation of large carnivores in <strong>the</strong> Rocky Mountains.<br />
Conservation Biology 10:964-976.<br />
Woolmer, G., S. C. Trombulak, P. Doran, J. Ray, M. Anderson, A.<br />
Morgan, and E. Sanderson. In Preparation. Ecological bias in <strong>the</strong><br />
transformation of landscapes in <strong>the</strong> nor<strong>the</strong>rn Appalachian ecoregion<br />
as measured by <strong>the</strong> human footprint.<br />
[ 58 ]