P11D WS2 (2012) Car and Car fuel benefit 2011-12
P11D WS2 (2012) Car and Car fuel benefit 2011-12
P11D WS2 (2012) Car and Car fuel benefit 2011-12

You also want an ePaper? Increase the reach of your titles
YUMPU automatically turns print PDFs into web optimized ePapers that Google loves.
5<br />
5a<br />
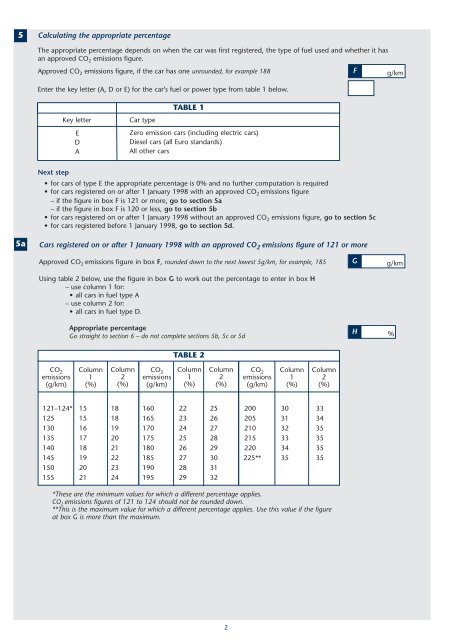
Calculating the appropriate percentage<br />
The appropriate percentage depends on when the car was first registered, the type of <strong>fuel</strong> used <strong>and</strong> whether it has<br />
an approved CO2 emissions figure.<br />
Approved CO2 emissions figure, if the car has one unrounded, for example 188<br />
F g/km<br />
Enter the key letter (A, D or E) for the car’s <strong>fuel</strong> or power type from table 1 below.<br />
Key letter <strong>Car</strong> type<br />
E<br />
D<br />
A<br />
TABLE 1<br />
Zero emission cars (including electric cars)<br />
Diesel cars (all Euro st<strong>and</strong>ards)<br />
All other cars<br />
Next step<br />
for cars of type E the appropriate percentage is 0% <strong>and</strong> no further computation is required<br />
for cars registered on or after 1 January 1998 with an approved CO2 emissions figure<br />
– if the figure in box F is <strong>12</strong>1 or more, go to section 5a<br />
– if the figure in box F is <strong>12</strong>0 or less, go to section 5b<br />
for cars registered on or after 1 January 1998 without an approved CO2 emissions figure, go to section 5c<br />
for cars registered before 1 January 1998, go to section 5d.<br />
<strong>Car</strong>s registered on or after 1 January 1998 with an approved CO 2 emissions figure of <strong>12</strong>1 or more<br />
Approved CO 2 emissions figure in box F, rounded down to the next lowest 5g/km, for example, 185<br />
Using table 2 below, use the figure in box G to work out the percentage to enter in box H<br />
– use column 1 for:<br />
all cars in <strong>fuel</strong> type A<br />
– use column 2 for:<br />
all cars in <strong>fuel</strong> type D.<br />
CO 2<br />
emissions<br />
(g/km)<br />
Appropriate percentage<br />
Go straight to section 6 – do not complete sections 5b, 5c or 5d<br />
Column<br />
1<br />
(%)<br />
Column<br />
2<br />
(%)<br />
CO 2<br />
emissions<br />
(g/km)<br />
TABLE 2<br />
Column<br />
1<br />
(%)<br />
Column<br />
2<br />
(%)<br />
CO 2<br />
emissions<br />
(g/km)<br />
Column<br />
1<br />
(%)<br />
<strong>12</strong>1–<strong>12</strong>4* 15 18 160 22 25 200 30 33<br />
<strong>12</strong>5 15 18 165 23 26 205 31 34<br />
130 16 19 170 24 27 210 32 35<br />
135 17 20 175 25 28 215 33 35<br />
140 18 21 180 26 29 220 34 35<br />
145 19 22 185 27 30 225** 35 35<br />
150 20 23 190 28 31<br />
155 21 24 195 29 32<br />
Column<br />
2<br />
(%)<br />
*These are the minimum values for which a different percentage applies.<br />
CO 2 emissions figures of <strong>12</strong>1 to <strong>12</strong>4 should not be rounded down.<br />
**This is the maximum value for which a different percentage applies. Use this value if the figure<br />
at box G is more than the maximum.<br />
2<br />
G<br />
H<br />
g/km<br />
%