Using the Web-based Graphing Calculator - MathChamber
Using the Web-based Graphing Calculator - MathChamber
Using the Web-based Graphing Calculator - MathChamber

Create successful ePaper yourself
Turn your PDF publications into a flip-book with our unique Google optimized e-Paper software.
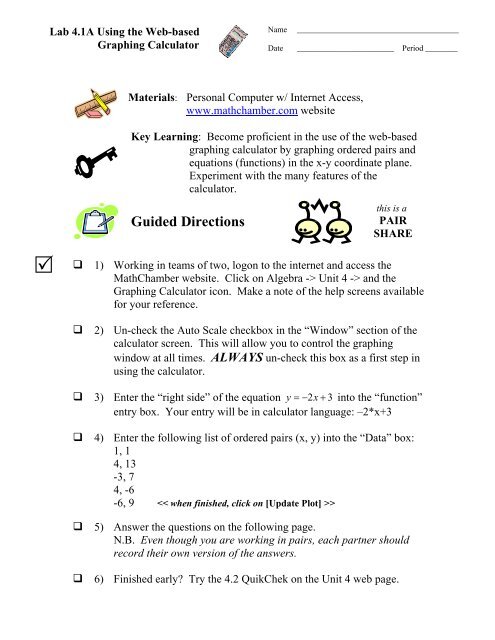
Lab 4.1A <strong>Using</strong> <strong>the</strong> <strong>Web</strong>-<strong>based</strong><br />
<strong>Graphing</strong> <strong>Calculator</strong><br />
Name<br />
Date<br />
________________________________________<br />
________________________ Period ________<br />
Materials: Personal Computer w/ Internet Access,<br />
www.mathchamber.com website<br />
Key Learning: Become proficient in <strong>the</strong> use of <strong>the</strong> web-<strong>based</strong><br />
graphing calculator by graphing ordered pairs and<br />
equations (functions) in <strong>the</strong> x-y coordinate plane.<br />
Experiment with <strong>the</strong> many features of <strong>the</strong><br />
calculator.<br />
Guided Directions<br />
this is a<br />
PAIR<br />
SHARE<br />
<br />
<br />
1) Working in teams of two, logon to <strong>the</strong> internet and access <strong>the</strong><br />
<strong>MathChamber</strong> website. Click on Algebra -> Unit 4 -> and <strong>the</strong><br />
<strong>Graphing</strong> <strong>Calculator</strong> icon. Make a note of <strong>the</strong> help screens available<br />
for your reference.<br />
2) Un-check <strong>the</strong> Auto Scale checkbox in <strong>the</strong> “Window” section of <strong>the</strong><br />
calculator screen. This will allow you to control <strong>the</strong> graphing<br />
window at all times. ALWAYS un-check this box as a first step in<br />
using <strong>the</strong> calculator.<br />
3) Enter <strong>the</strong> “right side” of <strong>the</strong> equation y = − 2x+ 3 into <strong>the</strong> “function”<br />
entry box. Your entry will be in calculator language: –2*x+3<br />
<br />
<br />
<br />
4) Enter <strong>the</strong> following list of ordered pairs (x, y) into <strong>the</strong> “Data” box:<br />
1, 1<br />
4, 13<br />
-3, 7<br />
4, -6<br />
-6, 9 ><br />
5) Answer <strong>the</strong> questions on <strong>the</strong> following page.<br />
N.B. Even though you are working in pairs, each partner should<br />
record <strong>the</strong>ir own version of <strong>the</strong> answers.<br />
6) Finished early Try <strong>the</strong> 4.2 QuikChek on <strong>the</strong> Unit 4 web page.
Lab 4.1A <strong>Using</strong> <strong>the</strong> <strong>Web</strong>-<strong>based</strong> <strong>Graphing</strong> <strong>Calculator</strong><br />
Questions:<br />
You may answer <strong>the</strong> questions on this sheet.<br />
Show<br />
Function/<br />
Data<br />
Plot<br />
Type<br />
Ordered Pair<br />
Data Entry<br />
<strong>Graphing</strong><br />
Window<br />
Function/<br />
Equation<br />
Entry<br />
Mouse<br />
Position<br />
Data<br />
Window<br />
Describe what happens when you…<br />
1. Un-check and re-check <strong>the</strong> Function and Data boxes in <strong>the</strong> “Show”<br />
section.<br />
2. Click <strong>the</strong> [Connected] and [Scatter] buttons on and off.
3. Update <strong>the</strong> Graph Title with any text of your choice.<br />
4. Un-check <strong>the</strong> Auto Scale box and change <strong>the</strong> “<strong>Graphing</strong> Window”<br />
“min/max” ± 20 instead of ± 10 , and <strong>the</strong> “scale” to 5 instead of 2.<br />
5. Click on [Show Tabular Data]… play with <strong>the</strong> parameters (press “set”).<br />
6. Enter a 2 nd and 3 rd equation (use a comma as a separator).<br />
5<br />
2<br />
To graph y = x enter: (5/2)*x and to graph y = − x enter –x^2.<br />
2<br />
When done, press <strong>the</strong> [UPDATE PLOT] button.<br />
7. Position your mouse pointer on anywhere on <strong>the</strong> coordinate plane.<br />
What is revealed in <strong>the</strong> “Mouse Position” box