Wet STEM: A newdevelopment in environmental SEM for imaging ...
Wet STEM: A newdevelopment in environmental SEM for imaging ...
Wet STEM: A newdevelopment in environmental SEM for imaging ...

Create successful ePaper yourself
Turn your PDF publications into a flip-book with our unique Google optimized e-Paper software.
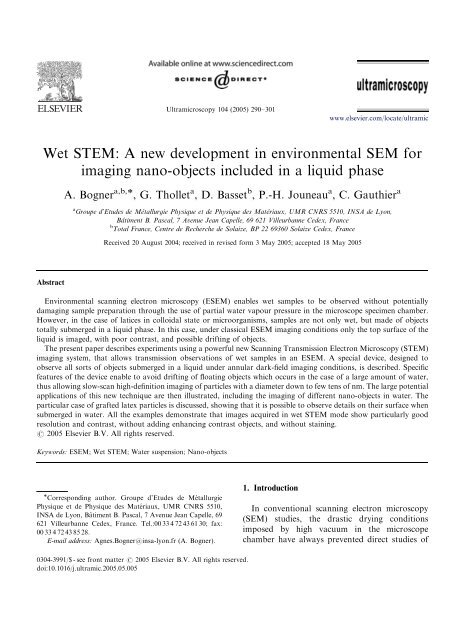
Ultramicroscopy 104 (2005) 290–301<br />
<strong>Wet</strong> <strong>STEM</strong>: A <strong>newdevelopment</strong> <strong>in</strong> <strong>environmental</strong> <strong>SEM</strong> <strong>for</strong><br />
imag<strong>in</strong>g nano-objects <strong>in</strong>cluded <strong>in</strong> a liquid phase<br />
Abstract<br />
A. Bogner a,b, , G. Thollet a , D. Basset b , P.-H. Jouneau a , C. Gauthier a<br />
a Groupe d’Etudes de Métallurgie Physique et de Physique des Matériaux, UMR CNRS 5510, INSA de Lyon,<br />
Bâtiment B. Pascal, 7 Avenue Jean Capelle, 69 621 Villeurbanne Cedex, France<br />
b Total France, Centre de Recherche de Solaize, BP 22 69360 Solaize Cedex, France<br />
Received 20 August 2004; received <strong>in</strong> revised <strong>for</strong>m 3 May 2005; accepted 18 May 2005<br />
Environmental scann<strong>in</strong>g electron microscopy (E<strong>SEM</strong>) enables wet samples to be observed without potentially<br />
damag<strong>in</strong>g sample preparation through the use of partial water vapour pressure <strong>in</strong> the microscope specimen chamber.<br />
However, <strong>in</strong> the case of latices <strong>in</strong> colloidal state or microorganisms, samples are not only wet, but made of objects<br />
totally submerged <strong>in</strong> a liquid phase. In this case, under classical E<strong>SEM</strong> imag<strong>in</strong>g conditions only the top surface of the<br />
liquid is imaged, with poor contrast, and possible drift<strong>in</strong>g of objects.<br />
The present paper describes experiments us<strong>in</strong>g a powerful new Scann<strong>in</strong>g Transmission Electron Microscopy (<strong>STEM</strong>)<br />
imag<strong>in</strong>g system, that allows transmission observations of wet samples <strong>in</strong> an E<strong>SEM</strong>. A special device, designed to<br />
observe all sorts of objects submerged <strong>in</strong> a liquid under annular dark-field imag<strong>in</strong>g conditions, is described. Specific<br />
features of the device enable to avoid drift<strong>in</strong>g of float<strong>in</strong>g objects which occurs <strong>in</strong> the case of a large amount of water,<br />
thus allow<strong>in</strong>g slow-scan high-def<strong>in</strong>ition imag<strong>in</strong>g of particles with a diameter down to few tens of nm. The large potential<br />
applications of this newtechnique are then illustrated, <strong>in</strong>clud<strong>in</strong>g the imag<strong>in</strong>g of different nano-objects <strong>in</strong> water. The<br />
particular case of grafted latex particles is discussed, show<strong>in</strong>g that it is possible to observe details on their surface when<br />
submerged <strong>in</strong> water. All the examples demonstrate that images acquired <strong>in</strong> wet <strong>STEM</strong> mode show particularly good<br />
resolution and contrast, without add<strong>in</strong>g enhanc<strong>in</strong>g contrast objects, and without sta<strong>in</strong><strong>in</strong>g.<br />
r 2005 Elsevier B.V. All rights reserved.<br />
Keywords: E<strong>SEM</strong>; <strong>Wet</strong> <strong>STEM</strong>; Water suspension; Nano-objects<br />
Correspond<strong>in</strong>g author. Groupe d’Etudes de Me´ tallurgie<br />
Physique et de Physique des Matériaux, UMR CNRS 5510,<br />
INSA de Lyon, Baˆ timent B. Pascal, 7 Avenue Jean Capelle, 69<br />
621 Villeurbanne Cedex, France. Tel.:00 33 4 72 43 61 30; fax:<br />
00 33 4 72 43 85 28.<br />
E-mail address: Agnes.Bogner@<strong>in</strong>sa-lyon.fr (A. Bogner).<br />
ARTICLE IN PRESS<br />
0304-3991/$ - see front matter r 2005 Elsevier B.V. All rights reserved.<br />
doi:10.1016/j.ultramic.2005.05.005<br />
1. Introduction<br />
www.elsevier.com/locate/ultramic<br />
In conventional scann<strong>in</strong>g electron microscopy<br />
(<strong>SEM</strong>) studies, the drastic dry<strong>in</strong>g conditions<br />
imposed by high vacuum <strong>in</strong> the microscope<br />
chamber have always prevented direct studies of
wet samples and dynamic imag<strong>in</strong>g <strong>in</strong> a chang<strong>in</strong>g<br />
sample environment, as it is reported <strong>in</strong> Ref. [1].<br />
For this reason, traditional microstructural characterization<br />
of delicate samples usually requires a<br />
prelim<strong>in</strong>ary preparation step, <strong>in</strong>clud<strong>in</strong>g fix<strong>in</strong>g and<br />
sta<strong>in</strong><strong>in</strong>g. E<strong>SEM</strong> differs from a conventional <strong>SEM</strong><br />
s<strong>in</strong>ce the sample is not viewed under high vacuum.<br />
The column is divided <strong>in</strong>to differential pressure<br />
zones that allows the electron gun to rema<strong>in</strong> under<br />
high vacuum while the sample chamber conta<strong>in</strong>s a<br />
fewtorr of gas. Collisions between electrons and<br />
gas molecules produce positive ions that prevent<br />
the build-up of charges on <strong>in</strong>sulat<strong>in</strong>g samples. This<br />
consequently elim<strong>in</strong>ates the need <strong>for</strong> a conductive<br />
surface coat<strong>in</strong>g on <strong>in</strong>sulators surfaces. Moreover,<br />
daughter electrons are produced thanks to a<br />
‘cascade effect’ that amplifies the signal detected<br />
by the positively biased <strong>environmental</strong> detector.<br />
Eventually, when the microscope is equipped with<br />
a Peltier stage, the adjustable chamber pressure<br />
and temperature ranges enable the observation of<br />
wet samples <strong>in</strong> their natural state. For all these<br />
reasons, E<strong>SEM</strong> appears to be an ideal technique to<br />
study all k<strong>in</strong>ds of wet nano-objects.<br />
The observation of wet organic samples with<br />
E<strong>SEM</strong> has already been reported <strong>in</strong> the literature<br />
[1–3]. In all cases, special attention is recommended<br />
<strong>in</strong> order to m<strong>in</strong>imize evaporation dur<strong>in</strong>g<br />
the pump down sequence [4]. Then, the ma<strong>in</strong><br />
difficulty that restricts observation dur<strong>in</strong>g imag<strong>in</strong>g<br />
is the fast sample damage under the <strong>in</strong>cident<br />
electron beam. In the case of polymers, the<br />
degradation may be accelerated <strong>in</strong> the presence<br />
of water because of the high mobility of radicals<br />
through the water layer, which <strong>in</strong>creases the rate of<br />
hydrolysis [2]. This prevents the successive imag<strong>in</strong>g<br />
of the same area, and also limits the imag<strong>in</strong>g<br />
magnification—higher magnification means higher<br />
irradiation dose and there<strong>for</strong>e more damage.<br />
F<strong>in</strong>ally, one should keep <strong>in</strong> m<strong>in</strong>d that only the<br />
top layer of the sample surface is revealed, which<br />
means that classical use of E<strong>SEM</strong> does not allow<br />
the observation of samples deep <strong>in</strong>side the liquid<br />
layer.<br />
This paper presents, a new‘‘wet <strong>STEM</strong>’’ device<br />
developed <strong>for</strong> the transmission imag<strong>in</strong>g of suspensions—i.e.<br />
objects from a fewnm to several mm<br />
stabilized <strong>in</strong> a liquid phase, latices (<strong>in</strong> polymer<br />
ARTICLE IN PRESS<br />
A. Bogner et al. / Ultramicroscopy 104 (2005) 290–301 291<br />
science term<strong>in</strong>ology, latex means a colloidal<br />
suspension of polymer particles <strong>in</strong> an aqueous<br />
solution) or emulsions (droplets of liquid dispersed<br />
<strong>in</strong> another liquid phase). Thanks to its development<br />
<strong>in</strong> an E<strong>SEM</strong>, it is a straight-<strong>for</strong>ward analysis<br />
technique. Its application is illustrated through<br />
several cases: organic and <strong>in</strong>organic objects,<br />
monomer and polymer emulsions. For sake of<br />
clarity <strong>in</strong> the experimental description, the term<br />
‘‘suspension’’ is used <strong>for</strong> all the samples imaged.<br />
2. Experimental device<br />
The observations have been per<strong>for</strong>med with a<br />
FEI XL 30 FEG E<strong>SEM</strong>. The specific device<br />
developed <strong>for</strong> imag<strong>in</strong>g wet samples <strong>in</strong> transmission<br />
mode, and hereafter called ‘‘wet <strong>STEM</strong>’’, is<br />
described <strong>in</strong> Fig. 1.<br />
2.1. Experimental setup<br />
A TEM copper grid is placed on the head of a<br />
TEM sample holder, which is fixed on a round<br />
Fig. 1. Schematic of the wet <strong>STEM</strong> device <strong>for</strong> annular darkfield<br />
imag<strong>in</strong>g. (a) Peltier stage, (b) <strong>SEM</strong> mount support<strong>in</strong>g the<br />
latex droplet on a TEM grid, (c) solid-state detector, usually<br />
used <strong>for</strong> the collection of BSE, removed from its position and<br />
located belowthe specimen and (i) Convergent <strong>in</strong>cident beam.<br />
Remark: the direct transmitted beam is not collected.
292<br />
cyl<strong>in</strong>drical <strong>SEM</strong> mount, and positioned on the<br />
Peltier stage. A droplet of liquid conta<strong>in</strong><strong>in</strong>g<br />
particles or float<strong>in</strong>g objects (organic, <strong>in</strong>organic,<br />
liquid or solid) is droped on the grid with an<br />
eppendorf s micropipette. In these conditions, the<br />
<strong>in</strong>cident electron beam passes through the droplet,<br />
i.e. the liquid layer and a given amount of float<strong>in</strong>g<br />
particles. The signal is then collected by a detector,<br />
usually used <strong>for</strong> the collection of backscattered<br />
electrons (BSE), but <strong>in</strong> our case located belowthe<br />
sample. We used holey carbon coated TEM<br />
copper grids, with the carbon layer down <strong>in</strong> order<br />
to use copper squares as retention bas<strong>in</strong>s. In the<br />
carbon layer, holes of typical diameter rang<strong>in</strong>g<br />
from less than 1 to 20 mm allowma<strong>in</strong>ta<strong>in</strong><strong>in</strong>g<br />
overhang<strong>in</strong>g liquid films on very small areas. It is<br />
important to note that adequate <strong>in</strong>itial droplet<br />
parameters—i.e. volume and solid content—enable<br />
to control the amount of particles on the grid.<br />
It is possible, <strong>for</strong> <strong>in</strong>stance <strong>in</strong> the case of a latex<br />
emulsion sample, to choose to image only a<br />
monolayer of particles if required.<br />
Due to the <strong>in</strong>itial concentration of the suspension,<br />
when the droplet of smallest volume that can<br />
be droped conta<strong>in</strong>s more objects than <strong>for</strong> a<br />
monolayer on the grid, a dilution step with<br />
distilled water can be per<strong>for</strong>med.<br />
Classical E<strong>SEM</strong> detectors also available enable<br />
the control of the sample surface <strong>in</strong> SE mode and<br />
<strong>in</strong> BSE mode, us<strong>in</strong>g the gaseous SE detector<br />
GSED, and the gaseous backscattered electron<br />
detector GAD, respectively. This is very helpful<br />
<strong>for</strong> example to control the presence of liquid until<br />
the thickness is adequate to per<strong>for</strong>m transmission<br />
observations and to detect if objects are not<br />
submerged <strong>in</strong> water anymore.<br />
2.2. Purge sequence<br />
In relation with the work described <strong>in</strong> Ref. [4],<br />
an optimized pump down sequence is used <strong>in</strong> order<br />
to prevent evaporation from, and condensation on<br />
the sample droplet. Parameters like water source<br />
bottle temperature, sample temperature, <strong>in</strong>itial<br />
relative humidity rate <strong>in</strong> the microscope chamber,<br />
number of pump<strong>in</strong>g and flood<strong>in</strong>g cycles, upper<br />
and lower pressures <strong>for</strong> the purge are carefully<br />
controlled dur<strong>in</strong>g the sequence.<br />
ARTICLE IN PRESS<br />
A. Bogner et al. / Ultramicroscopy 104 (2005) 290–301<br />
2.3. Imag<strong>in</strong>g sequence<br />
The pressure and temperature can be adjusted to<br />
evaporate a small amount of water from the<br />
droplet. It allows to keep a water layer th<strong>in</strong> enough<br />
so that electrons both transmitted and scattered<br />
pass through it, and can be collected to participate<br />
to the <strong>for</strong>mation of a <strong>STEM</strong> image. Th<strong>in</strong> films of<br />
wet samples are created <strong>in</strong> situ <strong>in</strong> the E<strong>SEM</strong><br />
chamber, their thickness depend<strong>in</strong>g on the quantity<br />
of water evaporated from the <strong>in</strong>itial droplet.<br />
The solid content of the sample is controlled so<br />
that the <strong>in</strong>itial solid content and the <strong>in</strong>itial droplet<br />
volume are known. As evaporation is an endothermic<br />
reaction, it is then possible to followit<br />
by check<strong>in</strong>g the difference between the sett<strong>in</strong>g<br />
temperature and the measured one. Then the<br />
thickness of the film is kept constant thanks to<br />
an equilibrium water pressure us<strong>in</strong>g the (P,T)<br />
water diagram [5]. For <strong>in</strong>stance, a water pressure<br />
of 5.3 torr is required at a sample temperature of<br />
2 1C, so that objects rema<strong>in</strong> <strong>in</strong> a constant water<br />
layer. By controll<strong>in</strong>g the sample temperature<br />
through the Peltier stage, and us<strong>in</strong>g water vapour<br />
as the imag<strong>in</strong>g gas at a controlled pressure,<br />
samples can be kept above their saturated vapour<br />
pressure dur<strong>in</strong>g all the experiment.<br />
2.4. Imag<strong>in</strong>g mode<br />
In <strong>SEM</strong>, the detection strategy <strong>in</strong> <strong>STEM</strong> mode<br />
is based on the direct collection of electrons<br />
pass<strong>in</strong>g through the sample, by a solid-state<br />
detector (two semi-annular detectors A and B).<br />
For the configuration usually used, the <strong>in</strong>cident<br />
electron beam arrives on the limit of diodes A and<br />
B, and bright- or dark-field images can be<br />
produced with the collection of transmitted or<br />
scattered electrons, respectively. In this case, only<br />
a small area of the sample is above the limit of A<br />
and B. In the present study, we choose another<br />
possibility: annular dark-field imag<strong>in</strong>g conditions<br />
can be obta<strong>in</strong>ed if the dipolar detector is placed so<br />
that it occults the transmitted electron beam and it<br />
only collects scattered beams on a r<strong>in</strong>g constituted<br />
by both diodes A and B. Us<strong>in</strong>g this method, a<br />
more important part of the scattered electrons<br />
available is used to <strong>for</strong>m an image and more
contrasted images can be obta<strong>in</strong>ed. Consequently,<br />
all the E<strong>SEM</strong> micrographs presented <strong>in</strong> the<br />
follow<strong>in</strong>g have been obta<strong>in</strong>ed <strong>in</strong> annular darkfield<br />
conditions. The second advantage of this<br />
disposition, us<strong>in</strong>g the sum signal, is that imag<strong>in</strong>g<br />
conditions are not l<strong>in</strong>ked to the area of the sample<br />
imaged.<br />
Moreover, <strong>in</strong> our experimental setup, the<br />
distance between the sample and the detector has<br />
been <strong>in</strong>vestigated <strong>in</strong> order to optimize the contrast.<br />
Best results are obta<strong>in</strong>ed with a distance of about<br />
7 mm, correspond<strong>in</strong>g to collection angles between<br />
201 and 451 <strong>in</strong> dark field. However, this optimum<br />
is empirical. Its theoretical explanation is complex<br />
due to the different diffusion mechanisms <strong>in</strong>volved<br />
<strong>in</strong> images <strong>for</strong>mation, and is not <strong>in</strong> the frame of<br />
this study.<br />
3. Applications of the wet <strong>STEM</strong> mode <strong>for</strong> imag<strong>in</strong>g<br />
nano-objects <strong>in</strong> water<br />
3.1. Applications to a large pallet of samples<br />
In order to highlight the wide variety of imag<strong>in</strong>g<br />
possibilities <strong>in</strong> wet <strong>STEM</strong>, different samples have<br />
been observed <strong>in</strong> this mode.<br />
For an evaluation of the resolution reached <strong>in</strong><br />
wet <strong>STEM</strong> mode, gold nano-particles <strong>in</strong> colloidal<br />
solution have been observed <strong>in</strong> wet <strong>STEM</strong>. The<br />
synthesis process of these suspensions is described<br />
<strong>in</strong> Ref. [6]. Fig. 2 presents a comparison between<br />
SE mode, backscattered electron mode and wet<br />
<strong>STEM</strong> images. SE imag<strong>in</strong>g <strong>in</strong> wet mode (Fig. 2a)<br />
does not allowto observe any details except the<br />
surface of the water layer. Fig. 2b has been<br />
acquired us<strong>in</strong>g BSE: a very good contrast is<br />
obta<strong>in</strong>ed, thanks to the high atomic number<br />
difference between the Au particles and the liquid<br />
water, allow<strong>in</strong>g Au particles network to be<br />
imaged. In wet <strong>STEM</strong> mode (Fig. 2c), even with<br />
a large thickness of water, Au particles are also<br />
detected. When the water layer thickness decreases<br />
(Fig. 3), the wet <strong>STEM</strong> image is better than the<br />
BSE image, and gives access to <strong>in</strong>dividual visualization<br />
of each particle. The mean particle size is<br />
around 20 nm, and the resolution reaches 5 nm, an<br />
ARTICLE IN PRESS<br />
A. Bogner et al. / Ultramicroscopy 104 (2005) 290–301 293<br />
Fig. 2. Colloidal solution of gold nano-particles, imaged at<br />
30 kV <strong>in</strong> wet mode with different electron detectors: (a) large<br />
field gaseous SE detector (GSED), (b) gaseous backscattered<br />
electron detector (GAD) and (c) annular dark-field <strong>STEM</strong><br />
detector. Scale bar length: 25 mm.
294<br />
Fig. 3. Colloidal solution of gold nano-particles imaged at<br />
30 kV <strong>in</strong> wet mode with the annular dark-field <strong>STEM</strong> detector.<br />
Average particles size: 20 nm. Scale bar length: 200 nm.<br />
excellent result partly thanks to the field emission<br />
source.<br />
Particles with similar sizes but with a less<br />
favourable atomic number difference with water<br />
have then been chosen to evaluate wet <strong>STEM</strong><br />
per<strong>for</strong>mances. A colloidal suspension of silica<br />
particles, supplied by Buehler under the commercial<br />
name Mastermet s 2, has been observed.<br />
Referr<strong>in</strong>g to the commercial catalogue, monodisperse<br />
particles with a size around 20 nm were<br />
expected. Fig. 4 shows two images at different<br />
magnifications, *15,000 and *120,000, respectively.<br />
On the first image, the large several mmwide<br />
circle is a hole <strong>in</strong> the carbon layer of the TEM<br />
grid. <strong>Wet</strong> <strong>STEM</strong> images showa wide dispersion <strong>in</strong><br />
particle sizes, rang<strong>in</strong>g from 20 to 100 nm. Above<br />
the carbon grid hole, a water meniscus has been<br />
<strong>for</strong>med, so that biggest particles have been rejected<br />
on edges, where the water layer is thicker. On<br />
every po<strong>in</strong>t of the hole area, as the water layer is<br />
just slightly thicker than the particles and the Z<br />
number of particles is greater than that of water,<br />
one can observe a classical dark field contrast, i.e.<br />
larger particles appear brighter.<br />
From these examples, one can see that metallic<br />
and <strong>in</strong>organic nano-objects <strong>in</strong> water observed <strong>in</strong><br />
wet <strong>STEM</strong> exhibit <strong>in</strong>terest<strong>in</strong>g resolution and<br />
contrast. The follow<strong>in</strong>g example concerns organic<br />
nano-objects: multi-walls carbon nanotubes, dispersed<br />
<strong>in</strong> water [7]. <strong>Wet</strong> <strong>STEM</strong> image on Fig. 5 is<br />
ARTICLE IN PRESS<br />
A. Bogner et al. / Ultramicroscopy 104 (2005) 290–301<br />
Fig. 4. Colloidal solution of silica particles (polish<strong>in</strong>g product<br />
Mastermet 2 supplied by Buehler) imaged at 30 kV <strong>in</strong> wet mode<br />
<strong>in</strong> annular dark-field conditions. Particles size ranges from 20 to<br />
100 nm.<br />
Fig. 5. Carbon nanotubes <strong>in</strong> water imaged at 30 kV <strong>in</strong> wet<br />
mode <strong>in</strong> annular dark-field conditions.
well contrasted and helps <strong>for</strong> the understand<strong>in</strong>g of<br />
nanotube con<strong>for</strong>mations i.e. the positions they<br />
adopt <strong>in</strong> volume. It is specially <strong>in</strong>terest<strong>in</strong>g because<br />
this <strong>in</strong><strong>for</strong>mation should not be very different from<br />
the con<strong>for</strong>mation of nanotubes mixed <strong>in</strong> a latex<br />
suspension, which is used to synthesize polymer<br />
films with fillers <strong>in</strong>duc<strong>in</strong>g specific electrical properties.<br />
In the present wet <strong>STEM</strong> imag<strong>in</strong>g mode, signal<br />
detection conditions have been optimized, <strong>in</strong> order<br />
to obta<strong>in</strong> strong contrasts thanks to annular darkfield<br />
conditions. This is specially <strong>in</strong>terest<strong>in</strong>g <strong>for</strong><br />
polymer and biological samples, known to give<br />
lowcontrasts because of their lowatomic numbers.<br />
<strong>Wet</strong> <strong>STEM</strong> observations are per<strong>for</strong>med <strong>in</strong> a<br />
water layer that is to say <strong>in</strong> the actual environment<br />
of the samples, and <strong>in</strong> all cases, the <strong>in</strong>dividual<br />
particles are well resolved. But another experiment<br />
allowed with the present <strong>STEM</strong> device is the<br />
use of E<strong>SEM</strong> ability <strong>for</strong> dynamic imag<strong>in</strong>g. A<br />
synthetic latex has been observed dur<strong>in</strong>g <strong>in</strong> situ<br />
water evaporation. The <strong>STEM</strong> image presented on<br />
Fig. 6 shows a pile-up of particle layers, that<br />
means that multi-layers are detected <strong>in</strong> this mode.<br />
We turn nowto observe more delicate samples<br />
i.e. a liquid–liquid suspension, constituted with an<br />
aqueous phase <strong>in</strong>clud<strong>in</strong>g organic liquid spheres<br />
Fig. 6. De<strong>for</strong>med particles of homogeneous acrylic latex dur<strong>in</strong>g<br />
evaporation by heat<strong>in</strong>g: on the right, a monolayer, and on the<br />
left, a pile-up of particles layers. The large circle is a hole <strong>in</strong> the<br />
carbon layer of the TEM grid. Scale bar length: 500 nm.<br />
ARTICLE IN PRESS<br />
A. Bogner et al. / Ultramicroscopy 104 (2005) 290–301 295<br />
stabilized by a surfactant. These samples are made<br />
from m<strong>in</strong>i-emulsion polymerization technique,<br />
which can be employed to synthesize high solid<br />
content latices. Dur<strong>in</strong>g polymerization, float<strong>in</strong>g<br />
objects <strong>in</strong>cluded <strong>in</strong>to water are evolv<strong>in</strong>g from<br />
monomer droplets to solid polymer particles.<br />
Us<strong>in</strong>g the present wet <strong>STEM</strong> imag<strong>in</strong>g system,<br />
two m<strong>in</strong>i-emulsions have been characterized,<br />
correspond<strong>in</strong>g to two different stages of the<br />
polymerization process. Fig. 7 presents wet <strong>STEM</strong>:<br />
a m<strong>in</strong>i-emulsion of styrene <strong>in</strong> water (Fig. 7a), and<br />
an hybrid m<strong>in</strong>i-emulsion of polystyrene–styrene <strong>in</strong><br />
water (Fig. 7b). With the help of classical image<br />
analysis (SIS software), we found that monomer<br />
droplets sizes range from 150 to 400 nm and are<br />
homogeneously distributed. On the same figure, it<br />
Fig. 7. <strong>Wet</strong> <strong>STEM</strong> images at 30 kV <strong>in</strong> annular dark-field<br />
conditions of aqueous m<strong>in</strong>i-emulsions of (a) styrene <strong>in</strong> water,<br />
(b) polystyrene–styrene <strong>in</strong> water. Larger circles of several mm<br />
diameter are holes <strong>in</strong> the carbon layer of the TEM grid. Scale<br />
bar length: 1 mm.
296<br />
is aga<strong>in</strong> possible to dist<strong>in</strong>guish two large circular<br />
l<strong>in</strong>es with radius higher than several mm, correspond<strong>in</strong>g<br />
to hole edges <strong>in</strong> the carbon layer of the<br />
TEM grid. For hybrid styrene–polystyrene m<strong>in</strong>iemulsion,<br />
droplets have sizes rang<strong>in</strong>g from 90 to<br />
900 nm and droplet size distribution (DSD) is very<br />
large, the ma<strong>in</strong> part be<strong>in</strong>g between 200 and<br />
300 nm. The accuracy of these values have been<br />
confirmed after microscope calibration <strong>for</strong> the<br />
magnifications used. As a remark about image <strong>in</strong><br />
Fig. 7b, a brighter area can be observed on the left<br />
corner of the micrograph. This is the result of the<br />
prelim<strong>in</strong>ary imag<strong>in</strong>g of this area at higher magnification,<br />
where electron beam is assumed to<br />
produce charg<strong>in</strong>g effects. The huge <strong>in</strong>terest of this<br />
technique <strong>in</strong> the specific field of m<strong>in</strong>i-emulsion is<br />
commented <strong>in</strong> Ref. [8]. If the sample dilution and<br />
the imag<strong>in</strong>g magnification are adequate, it allows<br />
to determ<strong>in</strong>e both average droplet size and DSD,<br />
which directly <strong>in</strong>fluence the m<strong>in</strong>i-emulsion stability<br />
and the nucleation mechanism.<br />
These examples showthat the wet <strong>STEM</strong><br />
method is particularly adapted to image nanoobjects<br />
(metallic, <strong>in</strong>organic, organic, liquid) <strong>in</strong> a<br />
water layer. It gives access to size and size<br />
distribution, and can also be used to determ<strong>in</strong>e<br />
the stability of objects <strong>in</strong> the liquid phase.<br />
3.2. Application <strong>for</strong> the imag<strong>in</strong>g of grafted colloidal<br />
aqueous latices<br />
<strong>Wet</strong> <strong>STEM</strong> is also a very powerful analysis<br />
method to detect details on the surface of nanoobjects<br />
<strong>in</strong>cluded <strong>in</strong> a liquid phase. An example is<br />
presented <strong>in</strong> this section, where natural rubber<br />
latex particles are imaged be<strong>for</strong>e and after graft<strong>in</strong>g<br />
on their surface.<br />
In its native state, natural rubber is a polydisperse<br />
latex and <strong>in</strong> the present latex Hevea<br />
Brasiliensis, particles sizes range from 40 nm to<br />
3 mm. Natural rubber shows excellent properties<br />
such as high resilience, strength, and fatigue<br />
resistance, but most of its <strong>in</strong>dustrial applications<br />
require the addition of re<strong>in</strong><strong>for</strong>c<strong>in</strong>g fillers like<br />
carbon black or silica, <strong>in</strong> order to <strong>in</strong>crease the<br />
modulus and the wear resistance. In the case of<br />
silica fillers, a good dispersion of the particles can<br />
be obta<strong>in</strong>ed us<strong>in</strong>g two methods: (1) by fillers<br />
ARTICLE IN PRESS<br />
A. Bogner et al. / Ultramicroscopy 104 (2005) 290–301<br />
surface modification, or (2) by chemical modification<br />
of the natural rubber itself. Different<br />
morphologies of the chemically modified particles<br />
are thus obta<strong>in</strong>ed: core-shell type, <strong>in</strong>verted nucleus,<br />
raspberry-like, fruit cake and hairy-layer. In<br />
order to improve its aff<strong>in</strong>ity with silica, use is made<br />
of hydrophilic polymer cha<strong>in</strong>s, and the process is<br />
optimized so that the hydrophilic cha<strong>in</strong>s are<br />
grafted on the particle surface, i.e. the morphology<br />
should be either core-shell type or hairy-layer type<br />
[9]. This last solution can be carried out by the<br />
graft<strong>in</strong>g of a hydrophilic polymer poly(DMAE-<br />
MA) on the natural rubber latex particles by<br />
seeded emulsion polymerization. Gilbert et al. [10]<br />
have reported that this graft<strong>in</strong>g results <strong>in</strong> a<br />
copolymer act<strong>in</strong>g as electrosteric stabilizer. The<br />
DMAEMA monomer is <strong>in</strong>deed a tertiary am<strong>in</strong>e<br />
that can be protonated <strong>in</strong> acid conditions. In this<br />
way, although the modified latex displays a poor<br />
colloidal stability at pHE8, it shows a drastic<br />
improvement <strong>in</strong> colloidal stability <strong>in</strong> acid conditions<br />
(pH ¼ 2), attributed to the electrosteric<br />
stabilizer role of the grafted hydrophilic polymer.<br />
<strong>Wet</strong> <strong>STEM</strong> observations are used to study directly<br />
grafted hairy-layer particles of natural rubber<br />
latices <strong>in</strong> acid conditions and to compare them<br />
with non-grafted natural rubber latex particles.<br />
Figs. 8 and 9 showa comparison between wet<br />
<strong>STEM</strong> images and ultramicrotomy sections observed<br />
<strong>in</strong> <strong>STEM</strong> mode <strong>for</strong> non-grafted natural<br />
rubber (NR) particles and NR particles grafted<br />
with poly(DMAEMA) respectively. As expected,<br />
the particles size distribution is polydisperse with<br />
sizes rang<strong>in</strong>g from several tens of nm to 3 mm.<br />
First, the geometrical stability of non-grafted<br />
particles (Fig. 8) seems lower than that of grafted<br />
ones (Fig. 9). Some particles showde<strong>for</strong>mations<br />
and look more oval than spherical. This observation<br />
confirms the assumed stabiliz<strong>in</strong>g role of the<br />
graft<strong>in</strong>g.<br />
Secondly, the texture and contrast of the<br />
particles surface imaged differ totally <strong>in</strong> the case<br />
of grafted latices <strong>in</strong> comparison with non-grafted<br />
ones. Indeed, non-grafted particles surface seems<br />
very smooth, whereas grafted particles present a<br />
granular surface texture. This difference <strong>in</strong> particles<br />
surface aspect is related to the homogeneous<br />
particles morphology of non-grafted particle and
Fig. 8. Natural rubber latex (NRL): (a) droplet imaged at<br />
30 kV <strong>in</strong> annular dark-field wet <strong>STEM</strong> conditions without<br />
sta<strong>in</strong><strong>in</strong>g or other preparation: pure NRL, (b) ultramicrotomy<br />
foils encapsulated <strong>in</strong> a res<strong>in</strong> and imaged at 30 kV <strong>in</strong> annular<br />
dark-field <strong>STEM</strong> conditions. Scale bar length: 1 mm.<br />
to the hairy-layer morphology of poly DMAEMA<br />
grafted particles.<br />
In addition, if the size distribution of particles is<br />
very large <strong>for</strong> both of the latices, their average size<br />
seems to change with graft<strong>in</strong>g. Non-grafted<br />
particles exhibit slightly smaller diameters than<br />
grafted ones. These observations confirm the<br />
results obta<strong>in</strong>ed by dynamic light scatter<strong>in</strong>g measurements<br />
per<strong>for</strong>med with a Beckman Coulter<br />
apparatus, Mod. LS230: a mean diameter of<br />
170 nm is obta<strong>in</strong>ed <strong>for</strong> non-grafted particles and of<br />
210 nm <strong>for</strong> particles grafted with poly DMAEMA.<br />
The comparison between wet <strong>STEM</strong> images and<br />
<strong>STEM</strong> images of foils prepared by ultramicrotomy<br />
is quite <strong>in</strong>terest<strong>in</strong>g. Both are precious <strong>for</strong> the<br />
characterization of morphologies result<strong>in</strong>g from<br />
ARTICLE IN PRESS<br />
A. Bogner et al. / Ultramicroscopy 104 (2005) 290–301 297<br />
Fig. 9. Natural rubber latex (NRL) grafted with poly(DMAE-<br />
MA): hairy-layer morphology: (a) droplet imaged at 30 kV <strong>in</strong><br />
annular dark-field wet <strong>STEM</strong> conditions without sta<strong>in</strong><strong>in</strong>g or<br />
other preparation, (b) ultramicrotomy foils encapsulated <strong>in</strong> a<br />
res<strong>in</strong>, and imaged at 30 kV <strong>in</strong> annular dark-field <strong>STEM</strong><br />
conditions. Scale bar length: 500 nm.<br />
graft<strong>in</strong>g. But there is an important difference<br />
between these samples <strong>in</strong> the time required <strong>for</strong><br />
preparation, s<strong>in</strong>ce wet <strong>STEM</strong> does not require<br />
any. Although no sta<strong>in</strong><strong>in</strong>g has been per<strong>for</strong>med on<br />
samples imaged <strong>in</strong> wet <strong>STEM</strong> mode, the result<strong>in</strong>g<br />
contrast is greater. It should be noted that wet<br />
<strong>STEM</strong> contrast of particles differs from <strong>STEM</strong><br />
images of ultramicrotomed foils. In the first case,<br />
we pass through a whole particle (edges th<strong>in</strong>ner,<br />
i.e. darker than centre), whereas <strong>in</strong> the second<br />
case, only a slice of particle is imaged (one grey<br />
level). At last, the comparative study constitutes a<br />
good validation of the wet <strong>STEM</strong> techniques.<br />
It can be noted that wet <strong>STEM</strong> imag<strong>in</strong>g br<strong>in</strong>gs a<br />
newand direct method <strong>for</strong> the puzzl<strong>in</strong>g task of
298<br />
graft<strong>in</strong>g characterization, <strong>for</strong> which no other direct<br />
determ<strong>in</strong>ation is available. <strong>Wet</strong> <strong>STEM</strong> observations<br />
are very reproducible and allowto highlight<br />
many differences <strong>in</strong> particles aspect between the<br />
two different latex samples.<br />
3.3. Prospects<br />
For prospective evaluation, two samples very<br />
different from the applications described <strong>in</strong> previous<br />
sections have been imaged <strong>in</strong> annular dark<br />
field wet <strong>STEM</strong> conditions.<br />
Firstly, a suspension-type sample where the<br />
liquid phase is not water, is presented on Fig. 10.<br />
The <strong>STEM</strong> image shows details of a very th<strong>in</strong><br />
motor oil layer slightly diluted <strong>in</strong> hexane, and<br />
deposited on a TEM grid. Soot particles result<strong>in</strong>g<br />
from <strong>in</strong>complete combustion and arranged <strong>in</strong> a<br />
quasi-percolat<strong>in</strong>g network, partially broken dur<strong>in</strong>g<br />
the dilution step, have been imaged with good<br />
contrast and resolution. These results encourage<br />
future characterization of nano-objects <strong>in</strong> wet<br />
<strong>STEM</strong> mode, vary<strong>in</strong>g the nature of the liquid<br />
layer, provided that pressure and temperature<br />
ranges available <strong>in</strong> E<strong>SEM</strong> allowma<strong>in</strong>ta<strong>in</strong><strong>in</strong>g the<br />
sample above its saturated vapour pressure.<br />
Secondly, biological samples <strong>in</strong>cluded <strong>in</strong> water<br />
have been imaged <strong>in</strong> wet <strong>STEM</strong> mode. These<br />
samples are particularly sensitive to dehydration<br />
Fig. 10. Annular dark-field wet <strong>STEM</strong> image at 30 kV of<br />
organic objects submerged <strong>in</strong> a liquid phase: motor-oil conta<strong>in</strong><strong>in</strong>g<br />
soot particles arranged <strong>in</strong> a percolat<strong>in</strong>g network.<br />
ARTICLE IN PRESS<br />
A. Bogner et al. / Ultramicroscopy 104 (2005) 290–301<br />
Fig. 11. Annular dark-field wet <strong>STEM</strong> image at 30 kV of<br />
organic objects submerged <strong>in</strong> a liquid phase: Pseudomonas<br />
syr<strong>in</strong>gae pv. Syr<strong>in</strong>gae bacteria, stra<strong>in</strong> PPI203: double membrane<br />
structure and cellular division are observed.<br />
and beam damage. Fig. 11 shows bacteria of the<br />
species Pseudomonas syr<strong>in</strong>gae, where different<br />
steps of cellular division are observed. Thanks to<br />
transmission mode, details like double membrane<br />
structure are also well dist<strong>in</strong>guished <strong>in</strong> wet <strong>STEM</strong>,<br />
<strong>in</strong> comparison with classical E<strong>SEM</strong> imag<strong>in</strong>g. The<br />
wet <strong>STEM</strong> imag<strong>in</strong>g mode appears to be a straight<strong>for</strong>ward<br />
and powerful imag<strong>in</strong>g <strong>for</strong> two reasons:<br />
first, no sta<strong>in</strong><strong>in</strong>g preparation is required to obta<strong>in</strong><br />
high contrast even with low atomic number<br />
elements; second, the native state of the sample,<br />
i.e. the hydrated state, can be imaged, s<strong>in</strong>ce no<br />
sample preparation is required previously.<br />
Of course, the ability of E<strong>SEM</strong> to control<br />
evaporation through temperature and pressure<br />
variations allowto envisage the imag<strong>in</strong>g of <strong>in</strong> situ<br />
evolutions of suspension-type samples: film-<strong>for</strong>m<strong>in</strong>g<br />
process <strong>in</strong> latices.<br />
4. Discussions about wet <strong>STEM</strong> imag<strong>in</strong>g mode<br />
As presented <strong>in</strong> the Section 3, wet <strong>STEM</strong> allows<br />
observ<strong>in</strong>g directly a liquid layer conta<strong>in</strong><strong>in</strong>g nanoobjects,<br />
partially thanks to its development <strong>in</strong><br />
<strong>SEM</strong>, <strong>in</strong> addition <strong>in</strong> Environmental <strong>SEM</strong>. Firstly,<br />
wet environment and possibility of dynamic<br />
imag<strong>in</strong>g are specific to E<strong>SEM</strong>, and constitute a
part of the <strong>in</strong>terest of wet <strong>STEM</strong>. The specimens<br />
can <strong>in</strong>deed be ma<strong>in</strong>ta<strong>in</strong>ed <strong>in</strong> their wet state, so that<br />
particles <strong>in</strong>cluded <strong>in</strong> a layer of liquid are imaged.<br />
In this way, they are neither de<strong>for</strong>med nor<br />
collapsed, and their size can be correctly estimated.<br />
If required, their dynamic evolution can also be<br />
followed <strong>in</strong> situ, when evaporation occurs <strong>for</strong><br />
example. Secondly, the quite lowvoltages used <strong>in</strong><br />
<strong>SEM</strong> (1–30 kV) <strong>in</strong> comparison with TEM give<br />
access to a higher number of electrons–sample<br />
<strong>in</strong>teractions, result<strong>in</strong>g <strong>in</strong> more contrasted images<br />
[11]. F<strong>in</strong>ally, thanks to the development of field<br />
emission guns [12], the resolution available <strong>in</strong> <strong>SEM</strong><br />
is nowappreciable, so that <strong>SEM</strong> imag<strong>in</strong>g becomes<br />
an easy characterization method with a very high<br />
resolution, reach<strong>in</strong>g 1 nm <strong>in</strong> <strong>STEM</strong> mode at an<br />
acceleration voltage of 20 kV. Thanks to the field<br />
emission gun, nano-particles or objects around<br />
20 nm can easily be imaged <strong>in</strong> wet <strong>STEM</strong> mode,<br />
where the resolution has experimentally been<br />
shown to be lower than 5 nm (colloidal solution<br />
of Au particles).<br />
Another <strong>in</strong>terest of the wet <strong>STEM</strong> mode <strong>in</strong><br />
E<strong>SEM</strong> is the fact that it br<strong>in</strong>gs a newpallet of<br />
imag<strong>in</strong>g possibilities. Indeed, <strong>in</strong> the case of nanoobjects<br />
<strong>in</strong>cluded <strong>in</strong> a liquid, classical E<strong>SEM</strong><br />
imag<strong>in</strong>g shows some limits. A characteristic of<br />
wet <strong>STEM</strong> imag<strong>in</strong>g method vs. classical E<strong>SEM</strong>,<br />
thanks to transmission mode, is the access to<br />
volume <strong>in</strong><strong>for</strong>mation <strong>in</strong> a liquid. As we image the<br />
entire volume of the liquid, we observe not only<br />
the smooth surface of the colloidal solution or<br />
some particles emerg<strong>in</strong>g from this liquid phase,<br />
but also objects deep <strong>in</strong>side a liquid layer, and<br />
the way particles are piled up, whilst be<strong>in</strong>g limited<br />
by electrons transmission. Areas of particles<br />
layers superposition can also be detected and<br />
imaged.<br />
Images <strong>in</strong>terpretation sometimes leads to questions,<br />
and it is still difficult to expla<strong>in</strong> every<br />
contrasts theoretically because of the complexity<br />
of the numerous diffusion mechanisms <strong>in</strong>volved <strong>in</strong><br />
images <strong>for</strong>mation. This aspect still needs further<br />
<strong>in</strong>vestigation, through the development of Monte<br />
Carlo simulation. However, it is already possible<br />
to state some remarks about the colloidal solutions<br />
imaged. Particles imaged <strong>in</strong> this mode usually<br />
exhibit a halo or brighter contrast around the<br />
ARTICLE IN PRESS<br />
A. Bogner et al. / Ultramicroscopy 104 (2005) 290–301 299<br />
particle. In annular dark-field conditions, the<br />
contrast can be described as a mass–thickness<br />
<strong>in</strong>verse type [13]. As a result, brighter contrasts are<br />
<strong>in</strong>terpreted as thicker or higher atomic number<br />
composition areas. In this way, biggest particles<br />
look brighter, and light their environment so that a<br />
large area around big particles looks brighter, and<br />
the halo effect is enhanced <strong>for</strong> each particle. In<br />
addition, particles <strong>in</strong> colloidal state are often<br />
stabilized thanks to ionic surfactants. The presence<br />
of these negative charges may <strong>in</strong>teract with<br />
diffused electrons and participate to create a halo<br />
around particles.<br />
In a TEM, high collection angles are not used<br />
because the signal would suffer from lens aberrations.<br />
Other benefits occur <strong>in</strong> our case, thanks to<br />
<strong>SEM</strong> characteristics: high angles can be used <strong>for</strong><br />
collection result<strong>in</strong>g <strong>in</strong> an <strong>in</strong>creased signal level<br />
[12,14] and lowvoltages available <strong>in</strong>duce an<br />
improved contrast.<br />
<strong>Wet</strong> <strong>STEM</strong> requires th<strong>in</strong> samples <strong>in</strong> order to<br />
obta<strong>in</strong> an important transmission signal. In the<br />
case of colloidal solutions, this lowthickness<br />
elim<strong>in</strong>ates the usual drift phenomenon always<br />
occurr<strong>in</strong>g on large size drops, which prevents<br />
imag<strong>in</strong>g even with high scann<strong>in</strong>g rate acquisition.<br />
Liquid is <strong>in</strong>deed ma<strong>in</strong>ta<strong>in</strong>ed on small areas def<strong>in</strong>ed<br />
by the TEM grid, through copper squares and<br />
holes <strong>in</strong> the carbon layer. These small areas can be<br />
observed us<strong>in</strong>g slowscan imag<strong>in</strong>g conditions,<br />
known to <strong>in</strong>crease image quality especially <strong>in</strong><br />
<strong>environmental</strong> mode.<br />
Polymers or other organic objects are very high<br />
damage-sensitive samples, moreover, <strong>in</strong> the presence<br />
of water [15], and are not adapted to several<br />
imag<strong>in</strong>g of a given area. However, damage effects<br />
can be reduced by us<strong>in</strong>g low-dose methods [16].<br />
Focus, astigmatism and wobblers readjustments<br />
are done away from the image, the beam then<br />
be<strong>in</strong>g moved on the area of <strong>in</strong>terest just <strong>for</strong> the<br />
acquisition. The aim is to prevent beam damage on<br />
the area prior to the image record<strong>in</strong>g. This<br />
m<strong>in</strong>imizes the exposure time and the cumulated<br />
dose. In addition, as a compromise between<br />
contrast and damage, the maximum acceleration<br />
tension has been used (30 kV), because<br />
higher tension means lower electron–sample <strong>in</strong>teractions<br />
[11].
300<br />
In addition, the lowthickness of our samples<br />
also <strong>in</strong>duces a smaller <strong>in</strong>teraction volume <strong>in</strong><br />
comparison with classical <strong>SEM</strong> samples, which<br />
also means a smaller damaged volume. Most of<br />
the beam passes through, result<strong>in</strong>g <strong>in</strong> transmitted<br />
and scattered beam [14]. Moreover, <strong>in</strong> the case of<br />
sub-micrometric particles exam<strong>in</strong>ation <strong>in</strong> conventional<br />
<strong>SEM</strong>, specially those composed of low<br />
atomic number elements, the electron beam<br />
penetrates the entire particle and the substrate<br />
below—the <strong>in</strong>teraction volume is greater than the<br />
particles—<strong>in</strong> such a way that the signal quality is<br />
affected [17]. Us<strong>in</strong>g <strong>STEM</strong> imag<strong>in</strong>g, where the<br />
specimen is changed from a bulk material to a th<strong>in</strong><br />
film supported by a grid, detection and visualization<br />
of particles are improved, and image quality<br />
<strong>in</strong>creases.<br />
5. Conclusions<br />
The present wet <strong>STEM</strong> imag<strong>in</strong>g system, new<br />
toolkit developed <strong>in</strong> E<strong>SEM</strong>, allows straight<strong>for</strong>ward<br />
transmission observations of wet samples<br />
constituted by nano-objects <strong>in</strong>cluded <strong>in</strong> a water<br />
layer. A specially good resolution can be achieved:<br />
5 nm with a k<strong>in</strong>d of resolution test<strong>in</strong>g sample: gold<br />
nano-particles colloidal suspensions. The contrast<br />
is enhanced thanks to lowvoltages, and annular<br />
dark-field imag<strong>in</strong>g conditions, specially <strong>in</strong>terest<strong>in</strong>g<br />
<strong>for</strong> lowatomic number materials. This transmission<br />
technique gives access to volume <strong>in</strong><strong>for</strong>mation<br />
so that we do not image only the surface of the<br />
water drop. It helps to limit drift<strong>in</strong>g phenomenon<br />
of objects float<strong>in</strong>g <strong>in</strong> a large amount of water, so<br />
that it allows slow-scan high-def<strong>in</strong>ition imag<strong>in</strong>g.<br />
The ma<strong>in</strong> limits that make the imag<strong>in</strong>g sequence<br />
more delicate are beam damage effects, enhanced<br />
<strong>in</strong> the presence of water.<br />
The huge <strong>in</strong>terest of the present imag<strong>in</strong>g method<br />
<strong>in</strong> the specific field of suspensions is highlighted <strong>in</strong><br />
this paper. The size and size distribution of nanoobjects<br />
are easily determ<strong>in</strong>ed, and suspension<br />
stability can be evaluated. In addition, even if<br />
complete image <strong>in</strong>terpretation needs further <strong>in</strong>vestigations,<br />
contrast is well understood, and th<strong>in</strong><br />
details can be detected on suspended nano-objects,<br />
as shown <strong>in</strong> the case of latex grafted particles.<br />
ARTICLE IN PRESS<br />
A. Bogner et al. / Ultramicroscopy 104 (2005) 290–301<br />
Comparative approach between wet <strong>STEM</strong> images<br />
and others observations and characterization<br />
results are very <strong>in</strong>terest<strong>in</strong>g. Comparison between<br />
different samples also br<strong>in</strong>g a lot of precious<br />
<strong>in</strong><strong>for</strong>mation about samples.<br />
Acknowledgements<br />
We wish to thank all the samples suppliers:<br />
A. and R. Guimara˜ es (GEMPPM and Dequi-<br />
Faenquil—Lorena, Brazil) <strong>for</strong> natural rubber latices,<br />
J. M. Asua, (Institute <strong>for</strong> Polymer Materials—San<br />
Sebastian, Spa<strong>in</strong>) <strong>for</strong> m<strong>in</strong>i-emulsions, F. Dalmas<br />
(GEMPPM) <strong>for</strong> carbon nanotubes, P. Oger<br />
(LST—ENS Lyon) <strong>for</strong> Pseudomonas syr<strong>in</strong>gae<br />
bacteria, S. Roux (LPCML—UCB Lyon 1) and<br />
P. Perriat (GEMPPM) <strong>for</strong> gold nano-particles<br />
suspensions. We present our special acknowledgements<br />
to K. Masenelli-Varlot (GEMPPM) <strong>for</strong><br />
ultramicrotomed foils preparation.<br />
The Consortium Lyonnais de Microscopie<br />
Electronique is thanked <strong>for</strong> the access to the FEI<br />
XL 30 FEG E<strong>SEM</strong>.<br />
This work was f<strong>in</strong>ancially supported by Total<br />
France S. A.<br />
References<br />
[1] J.L. Keddie, P. Meredith, R.A.L. Jones, A.M. Donald,<br />
Macromol. 28 (1995) 2673–2682.<br />
[2] A.M. Donald, C.B. He, C.P. Royall, M. Sferrazza, N.A.<br />
Stelmashenko, B.L. Thiel, Colloids Surf. A 174 (2000)<br />
37–53.<br />
[3] D.J. Stokes, Adv. Eng. Mater. 3 3 (2001) 126–130.<br />
[4] R.E. Cameron, A.M. Donald, J. Microsc. 173 (1994)<br />
227–237.<br />
[5] A.M. Donald, Nat. Mater. 2 (2003) 511–516.<br />
[6] S.M. Chabane Sari, P.J. Debouttière, R. Lamart<strong>in</strong>e,<br />
F. Vocanson, C. Dujard<strong>in</strong>, G. Ledoux, S. Roux, O.<br />
Tillement, P. Perriat, J. Mater. Chem. 14 (2004) 402–407.<br />
[7] F. Dalmas, L. Chazeau, C. Gauthier, K. Masenelli-Varlot,<br />
R. Dendievel, J.-Y. Cavaillé, L. Forro, J. Polym. Sci. Part<br />
B : Polym. Phys. 43 (2005) 1186–1197.<br />
[8] M. do Amaral, A. Bogner, C. Gauthier, P.-H. Jouneau,<br />
J.M. Asua, G. Thollet, Macromol. Rapid Commun. 26<br />
(2005) 365–368.<br />
[9] P.C. Oliveira, A. Guimarães, J.-Y. Cavaillé, L. Chazeau,<br />
R.G. Gilbert, A.M. Santos, Polymer 46–4 (2005)<br />
1105–1111.
[10] D.J. Lamb, J.F. Anstey, C.M. Fellows, M.J. Monteiro,<br />
R.G. Gilbert, Biomacromol. 2 (2001) 518–525.<br />
[11] D.B. Williams, C.B. Carter, Transmission Electron Microscopy—III.<br />
Imag<strong>in</strong>g, Plenum Press, NewYork.<br />
[12] L. Reimer, Scann<strong>in</strong>g Electron Microscopy: Physics of<br />
Image Formation and Microanalysis, second ed, Spr<strong>in</strong>ger,<br />
Berl<strong>in</strong>, Heidelberg, NewYork, 1998.<br />
[13] C.J.G. Plummer, EPFL, Techniques de l’<strong>in</strong>ge´ nieur AM 3 282<br />
ARTICLE IN PRESS<br />
A. Bogner et al. / Ultramicroscopy 104 (2005) 290–301 301<br />
[14] L.C. Sawyer, D.T. Grubb, Polymer Microscopy, Chapman<br />
and Hall, London, 1987.<br />
[15] S. Kitch<strong>in</strong>g, A.M. Donald, J. Microsc. 190 (1998) 357–365.<br />
[16] K. Varlot, Ph.D. Thesis, Ecole Centrale de Lyon, 1998.<br />
[17] J. Goldste<strong>in</strong>, et al., Scann<strong>in</strong>g Electron Microscopy and<br />
X-ray Microanalysis, second ed, Plenum Press, NewYork,<br />
1992.