Knowledge and attitudes towards healthy eating and physical activity:
Knowledge and attitudes towards healthy eating and physical activity:
Knowledge and attitudes towards healthy eating and physical activity:

You also want an ePaper? Increase the reach of your titles
YUMPU automatically turns print PDFs into web optimized ePapers that Google loves.
<strong>Knowledge</strong> <strong>and</strong> <strong>attitudes</strong> <strong>towards</strong><br />
<strong>healthy</strong> <strong>eating</strong> <strong>and</strong> <strong>physical</strong> <strong>activity</strong>:<br />
what the data tell us<br />
May 2011<br />
NOO | <strong>Knowledge</strong> <strong>and</strong> <strong>attitudes</strong> <strong>towards</strong> <strong>healthy</strong> <strong>eating</strong> <strong>and</strong> <strong>physical</strong> <strong>activity</strong>: what the data tell us 1
Contents<br />
Key points ............................................................................................................................ 3<br />
Introduction ......................................................................................................................... 3<br />
Background.......................................................................................................................... 3<br />
Methodology ....................................................................................................................... 4<br />
Datasets ........................................................................................................................... 4<br />
Interpretation of the data.............................................................................................. 6<br />
Section one: adults .............................................................................................................. 7<br />
a. <strong>Knowledge</strong>, beliefs <strong>and</strong> self-perceptions relating to diet........................................ 7<br />
i. <strong>Knowledge</strong> of what constitutes a <strong>healthy</strong> diet <strong>and</strong> perceptions of information<br />
provision ..................................................................................................................... 7<br />
ii. Appraisal of own diet ............................................................................................ 9<br />
iii. Attitudes to <strong>healthy</strong> <strong>eating</strong> ................................................................................ 11<br />
iv. Confidence in changing diet............................................................................... 11<br />
v. Barriers to <strong>healthy</strong> <strong>eating</strong> .................................................................................... 11<br />
vi. Facilitators of <strong>healthy</strong> <strong>eating</strong>.............................................................................. 13<br />
b. Perceptions of dieting <strong>and</strong> weight loss ................................................................... 14<br />
i. Weight, weight loss <strong>and</strong> dieting .......................................................................... 14<br />
ii Factors influencing <strong>eating</strong> habits ......................................................................... 15<br />
c. <strong>Knowledge</strong>, beliefs <strong>and</strong> self-perceptions relating to <strong>physical</strong> <strong>activity</strong>................... 16<br />
i. <strong>Knowledge</strong> of recommended levels of <strong>physical</strong> <strong>activity</strong>..................................... 16<br />
ii. Perceptions of <strong>physical</strong> <strong>activity</strong> facilities............................................................. 17<br />
iii. Appraisal of own participation in <strong>physical</strong> <strong>activity</strong> ........................................... 17<br />
iv. Barriers <strong>and</strong> facilitators to participating in <strong>physical</strong> <strong>activity</strong> ............................ 18<br />
Section two: children <strong>and</strong> young people ......................................................................... 20<br />
a. <strong>Knowledge</strong>, beliefs <strong>and</strong> self-perceptions relating to diet...................................... 20<br />
i. <strong>Knowledge</strong> <strong>and</strong> underst<strong>and</strong>ing of what constitutes a <strong>healthy</strong> diet .................. 20<br />
ii. Factors influencing <strong>healthy</strong> <strong>eating</strong> in school...................................................... 22<br />
b. Perceptions of weight, weight loss <strong>and</strong> dieting ..................................................... 23<br />
i. Weight, weight loss <strong>and</strong> dieting .......................................................................... 23<br />
c. <strong>Knowledge</strong>, beliefs <strong>and</strong> self-perceptions relating to <strong>physical</strong> <strong>activity</strong>................... 24<br />
i. <strong>Knowledge</strong> of recommended levels of <strong>physical</strong> <strong>activity</strong>..................................... 24<br />
ii. Perceptions of <strong>physical</strong> <strong>activity</strong> facilities............................................................. 25<br />
iii. Appraisal of own participation in <strong>physical</strong> <strong>activity</strong> ........................................... 25<br />
Discussion <strong>and</strong> conclusions................................................................................................ 25<br />
Appendix 1: glossary of terms .......................................................................................... 27<br />
Appendix 2: summary of data sources <strong>and</strong> availability................................................... 29<br />
Appendix 3: data tables .................................................................................................... 33<br />
References.......................................................................................................................... 37<br />
Since this report was researched <strong>and</strong> compiled, the Foods St<strong>and</strong>ards Agency (FSA)<br />
released a report ‘An insight into <strong>attitudes</strong> to food’. Readers may find it helpful to<br />
also look at the FSA report.<br />
NOO | <strong>Knowledge</strong> <strong>and</strong> <strong>attitudes</strong> <strong>towards</strong> <strong>healthy</strong> <strong>eating</strong> <strong>and</strong> <strong>physical</strong> <strong>activity</strong>: what the data tell us 2
Key points<br />
• The majority of adults <strong>and</strong> children have an underst<strong>and</strong>ing of what<br />
constitutes a <strong>healthy</strong> diet. Eating lots of fruit <strong>and</strong> vegetables is the most<br />
frequently cited component of a <strong>healthy</strong> diet.<br />
• The majority of adults consider <strong>healthy</strong> <strong>eating</strong> to be important <strong>and</strong> would<br />
like to improve their own <strong>eating</strong> habits <strong>and</strong> those of their children.<br />
• Adults from lower income groups are more likely to cite cost as an<br />
important influence on their <strong>eating</strong> habits.<br />
• The most frequently cited method of controlling weight is trying to eat less<br />
at mealtimes.<br />
• The majority of adults report that they are either fairly or very <strong>physical</strong>ly<br />
active. Morbidly obese adults are significantly less likely than adults of a<br />
<strong>healthy</strong> weight to consider themselves <strong>physical</strong>ly active.<br />
• Time is the most commonly cited barrier to participation in <strong>physical</strong> <strong>activity</strong>.<br />
• The majority of children consider themselves to be about the right weight.<br />
• Incentives may be successful in encouraging children to make healthier<br />
food choices at school.<br />
• Interventions focusing on personal <strong>and</strong> social factors may be helpful in<br />
bringing about behaviour change.<br />
Introduction<br />
There is a range of data that describes people’s knowledge of <strong>and</strong> <strong>attitudes</strong> to<br />
<strong>physical</strong> <strong>activity</strong> <strong>and</strong> <strong>healthy</strong> <strong>eating</strong> in Engl<strong>and</strong>. However, much of the data have not<br />
been examined in full <strong>and</strong> no attempt has been made to pull together the findings.<br />
The objective of this paper is to support public health practitioners who wish to gain a<br />
greater underst<strong>and</strong>ing of these issues. It presents new analyses of knowledge <strong>and</strong><br />
attitudinal data on <strong>physical</strong> <strong>activity</strong> <strong>and</strong> dietary intake from national sources <strong>and</strong><br />
investigates factors that may be mediators of behaviour change. Whilst it is recognised<br />
that there are additional data sources at local level <strong>and</strong> in the commercial sector, this<br />
paper is not intended to be a comprehensive review <strong>and</strong> only includes data which is in<br />
the public domain or freely available.<br />
The paper is split into two sections: adults <strong>and</strong> children. These sections are then<br />
further divided, where data is available, into the following themes:<br />
• knowledge, beliefs <strong>and</strong> self-perceptions relating to diet<br />
• perceptions of dieting <strong>and</strong> weight loss<br />
• knowledge, beliefs <strong>and</strong> self-perceptions relating to <strong>physical</strong> <strong>activity</strong><br />
Background<br />
An individual’s diet <strong>and</strong> <strong>physical</strong> <strong>activity</strong> habits are influenced by their knowledge of<br />
<strong>and</strong> <strong>attitudes</strong> <strong>towards</strong> these behaviours. Investigation of these variables in a<br />
population provides an insight into the factors that may be mediators of motivation<br />
to change behaviour.<br />
NOO | <strong>Knowledge</strong> <strong>and</strong> <strong>attitudes</strong> <strong>towards</strong> <strong>healthy</strong> <strong>eating</strong> <strong>and</strong> <strong>physical</strong> <strong>activity</strong>: what the data tell us 3
Theories from health psychology, sociology <strong>and</strong> social psychology have been proposed<br />
to explain the link between knowledge, <strong>attitudes</strong>, skills, social <strong>and</strong> environmental<br />
influences, <strong>and</strong> behaviour.<br />
For example, the health belief model theorises that in order for behaviour change to<br />
take place, an individual must first believe that change is both possible <strong>and</strong> beneficial,<br />
<strong>and</strong> that the benefits of changing outweigh any perceived costs of making the<br />
change. 1 The model demonstrates the relationship between an individual’s <strong>attitudes</strong><br />
<strong>towards</strong> a particular set of behaviours, <strong>and</strong> their subsequent willingness or ability to<br />
make changes to improve or protect their health. For example, if a person does not<br />
consider their diet to be un<strong>healthy</strong>, they are unlikely to make any significant dietary<br />
changes to improve their health – especially if they perceive that doing so would<br />
mean substituting food they like for food they may like less.<br />
Social cognitive theory also considers the importance of an individual’s knowledge<br />
<strong>and</strong> <strong>attitudes</strong> in influencing behaviour <strong>and</strong> behaviour change. 2 In addition, it also<br />
recognises the impact of external factors such as social <strong>and</strong> environmental influences<br />
on individual behaviour. 3 For example, the likelihood of a child <strong>eating</strong> five portions of<br />
fruit <strong>and</strong> vegetables a day will be influenced by social factors (e.g. their parents’ views<br />
on <strong>healthy</strong> <strong>eating</strong>), <strong>and</strong> environmental factors (e.g. the availability of fruit <strong>and</strong><br />
vegetables at home).<br />
The principles of behaviour change theories have been used in research studies to<br />
identify personal <strong>and</strong> social correlates of <strong>healthy</strong> <strong>eating</strong> <strong>and</strong> <strong>physical</strong> <strong>activity</strong><br />
behaviours. A systematic review identified that the perception of <strong>physical</strong> <strong>activity</strong> as<br />
being enjoyable was more highly correlated with participation than any health<br />
benefits. 4 Other studies have, identified the <strong>physical</strong> environment as a determinant of<br />
<strong>physical</strong> <strong>activity</strong> – surroundings perceived as unpleasant or unsafe have been shown to<br />
act as a deterrent to <strong>physical</strong> <strong>activity</strong> participation. 5<br />
The influence of the social environment <strong>and</strong>, in particular, the views of peers <strong>and</strong><br />
‘significant others’ is a common theme as people tend to engage in behaviour which is<br />
practiced by, <strong>and</strong> valued by their peers. Self-efficacy, which is an individual’s belief<br />
that they are capable of changing their behaviours, can also be a key determinant of<br />
<strong>eating</strong> <strong>and</strong> <strong>physical</strong> <strong>activity</strong> behaviour. Researchers have recommended that<br />
motivational education techniques may be useful in influencing personal belief <strong>and</strong><br />
therefore support sustained behaviour change. 6 A review that looked at r<strong>and</strong>omised,<br />
controlled psychological interventions for overweight or obese adults supports<br />
theories of behaviour change <strong>and</strong> advocates an approach to weight management that<br />
focuses on using cognitive therapies to change behaviour combined with <strong>healthy</strong><br />
<strong>eating</strong> education <strong>and</strong> exercise components. 7<br />
Methodology<br />
Datasets<br />
This paper analyses national level data from a range of datasets on the knowledge of<br />
<strong>and</strong> <strong>attitudes</strong> <strong>towards</strong> <strong>healthy</strong> <strong>eating</strong> <strong>and</strong> <strong>physical</strong> <strong>activity</strong> of adults <strong>and</strong> children in<br />
Engl<strong>and</strong>. The datasets used for the analyses are summarised in Figure 1 <strong>and</strong> described<br />
in more detail in Appendix 1. They were previously presented in a National Obesity<br />
Observatory (NOO) briefing paper, Data sources: knowledge of <strong>and</strong> <strong>attitudes</strong> <strong>towards</strong><br />
<strong>healthy</strong> <strong>eating</strong> <strong>and</strong> <strong>physical</strong> <strong>activity</strong>. 8<br />
NOO | <strong>Knowledge</strong> <strong>and</strong> <strong>attitudes</strong> <strong>towards</strong> <strong>healthy</strong> <strong>eating</strong> <strong>and</strong> <strong>physical</strong> <strong>activity</strong>: what the data tell us 4
The inclusion criteria used to select datasets in this <strong>and</strong> the earlier NOO briefing paper<br />
were:<br />
• the data were derived from questions which included those relating to<br />
knowledge, opinions, feelings, <strong>attitudes</strong>, beliefs <strong>and</strong> values regarding<br />
<strong>healthy</strong> <strong>eating</strong> or <strong>physical</strong> <strong>activity</strong> behaviours<br />
• the data were collected within the last ten years<br />
• the samples were robust at a national level<br />
The most recently available data were analysed from each data source. Data relating<br />
to actual dietary intake <strong>and</strong> <strong>physical</strong> <strong>activity</strong> levels were excluded. Body Mass Index<br />
(BMI) data were included where analysis across different weight categories was<br />
relevant. All datasets were in the public domain except for the Target Group Index<br />
(TGI) data. At the time of writing, TGI data were provided by the Department of<br />
Health (DH) for use by healthcare professionals <strong>and</strong> analysts up to the end of March<br />
2011.<br />
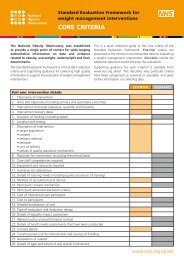
Figure 1: dataset summaries<br />
Dataset<br />
Sample<br />
size (n)<br />
Raw data<br />
available<br />
Data supply<br />
Target<br />
group<br />
Notes<br />
Health Survey for Engl<strong>and</strong><br />
2007<br />
6,882<br />
7,504<br />
Yes UK data archive Adults<br />
Children<br />
Active People Survey 2008 180,000 Yes UK data archive Adults<br />
Low Income Diet <strong>and</strong><br />
Nutrition Survey 2005<br />
British Social Attitudes<br />
Survey 2008<br />
National Diet <strong>and</strong> Nutrition<br />
Survey 2000/01<br />
3,728 Yes UK data archive Adults<br />
4,486 Yes UK data archive Adults<br />
2, 251 Yes UK data archive Adults<br />
Target Group Index 2008/09 20,000 Yes East Midl<strong>and</strong>s<br />
Public Health<br />
Observatory on<br />
behalf of the DH<br />
Adults<br />
Questions<br />
which met the<br />
inclusion criteria<br />
were analysed<br />
at individual<br />
level. All of the<br />
data presented<br />
represent crude<br />
rates calculated<br />
from individual<br />
responses with<br />
95% confidence<br />
intervals where<br />
appropriate <strong>and</strong><br />
where sample<br />
sizes were<br />
provided.<br />
Food St<strong>and</strong>ards Agency<br />
Consumer Attitudes Survey<br />
2008<br />
2,627 Yes Food St<strong>and</strong>ards<br />
Agency<br />
Adults<br />
Place Survey 2008 543,713 No Published report Adults<br />
Sodexho School Meals <strong>and</strong><br />
Lifestyles Survey 2005<br />
N/A No Published report Children<br />
Data not<br />
available for<br />
analysis<br />
Tell Us 3 Survey 2008 148, 988 No Published report Children<br />
NOO | <strong>Knowledge</strong> <strong>and</strong> <strong>attitudes</strong> <strong>towards</strong> <strong>healthy</strong> <strong>eating</strong> <strong>and</strong> <strong>physical</strong> <strong>activity</strong>: what the data tell us 5
Interpretation of the data<br />
The data in this paper should be interpreted with caution <strong>and</strong> consideration given to<br />
potential bias due to sampling methodology <strong>and</strong> study design. Many of the included<br />
datasets were from surveys based on either self-completion questionnaires or<br />
interviews. Responses to single-choice <strong>and</strong> closed-list questions may provide a less<br />
accurate reflection of an individual’s views than an open-ended question, or a singlechoice<br />
question prioritised from a list. Self-report questionnaires about behaviours<br />
such as <strong>eating</strong> <strong>and</strong> <strong>physical</strong> <strong>activity</strong> are particularly prone to recall <strong>and</strong> reporting bias.<br />
The results may also be subject to response bias. This can occur when respondents are<br />
aware of specific behaviours being ‘socially desirable’ <strong>and</strong> are motivated to respond<br />
accordingly. 8 This bias effect is more pronounced when a respondent is being<br />
interviewed.<br />
Where possible, 95% confidence intervals were included on all charts.<br />
NOO | <strong>Knowledge</strong> <strong>and</strong> <strong>attitudes</strong> <strong>towards</strong> <strong>healthy</strong> <strong>eating</strong> <strong>and</strong> <strong>physical</strong> <strong>activity</strong>: what the data tell us 6
Section one: adults<br />
This section summarises the responses given by adults regarding their <strong>physical</strong> <strong>activity</strong><br />
<strong>and</strong> dietary intake as well as what they perceive constitutes a <strong>healthy</strong> diet in children.<br />
Key points<br />
• Most adults have an underst<strong>and</strong>ing of the different components of a<br />
<strong>healthy</strong> diet. Eating lots of fruit <strong>and</strong> vegetables is the most frequently cited<br />
component of a <strong>healthy</strong> diet.<br />
• The majority of adults consider <strong>healthy</strong> <strong>eating</strong> to be important, <strong>and</strong> their<br />
own diet to be <strong>healthy</strong>.<br />
• Obese <strong>and</strong> morbidly obese adults are significantly less likely to consider<br />
their diet to be very <strong>healthy</strong> <strong>and</strong> significantly more likely to report a desire<br />
to make <strong>healthy</strong> changes to their diet, than those of a <strong>healthy</strong> weight.<br />
• The majority of adults say they would like to make improvements to their<br />
own diets. Obese adults are significantly more likely than <strong>healthy</strong> weight<br />
adults to consider this difficult to achieve.<br />
• Difficulties in changing current <strong>eating</strong> habits, lack of time <strong>and</strong> the cost of<br />
<strong>healthy</strong> foods are the most frequently reported barriers to <strong>eating</strong> a<br />
healthier diet.<br />
• Adults from lower income groups are more likely than those from all<br />
income groups to cite affordability as a barrier to <strong>healthy</strong> <strong>eating</strong>.<br />
• The majority of respondents believe that schools have a responsibility to<br />
make sure children eat healthily <strong>and</strong> exercise regularly.<br />
a. <strong>Knowledge</strong>, beliefs <strong>and</strong> self-perceptions relating to diet<br />
The findings in this section are derived from a range of datasets. The main findings<br />
from these datasets have been categorised according to different themes:<br />
• knowledge of what constitutes a <strong>healthy</strong> diet <strong>and</strong> perceptions of<br />
information provision<br />
• appraisal of one’s own diet<br />
• <strong>attitudes</strong> to <strong>healthy</strong> <strong>eating</strong><br />
• confidence in changing diet<br />
• barriers to <strong>and</strong> facilitators of <strong>healthy</strong> <strong>eating</strong><br />
i. <strong>Knowledge</strong> of what constitutes a <strong>healthy</strong> diet <strong>and</strong> perceptions of<br />
information provision<br />
The results of the Health Survey for Engl<strong>and</strong> 2007 (HSE 2007) suggest that the majority<br />
of adults were aware of the national public health campaigns relating to <strong>healthy</strong><br />
<strong>eating</strong> including limiting salt intake, reducing fat intake <strong>and</strong> consuming at least five<br />
portions of fruit <strong>and</strong> vegetables per day.<br />
Respondents were presented with a list of possible components that could form part<br />
of a <strong>healthy</strong> diet for both adults <strong>and</strong> children. Multiple responses were allowed with<br />
no prioritisation between them. Over 90% of the respondents believed that the<br />
following were either ‘very important’ or ‘quite important’ for <strong>healthy</strong> diets in adults<br />
<strong>and</strong> children:<br />
NOO | <strong>Knowledge</strong> <strong>and</strong> <strong>attitudes</strong> <strong>towards</strong> <strong>healthy</strong> <strong>eating</strong> <strong>and</strong> <strong>physical</strong> <strong>activity</strong>: what the data tell us 7
• limiting fat<br />
• limiting saturated fat<br />
• limiting sugar<br />
• <strong>eating</strong> lots of whole grain foods<br />
• <strong>eating</strong> lots of fruit <strong>and</strong> vegetables<br />
• limiting salt<br />
• drinking lots of water<br />
• <strong>eating</strong> a balanced diet<br />
There were a number of other interesting findings. Limiting fat was considered to be<br />
significantly more important for adults’ diets than children’s, while the reverse was<br />
true for the importance of limiting sugar. Eating lots of red meat was thought to be<br />
‘not very important’ or ‘not at all important’ for the diets of adults (66%) or children<br />
(58%). Similarly, vitamin supplements were considered ‘not very’ or ‘not at all’<br />
important for the diets of adults (68%) or children (67%).<br />
It should be noted, however, that it is not clear if the responses were affected by<br />
social desirability bias.<br />
The Low Income Diet <strong>and</strong> Nutrition Survey 2005 (LIDNS 2005) recorded similar data to<br />
the HSE 2007 by asking adults: ‘What do you consider to be a <strong>healthy</strong> diet’. Answers<br />
were free response, <strong>and</strong> <strong>eating</strong> more fruit <strong>and</strong> vegetables was mentioned most<br />
frequently with almost half of respondents citing this as a factor. Limiting fat intake<br />
was also mentioned by almost 25% of respondents. The top ten responses to this<br />
question are shown in Figure 2.<br />
Figure 2: Responses of adults from lower income groups to the question ‘What do<br />
you consider to be a <strong>healthy</strong> diet’<br />
More variety<br />
Eating regularly/not snacking<br />
Less sugar/sugary foods<br />
Eating smaller portions<br />
Using less fat in cooking<br />
Eating a balanced diet<br />
More fresh food<br />
Less fat/fatty foods<br />
More fruit/juice<br />
More vegetables<br />
0% 10% 20% 30% 40% 50%<br />
Source: LIDNS, 2005<br />
NOO | <strong>Knowledge</strong> <strong>and</strong> <strong>attitudes</strong> <strong>towards</strong> <strong>healthy</strong> <strong>eating</strong> <strong>and</strong> <strong>physical</strong> <strong>activity</strong>: what the data tell us 8
Responses to the two surveys varied according to question format. For example, only<br />
6% of respondents mentioned ‘<strong>eating</strong> less sugar’ in the open-ended question from the<br />
LIDNS 2005, compared with over 90% of those provided with a closed-list question in<br />
the HSE 2007. The results may also have been influenced by the different timescales<br />
during which the data were collected. Limiting salt intake was not mentioned in the<br />
LIDNS 2005 survey, but was in the HSE 2007 survey. It is possible the benefits of<br />
reducing salt intake were more widely disseminated by the time the 2007 survey was<br />
carried out.<br />
The British Social Attitudes Survey 2008 (BSAS 2008) reports on adult perceptions of<br />
the quality of information about food <strong>and</strong> <strong>healthy</strong> <strong>eating</strong> for children. Almost 70% of<br />
respondents felt that schools should ensure that children eat healthily <strong>and</strong> exercise.<br />
Over 50% of respondents thought that the government should provide advice for<br />
parents, but only 35% stated that advice currently provided by the government for<br />
parents was useful.<br />
Data from the Target Group Index (TGI) provide information about people’s preferred<br />
source of information on <strong>healthy</strong> lifestyles. The majority of respondents (65%) said<br />
they would prefer to receive such information from their general practitioner or<br />
practice nurse.<br />
ii. Appraisal of own diet<br />
The HSE 2007 asked adults to assess their diet as either ‘very <strong>healthy</strong>’, ‘quite <strong>healthy</strong>’, ‘not<br />
very <strong>healthy</strong>’ or ‘very un<strong>healthy</strong>’. The majority of respondents felt that their diet was ‘quite<br />
<strong>healthy</strong>’ <strong>and</strong> a significantly higher proportion said it was ‘very <strong>healthy</strong>’ than those who said<br />
it was ‘not very <strong>healthy</strong>’. Morbidly obese respondents were significantly less likely to believe<br />
that their diet was ‘very <strong>healthy</strong>’ than those of a <strong>healthy</strong> weight, although none reported that<br />
their diet was ‘very un<strong>healthy</strong>’ (see Appendix 3, Table 1).<br />
In the same survey, 69% of respondents stated that they would like to eat more healthily.<br />
This suggests that although most people believe their diet to be <strong>healthy</strong>, there are still<br />
some aspects that they would like to improve. Those respondents classified as morbidly<br />
obese were significantly more likely to report that they would like to eat more healthily<br />
(81%) than those of a <strong>healthy</strong> weight (69%).<br />
The LIDNS 2005 also reported on the changes respondents would like to make to their own<br />
diet <strong>and</strong> that of their children. The question was open-ended. Eating more fruit <strong>and</strong><br />
vegetables <strong>and</strong> <strong>eating</strong> a healthier diet were the most popular changes that people would<br />
like to make for themselves <strong>and</strong> for their children. Figures 3 <strong>and</strong> 4 show the top ten<br />
changes adults would like to make to their own <strong>and</strong> their children’s diet.<br />
NOO | <strong>Knowledge</strong> <strong>and</strong> <strong>attitudes</strong> <strong>towards</strong> <strong>healthy</strong> <strong>eating</strong> <strong>and</strong> <strong>physical</strong> <strong>activity</strong>: what the data tell us 9
Figure 3: Responses of adults to the question ‘What changes would you make to your<br />
own diet’<br />
Less sugar/other sugary foods<br />
Better quality foods<br />
Eat regularly/not snacking<br />
More organic food<br />
More variety<br />
More fresh food<br />
Less fat/fatty foods<br />
More vegetables (including salad)<br />
More fruit/fruit juice<br />
Healthier diet<br />
0% 5% 10% 15% 20% 25%<br />
Source: LIDNS, 2005<br />
Figure 4: Responses of adults to the question ‘What changes would you make to your<br />
children’s diet’<br />
Less fizzy/sugary drinks<br />
Less sugar/sugary foods<br />
Less crisps/chips<br />
Eat/drink more for other reasons<br />
More fresh food<br />
Less junk food<br />
More variety<br />
Less chocolate/sweets<br />
Healthier diet<br />
More fruit/fruit juice<br />
More vegetables (including salad)<br />
0% 5% 10% 15% 20% 25% 30% 35% 40%<br />
Source: LIDNS, 2005<br />
NOO | <strong>Knowledge</strong> <strong>and</strong> <strong>attitudes</strong> <strong>towards</strong> <strong>healthy</strong> <strong>eating</strong> <strong>and</strong> <strong>physical</strong> <strong>activity</strong>: what the data tell us 10
iii. Attitudes to <strong>healthy</strong> <strong>eating</strong><br />
The Food St<strong>and</strong>ards Agency’s (FSA) Consumer Attitudes Survey 2008 found that 87%<br />
of respondents either agreed or strongly agreed with the statement: ‘<strong>eating</strong> healthily<br />
is very important to me’. Healthy <strong>eating</strong> was also considered to be either ‘very<br />
important’ or ‘fairly important’ to 75% of adults in the LIDNS 2005. These data<br />
suggest that food, diet <strong>and</strong> <strong>healthy</strong> <strong>eating</strong> are considered to be important <strong>and</strong><br />
relevant by the majority of people, although it is likely that these data may be subject<br />
to response bias.<br />
The HSE 2007 asked adults to state how strongly they agreed with six statements<br />
relating to their <strong>attitudes</strong> to <strong>healthy</strong> <strong>eating</strong>. Multiple responses could be selected from<br />
a list of options. The results showed that there were differences in <strong>attitudes</strong> between<br />
men <strong>and</strong> women. Significantly higher proportions of women than men believed that<br />
‘<strong>healthy</strong> foods are enjoyable’ (80% <strong>and</strong> 66% respectively), <strong>and</strong> agreed that ‘I really<br />
care about what I eat’ (74% <strong>and</strong> 64% respectively). Conversely, a significantly higher<br />
proportion of men felt they ‘get confused over what’s supposed to be <strong>healthy</strong> <strong>and</strong><br />
what isn’t’ (30% of men <strong>and</strong> 24% of women) <strong>and</strong> believed ‘if you do enough exercise<br />
you can eat whatever you like’ (20% of men <strong>and</strong> 14% of women).<br />
The HSE 2007 also found that 37% of people believed that ‘the tastiest foods are the<br />
ones that are bad for you’, with those with a BMI over 25 significantly more likely to<br />
agree with this statement than those with a BMI within the <strong>healthy</strong> range. This<br />
finding suggests that presenting <strong>healthy</strong> foods as an enjoyable option may increase<br />
the likelihood of them being selected, particularly among those in the higher BMI<br />
categories.<br />
The TGI survey also asked questions about people’s <strong>attitudes</strong> <strong>towards</strong> <strong>healthy</strong> <strong>eating</strong>,<br />
the responses to which are shown in Appendix 3, Table 2. The data show that people<br />
who were underweight were significantly less likely to consider their diet to be very<br />
<strong>healthy</strong>, <strong>and</strong> people who were obese were significantly more likely to consider that<br />
they ‘should do a lot more about their health’ compared with the whole sample.<br />
iv. Confidence in changing diet<br />
The HSE 2007 asked respondents how easy or difficult they would find it to make<br />
improvements to the way they eat. The majority of respondents (56.3%) believed that<br />
making improvements to their diet would be very easy or quite easy. This response<br />
was unaffected by weight status.<br />
However, respondents who were obese or morbidly obese were significantly more<br />
likely to report that they would find it difficult to make changes to their diet than<br />
those with a <strong>healthy</strong> weight. This finding suggests that successfully identifying <strong>and</strong><br />
reducing barriers to change for these groups may have a positive impact on their diet.<br />
See Appendix 3, Table 3.<br />
v. Barriers to <strong>healthy</strong> <strong>eating</strong><br />
Both the HSE 2007 <strong>and</strong> the LIDNS 2005 asked questions about barriers to improving<br />
<strong>eating</strong> habits. The HSE provided a list of 11 options including the categories<br />
‘something else’ <strong>and</strong> ‘none of these’, from which respondents could choose all that<br />
applied. The most commonly reported barriers to <strong>healthy</strong> <strong>eating</strong> in the HSE 2007 were<br />
‘it’s hard to change my <strong>eating</strong> habits’ (29%), ‘I don’t have enough time’ (27%) <strong>and</strong> ‘it<br />
costs too much’ (20%).<br />
NOO | <strong>Knowledge</strong> <strong>and</strong> <strong>attitudes</strong> <strong>towards</strong> <strong>healthy</strong> <strong>eating</strong> <strong>and</strong> <strong>physical</strong> <strong>activity</strong>: what the data tell us 11
The LIDNS 2005 also asked respondents about barriers to making positive changes to<br />
their diet. The survey question provided a list of 21 options, from which respondents<br />
could choose all options that applied to them. The ten most frequently reported<br />
barriers are presented in Figure 5.<br />
Figure 5: Responses of adults to the question ‘What difficulties might you have with<br />
<strong>eating</strong> more healthily’<br />
Cooking skills<br />
I don't know enough about <strong>healthy</strong> <strong>eating</strong><br />
Experts keep changing their minds<br />
Busy lifestyle<br />
Taste preferences of household members<br />
I don't want to change my <strong>eating</strong> habits<br />
No difficulty trying to eat healthier<br />
Lack of will power<br />
I don't want to give up foods that I like<br />
Price of <strong>healthy</strong> foods<br />
Source LIDN, 2005<br />
0% 10% 20% 30% 40%<br />
There are common themes apparent across the LIDNS 2005 <strong>and</strong> TGI surveys <strong>and</strong>, in<br />
particular, personal preferences for certain foods <strong>and</strong> concerns about cost. Results<br />
from the LIDNS 2005 indicate that the cost of <strong>healthy</strong> food is a greater barrier for<br />
lower income households. However, care must be taken in making comparison<br />
between these surveys due to their different methodologies.<br />
The TGI survey asked respondents what prevented them from living a healthier<br />
lifestyle. The most frequently reported responses were:<br />
• time<br />
• I already live a <strong>healthy</strong> lifestyle<br />
• other health problems I have<br />
• cost<br />
• lack of will power<br />
All responses are shown in Figure 6.<br />
NOO | <strong>Knowledge</strong> <strong>and</strong> <strong>attitudes</strong> <strong>towards</strong> <strong>healthy</strong> <strong>eating</strong> <strong>and</strong> <strong>physical</strong> <strong>activity</strong>: what the data tell us 12
Figure 6: Responses of adults to the question ‘What, if anything, prevents you from<br />
living a healthier lifestyle’<br />
Eating habits/<strong>eating</strong> the wrong foods<br />
Family influence/what family will do<br />
Access to facilities/healthier choices<br />
Other responsibilities/caring/ child care<br />
Can't be bothered<br />
Lack of will power<br />
Cost<br />
Other health problems I have<br />
I already live a <strong>healthy</strong> lifestyle<br />
Time<br />
0% 5% 10% 15% 20% 25% 30% 35% 40%<br />
Source: TGI, 2008/09<br />
The TGI data showed significant differences across BMI categories (see Appendix 3,<br />
Table 4). Respondents who were obese or morbidly obese were significantly more<br />
likely to regard ‘other health problems I have’ as a barrier to a <strong>healthy</strong> lifestyle, <strong>and</strong><br />
were significantly less likely to believe that their lifestyle was already <strong>healthy</strong> than the<br />
total sample. Obese respondents were also more likely to report ‘lack of will power’<br />
<strong>and</strong> ‘can’t be bothered’ as barriers to a healthier lifestyle.<br />
vi. Facilitators of <strong>healthy</strong> <strong>eating</strong><br />
Both the HSE 2007 <strong>and</strong> the LIDNS 2005 asked questions to identify what factors could<br />
support individuals to eat more healthily. The HSE 2007 asked respondents to choose<br />
as many factors as applied from a list of 12 options, including the categories<br />
‘something else’ <strong>and</strong> ‘none of these’. The most frequently cited factors to were:<br />
• own ill health (48%)<br />
• being motivated (38%)<br />
• advice from a doctor or nurse (37%)<br />
The LIDNS 2005 asked people an open-response question about what factors would<br />
encourage them to change their diet. The most frequently cited factor was ‘more<br />
money/healthier food being less expensive’ (42%). See Figure 7 for the full results.<br />
NOO | <strong>Knowledge</strong> <strong>and</strong> <strong>attitudes</strong> <strong>towards</strong> <strong>healthy</strong> <strong>eating</strong> <strong>and</strong> <strong>physical</strong> <strong>activity</strong>: what the data tell us 13
Figure 7: Responses of adults to the questions ‘Are there things you would like to<br />
change about your current diet <strong>and</strong> if so, ‘What would help you to make that<br />
change’<br />
Better shops in the local area<br />
Other support/encouragement<br />
Motivation/enthusiasm<br />
Better health (including teeth)<br />
Family members <strong>eating</strong> healthier food<br />
More time for shopping <strong>and</strong> food preparation<br />
Better information about food/<strong>healthy</strong> <strong>eating</strong><br />
Other factors associated with attitude,skills, effort<br />
Will power/self‐discipline<br />
More money/healthier foood being less expensive<br />
0% 5% 10% 15% 20% 25% 30% 35% 40% 45%<br />
Source: LIDNS, 2005<br />
b. Perceptions of dieting <strong>and</strong> weight loss<br />
This section summarises available data relating to:<br />
• weight, weight loss <strong>and</strong> dieting<br />
• factors influencing <strong>eating</strong> habits<br />
Key points<br />
• Approximately 15% of adults report that they are trying to lose weight.<br />
• The <strong>eating</strong> habits of obese <strong>and</strong> morbidly obese individuals are more<br />
influenced by emotional triggers than people of a <strong>healthy</strong> weight.<br />
• The most frequently cited method of controlling weight is trying to eat less<br />
at meal times. However, those who are obese <strong>and</strong> morbidly obese are<br />
significantly less likely than other groups to report this.<br />
• Being depressed <strong>and</strong> boredom are the most frequently cited emotional<br />
triggers for <strong>eating</strong>.<br />
i. Weight, weight loss <strong>and</strong> dieting<br />
Both the BSAS 2008 <strong>and</strong> the LIDNS 2005 provide data about dieting <strong>and</strong> weight loss.<br />
The BSAS 2008 reported that 15% of respondents were trying to lose weight. In the<br />
LIDNS 2005, 8% of people stated that slimming was one of the most important<br />
influences on their food choices.<br />
NOO | <strong>Knowledge</strong> <strong>and</strong> <strong>attitudes</strong> <strong>towards</strong> <strong>healthy</strong> <strong>eating</strong> <strong>and</strong> <strong>physical</strong> <strong>activity</strong>: what the data tell us 14
The National Diet <strong>and</strong> Nutrition Survey 2000/01 (NDNS 2000/01) also asked questions<br />
about <strong>attitudes</strong> <strong>towards</strong> weight <strong>and</strong> weight loss, <strong>eating</strong> patterns <strong>and</strong> emotional<br />
triggers for <strong>eating</strong>. Respondents were asked which scenarios applied to them <strong>and</strong><br />
were given the options; ‘never’, ‘seldom’, ‘sometimes’, ‘often’ or ‘very often’. These<br />
data were analysed to identify significant differences in responses between the whole<br />
sample <strong>and</strong> the different BMI categories (‘underweight’, ‘<strong>healthy</strong> weight’,<br />
‘overweight’, ‘obese’ <strong>and</strong> ‘morbidly obese’), <strong>and</strong> significant differences between those<br />
of a <strong>healthy</strong> weight <strong>and</strong> the other BMI categories.<br />
Individuals who were obese or morbidly obese were significantly more likely than the<br />
whole sample, or those of a <strong>healthy</strong> weight, to say that they ‘try to eat less at meal<br />
times than (they) would like’ either ‘often’ or ‘very often’.<br />
Individuals who were categorised as overweight or obese (but not morbidly obese)<br />
were significantly more likely than the whole sample <strong>and</strong> those of a <strong>healthy</strong> weight to<br />
say they ‘deliberately eat foods that are slimming’, ‘try not to eat between meals<br />
because [they] are watching [their] weight’ or ‘try not to eat in the evening’ either<br />
‘often’ or ‘very often’.<br />
Overweight individuals (but not obese or morbidly obese individuals) were<br />
significantly more likely than the whole sample or those of a <strong>healthy</strong> weight to report<br />
that they ‘take [their] weight into account with what (they) eat’ either ‘often’ or ‘very<br />
often’. Individuals who were underweight or a <strong>healthy</strong> weight were significantly less<br />
likely than the whole sample to report that they ‘try not to eat between meals<br />
because [they] are watching [their] weight’ either ‘often’ or ‘very often’.<br />
ii Factors influencing <strong>eating</strong> habits<br />
Obese respondents from the NDNS 2000/01 were significantly less likely than <strong>healthy</strong><br />
weight respondents to say that they ‘could resist <strong>eating</strong> delicious food’ either ‘often’<br />
or ‘very often’. This group was also significantly more likely than the whole sample, or<br />
those of a <strong>healthy</strong> weight, to say that they have a desire to eat when:<br />
• they are irritated<br />
• they are depressed or discouraged<br />
• someone has let them down<br />
• they are worried, anxious or tense<br />
• things are going against them or have gone wrong<br />
• they are emotionally upset<br />
• they are bored<br />
• they are disappointed<br />
• they are lonely<br />
• they have nothing to do<br />
These data suggest that, compared with people of a <strong>healthy</strong> weight, the <strong>eating</strong> habits<br />
of obese <strong>and</strong> morbidly obese individuals are more influenced by emotional triggers.<br />
There were no significant differences in responses from individuals of a <strong>healthy</strong><br />
weight <strong>and</strong> other BMI categories for the questions:<br />
• If food smells <strong>and</strong> looks good, do you eat more than usual<br />
NOO | <strong>Knowledge</strong> <strong>and</strong> <strong>attitudes</strong> <strong>towards</strong> <strong>healthy</strong> <strong>eating</strong> <strong>and</strong> <strong>physical</strong> <strong>activity</strong>: what the data tell us 15
• If you see or smell something delicious, do you have a desire to eat it<br />
• If you have something delicious to eat, do you eat it straight away<br />
• If you walk past a bakery, do you have the desire to buy something<br />
delicious<br />
• If you see others <strong>eating</strong>, do you also want to eat<br />
• Do you eat more than usual when you see others <strong>eating</strong><br />
• When preparing a meal, are you inclined to eat something<br />
Underweight individuals, however, were significantly more likely than <strong>healthy</strong> weight<br />
individuals to state that they ‘have the desire to buy something delicious if [they] walk<br />
past a snack bar or cafe’ either ‘often’ or ‘very often’. This suggests that emotions<br />
tend to trigger a desire to eat more than sensory stimulus, regardless of an individual’s<br />
BMI status.<br />
c. <strong>Knowledge</strong>, beliefs <strong>and</strong> self-perceptions relating to <strong>physical</strong> <strong>activity</strong><br />
This section summarises available data relating to:<br />
• knowledge of recommended levels of <strong>physical</strong> <strong>activity</strong><br />
• perceptions of <strong>physical</strong> <strong>activity</strong> facilities<br />
• appraisal of own participation in <strong>physical</strong> <strong>activity</strong><br />
• barriers <strong>and</strong> facilitators to participating in <strong>physical</strong> <strong>activity</strong><br />
Key points<br />
• The majority of adults are aware that <strong>physical</strong> <strong>activity</strong> recommendations<br />
exist, but few know what they are.<br />
• 71% of adults consider themselves to be fairly or very <strong>physical</strong>ly active.<br />
• Morbidly obese adults are significantly less likely to consider themselves to<br />
be very <strong>physical</strong>ly active than those who are a <strong>healthy</strong> weight.<br />
• The most frequently cited reasons for taking part in <strong>physical</strong> <strong>activity</strong> are to<br />
maintain health <strong>and</strong> feel fit.<br />
• The majority of adults would like to take part in more <strong>physical</strong> <strong>activity</strong> than<br />
they do currently.<br />
• The most commonly cited <strong>activity</strong> that adults would like to do more of is<br />
swimming.<br />
• Time pressures <strong>and</strong> lack of motivation are the most commonly cited barriers<br />
to participating in <strong>physical</strong> <strong>activity</strong>.<br />
i. <strong>Knowledge</strong> of recommended levels of <strong>physical</strong> <strong>activity</strong><br />
The HSE 2007 asked participants if they were aware of the recommended levels of<br />
<strong>physical</strong> <strong>activity</strong>. Three options were provided from which respondents could choose<br />
one, <strong>and</strong> 27.5% of adults said they knew what the recommended levels of <strong>activity</strong><br />
were (see Appendix 3, Table 5). When asked what levels of <strong>physical</strong> <strong>activity</strong> adults of<br />
their age should take part in, only 6% of men <strong>and</strong> 9% of women thought people their<br />
age should do 30 minutes of <strong>physical</strong> <strong>activity</strong> at least five days of the week (equivalent<br />
NOO | <strong>Knowledge</strong> <strong>and</strong> <strong>attitudes</strong> <strong>towards</strong> <strong>healthy</strong> <strong>eating</strong> <strong>and</strong> <strong>physical</strong> <strong>activity</strong>: what the data tell us 16
to the recommended levels of <strong>activity</strong> when the HSE 2007 survey was undertaken). A<br />
further 24% of adults specified that a higher level of <strong>physical</strong> <strong>activity</strong> than this should<br />
be undertaken.<br />
ii. Perceptions of <strong>physical</strong> <strong>activity</strong> facilities<br />
The Active People Survey 2008 (APS 2008) asked how satisfied participants were with<br />
sports facilities in their local area. Almost 60% said they were ‘fairly’ or ‘very satisfied’,<br />
whilst fewer than 15% felt ‘fairly’ or ‘very dissatisfied’. Figure 8 shows the range of<br />
responses.<br />
Figure 8: Responses of adults to the question ‘How satisfied are you with sports<br />
provision in your local area’<br />
45%<br />
40%<br />
35%<br />
30%<br />
25%<br />
20%<br />
15%<br />
10%<br />
5%<br />
0%<br />
Very<br />
dissatisfied<br />
Fairly<br />
dissatisfied<br />
Neither satisfied or<br />
dissatisfied<br />
Fairly<br />
satisfied<br />
Very<br />
satisfied<br />
No opinion/not<br />
stated<br />
Source: APS, 2008<br />
The Place Survey provides some information about access to sports facilities, parks <strong>and</strong><br />
open spaces. The data shows that the majority of respondents had used such facilities<br />
in the previous six months or year, with more respondents using parks <strong>and</strong> open<br />
spaces than sports facilities (see Appendix 3, Table 6). There is no data available about<br />
frequency of use.<br />
iii. Appraisal of own participation in <strong>physical</strong> <strong>activity</strong><br />
The HSE 2007 asked participants how <strong>physical</strong>ly active they considered themselves to<br />
be compared to others of their own age. a Whilst the majority of adults (71%)<br />
considered themselves to be ‘fairly’ or ‘very’ <strong>physical</strong>ly active, the results varied<br />
according to gender <strong>and</strong> BMI. Respondents who were obese or morbidly obese were<br />
significantly more likely than those of a <strong>healthy</strong> weight to say they were either ‘not<br />
very’ or ‘not at all’ <strong>physical</strong>ly active (see Appendix 3, Table 7). Participants were also<br />
a<br />
‘Physical <strong>activity</strong>’ was defined as: ‘A wide range of activities involving movement including housework such as<br />
vacuuming <strong>and</strong> digging the garden, active hobbies, walking <strong>and</strong> cycling, dancing, exercise such as swimming or going to<br />
the gym, <strong>and</strong> sport. It includes movement done as part of a job such as walking, lifting <strong>and</strong> carrying’.<br />
NOO | <strong>Knowledge</strong> <strong>and</strong> <strong>attitudes</strong> <strong>towards</strong> <strong>healthy</strong> <strong>eating</strong> <strong>and</strong> <strong>physical</strong> <strong>activity</strong>: what the data tell us 17
asked why they chose to take part in <strong>physical</strong> <strong>activity</strong>. The most commonly cited<br />
reasons were:<br />
• to maintain good health (61%)<br />
• to get or feel fit (52%)<br />
• to be outdoors (48%)<br />
• to lose or maintain weight (47%)<br />
The APS 2008 found that 51% of adults would like to do more sport <strong>and</strong> recreational<br />
<strong>physical</strong> <strong>activity</strong>, with swimming the most preferred sport (7%) followed by cycling<br />
(2.5%). The HSE 2007 had found that 67% of respondents would like to take part in<br />
more <strong>physical</strong> <strong>activity</strong> than they currently do.<br />
The APS 2008 also indicated how participation in <strong>physical</strong> <strong>activity</strong> changed over the<br />
course of a year. More than half of respondents (55%) reported doing about the same<br />
level of <strong>physical</strong> <strong>activity</strong> compared to the previous year; a quarter doing less than a<br />
year ago; <strong>and</strong> almost a fifth (19%) doing more. The results are shown in Figure 9.<br />
Figure 9: Responses of adults to the question ‘Do you generally do more, less or the<br />
same amount of sport <strong>and</strong> recreational <strong>physical</strong> <strong>activity</strong> as you did this time last year’<br />
60%<br />
50%<br />
40%<br />
30%<br />
20%<br />
10%<br />
0%<br />
Same Less More<br />
Source: APS, 2008<br />
iv. Barriers <strong>and</strong> facilitators to participating in <strong>physical</strong> <strong>activity</strong><br />
The HSE 2007 investigated perceived barriers to <strong>physical</strong> <strong>activity</strong> <strong>and</strong> the factors that<br />
would motivate participants to be more <strong>physical</strong>ly active. Participants were asked<br />
what prevents them from doing more <strong>physical</strong> <strong>activity</strong>, exercise or sport <strong>and</strong> provided<br />
with a list of practical barriers from which they could give multiple responses. The<br />
most frequently cited practical barriers were:<br />
• work commitments (38%)<br />
• lack of leisure time (37%)<br />
NOO | <strong>Knowledge</strong> <strong>and</strong> <strong>attitudes</strong> <strong>towards</strong> <strong>healthy</strong> <strong>eating</strong> <strong>and</strong> <strong>physical</strong> <strong>activity</strong>: what the data tell us 18
• caring for children or older people (21%)<br />
• not having enough money (14%)<br />
Men were more likely to indicate work commitments as a barrier (45% compared with<br />
33% of women), whilst women were more likely to indicate caring for children or<br />
older people (27% of women compared with 14% of men). 15% of respondents did<br />
not feel the need to do more <strong>physical</strong> <strong>activity</strong>.<br />
Participants were then asked what other factors prevent them from doing more<br />
<strong>physical</strong> <strong>activity</strong>, exercise or sport <strong>and</strong> were provided with a list of emotional <strong>and</strong><br />
psychological barriers from which they could give multiple responses. ‘Lack of<br />
motivation’ was cited most frequently (29%), followed by not being the ‘sporty type’<br />
<strong>and</strong> ‘having other things to do’. They were also asked what would encourage them to<br />
take part in more <strong>physical</strong> <strong>activity</strong> <strong>and</strong> the most commonly cited factors were:<br />
• more leisure time (49%)<br />
• increased motivation (40%)<br />
• own ill health (36%)<br />
• advice from a doctor or nurse (29%)<br />
NOO | <strong>Knowledge</strong> <strong>and</strong> <strong>attitudes</strong> <strong>towards</strong> <strong>healthy</strong> <strong>eating</strong> <strong>and</strong> <strong>physical</strong> <strong>activity</strong>: what the data tell us 19
Section two: children <strong>and</strong> young people<br />
This section refers to data on children <strong>and</strong> young people. There are fewer sources of<br />
data available relating to children than adults. A range of age groups was sampled by<br />
the different surveys, <strong>and</strong> this may impact on responses.<br />
a. <strong>Knowledge</strong>, beliefs <strong>and</strong> self-perceptions relating to diet<br />
This section summarises available data relating to:<br />
• children <strong>and</strong> young people’s knowledge <strong>and</strong> underst<strong>and</strong>ing of what<br />
constitutes a <strong>healthy</strong> diet <strong>and</strong> appraisal of their own diet<br />
• factors influencing <strong>healthy</strong> <strong>eating</strong> in school<br />
Key points<br />
• The majority of children <strong>and</strong> young people consider their diet to be<br />
<strong>healthy</strong>.<br />
• When asked whether or not they have a <strong>healthy</strong> diet, children <strong>and</strong> young<br />
people tend to base their answer on their fruit <strong>and</strong> vegetable consumption.<br />
• 76% of children in school years 6, 8 <strong>and</strong> 10 say the information available to<br />
them about <strong>healthy</strong> <strong>eating</strong> is good enough.<br />
i. <strong>Knowledge</strong> <strong>and</strong> underst<strong>and</strong>ing of what constitutes a <strong>healthy</strong> diet<br />
The Sodexho School Meals <strong>and</strong> Lifestyles Survey 2005 b asked a sample of children <strong>and</strong><br />
young people aged 5 to 7 years <strong>and</strong> 8 to 16 years how <strong>healthy</strong> they believe their diets<br />
to be. The majority thought that their diet was ‘quite <strong>healthy</strong>’ (56% of 5 to 7 year olds;<br />
54% of 8 to 16 year olds) or ‘very <strong>healthy</strong>’ (18% of 5 to 7 year olds; 16% of 8 to 16 year<br />
olds). In contrast, only 1% of 5 to 7 year olds <strong>and</strong> 2% of 8 to 16 year olds thought that<br />
their diets were ‘not at all <strong>healthy</strong>’. The largest difference between the age groups<br />
was seen in those who said their diets were ‘not very <strong>healthy</strong>’ (6% of 5 to 7 year olds<br />
<strong>and</strong> 18% of 8 to 16 year olds). These results are shown in Figure 10.<br />
b The data reported here are from the Sodexho report on the survey, where the number of respondents is not provided.<br />
Therefore it was not possible to calculate confidence intervals.<br />
NOO | <strong>Knowledge</strong> <strong>and</strong> <strong>attitudes</strong> <strong>towards</strong> <strong>healthy</strong> <strong>eating</strong> <strong>and</strong> <strong>physical</strong> <strong>activity</strong>: what the data tell us 20
Figure 10: Responses of children <strong>and</strong> young people to the question ‘How <strong>healthy</strong> do<br />
you think your diet is’<br />
60%<br />
50%<br />
5‐7 years 8‐16 years<br />
40%<br />
30%<br />
20%<br />
10%<br />
0%<br />
Very <strong>healthy</strong> Quite <strong>healthy</strong> Not very <strong>healthy</strong> Not at all <strong>healthy</strong><br />
Source: Sodexho School Meals <strong>and</strong> Lifestyle Survey, 2005 ii<br />
The children <strong>and</strong> young people who described their diet as either ‘very <strong>healthy</strong>’ or<br />
‘quite <strong>healthy</strong>’, were asked to explain their answer. They could give multiple answers<br />
from a list of 12 options. The most frequently cited answers were:<br />
• I eat a lot of fruit (63% of 5 to 7 year olds <strong>and</strong> 52% of 8 to 16 year olds)<br />
• I eat a lot of vegetables (46% of both age groups)<br />
• I eat a good balanced diet (16% of 5 to 7 year olds, 24% of 8 to 16 year<br />
olds)<br />
Only 12% of 5 to 7 year olds <strong>and</strong> 13% of 8 to 16 year olds selected <strong>eating</strong> low-fat<br />
foods, low-salt foods or <strong>eating</strong> less red meat. A small proportion of 5 to 7 year olds<br />
(3%) <strong>and</strong> 8 to 16 year olds (6%) said their diet was <strong>healthy</strong> because they ‘don’t eat<br />
sweets/chocolate’. The results are shown in Figure 11.<br />
NOO | <strong>Knowledge</strong> <strong>and</strong> <strong>attitudes</strong> <strong>towards</strong> <strong>healthy</strong> <strong>eating</strong> <strong>and</strong> <strong>physical</strong> <strong>activity</strong>: what the data tell us 21
Figure 11: Responses of children <strong>and</strong> young people to the question ‘Why do you<br />
think that your diet is very <strong>healthy</strong>/quite <strong>healthy</strong>’<br />
I eat low fat foods<br />
8‐16 years<br />
I don’t eat sweets/chocolates<br />
5‐7 years<br />
I don’t eat junk foods<br />
I eat salads<br />
I eat a variety of foods<br />
I eat good food<br />
I drink lots of water/juice<br />
I eat a good balanced diet<br />
I eat lots of vegetables<br />
I eat lots of fruit<br />
0% 10% 20% 30% 40% 50% 60% 70%<br />
Source: Sodexho School Meals <strong>and</strong> Lifestyle Survey, 2005 ii<br />
Further relevant data are available from the Tell Us 3 Survey 2008. It asked children<br />
<strong>and</strong> young people aged 10 to 16 (in school years 6, 8 <strong>and</strong> 10) for their views on the<br />
quality of information provided to them in school on <strong>healthy</strong> foods <strong>and</strong> lifestyles:<br />
• 76% said they thought the information <strong>and</strong> advice was ‘good enough’<br />
• 20% said they ‘needed better information <strong>and</strong> advice’<br />
• 4% ‘didn’t know’<br />
ii. Factors influencing <strong>healthy</strong> <strong>eating</strong> in school<br />
The Sodexho School Meals <strong>and</strong> Lifestyles Survey 2005 asked children <strong>and</strong> young<br />
people aged 8 to 16 what factors might help them to make healthier food choices at<br />
school. They identified practical incentives that would help them to make healthier<br />
food choices <strong>and</strong> were able to select more than one option from a list of ten, making<br />
it difficult to show true preferences. The most popular choices were the opportunity<br />
to win prizes, less queuing time for <strong>healthy</strong> dishes <strong>and</strong> better choices of <strong>healthy</strong><br />
dishes. The responses to this question are shown in Figure 12.<br />
NOO | <strong>Knowledge</strong> <strong>and</strong> <strong>attitudes</strong> <strong>towards</strong> <strong>healthy</strong> <strong>eating</strong> <strong>and</strong> <strong>physical</strong> <strong>activity</strong>: what the data tell us 22
Figure 12: Responses of children <strong>and</strong> young people aged 8–16 years to the question<br />
‘What would help you to make healthier choices at school’<br />
Improved decoration <strong>and</strong> better s<strong>eating</strong><br />
Having more <strong>healthy</strong> items in the tuck shop/mid‐morning break<br />
Having vending machine service for <strong>healthy</strong> food<br />
Special days when you can sample <strong>healthy</strong> dishes<br />
Help yourself salad bar at lunchtime<br />
Wider range of prepared fruit available<br />
Cheaper prices for <strong>healthy</strong> options<br />
Better choice of <strong>healthy</strong> dishes<br />
Less queuing time for <strong>healthy</strong> dishes<br />
Opportunity to win prizes if you select <strong>healthy</strong> items<br />
Source: Sodexho School Meals <strong>and</strong> Lifestyle Survey, 2005 ii<br />
0% 10% 20% 30% 40%<br />
b. Perceptions of weight, weight loss <strong>and</strong> dieting<br />
This section summarises available data relating to children <strong>and</strong> young people’s<br />
perceptions of weight, weight loss <strong>and</strong> dieting.<br />
Key points<br />
• The majority of children <strong>and</strong> young people (73%) consider themselves to be<br />
about the right weight.<br />
• The majority of children <strong>and</strong> young people classified by the HSE 2007 as<br />
overweight (77.3%) consider themselves to be about the right weight as do<br />
46.3% of children classified as obese.<br />
• 65% of children <strong>and</strong> young people classified as obese are trying to lose<br />
weight.<br />
i. Weight, weight loss <strong>and</strong> dieting<br />
The HSE 2007 provided information on children <strong>and</strong> young people’s perception of<br />
their own body weight <strong>and</strong> whether they were actively trying to lose weight. The<br />
majority (73%) aged 8 to 15 years felt that they were ‘about the right weight’, 16%<br />
‘too heavy’ <strong>and</strong> 10% ‘too light’. These data were compared with the BMI category<br />
assigned to them (calculated from the anthropometrics recorded by nurses as part of<br />
the survey). The results show that 77.3% of those categorised as ‘overweight’ stated<br />
that they thought they were ‘about the right weight’ as did 46.3% of those<br />
NOO | <strong>Knowledge</strong> <strong>and</strong> <strong>attitudes</strong> <strong>towards</strong> <strong>healthy</strong> <strong>eating</strong> <strong>and</strong> <strong>physical</strong> <strong>activity</strong>: what the data tell us 23
categorised as obese. c There was no category in the dataset for underweight children<br />
<strong>and</strong> young people, so it is likely that the sample of normal weight children <strong>and</strong> young<br />
people also included some who were underweight (See Appendix 3, Table 8).<br />
Of the same sample, 67.1% reported that they were not trying to change their<br />
weight; 26% were trying to lose weight; <strong>and</strong> 6.9% were trying to gain weight.<br />
Analysis of these data by BMI category indicates that, amongst children <strong>and</strong> young<br />
people classified as obese, 65.1% reported that they were ‘trying to lose weight’,<br />
whilst 34.3% were ‘not trying to lose weight’ (see Appendix 3, Table 9). Interestingly,<br />
77.3% of those classified as overweight said they are ‘about the right weight’ <strong>and</strong><br />
60.5% were ‘not trying to change weight’. These findings indicate a potential area for<br />
intervention to ensure that this group do not become obese <strong>and</strong> do take action to<br />
become a <strong>healthy</strong> weight.<br />
c. <strong>Knowledge</strong>, beliefs <strong>and</strong> self-perceptions relating to <strong>physical</strong> <strong>activity</strong><br />
This section summarises available data relating to:<br />
• knowledge of the recommended levels of <strong>physical</strong> <strong>activity</strong><br />
• perceptions about local <strong>physical</strong> <strong>activity</strong> facilities<br />
• appraisal of own <strong>physical</strong> <strong>activity</strong> participation<br />
Key points<br />
• 32% of children <strong>and</strong> young people age 11–15 believe that people their own<br />
age should take part in <strong>physical</strong> <strong>activity</strong> every day of the week.<br />
• 37% of children <strong>and</strong> young people age 11–15 believe that people their own<br />
age should exercise for 60 minutes for it to be good for their health.<br />
• The most popular location for <strong>physical</strong> <strong>activity</strong> that children <strong>and</strong> young<br />
people in school years 6, 8 <strong>and</strong> 10 would like to visit which they do not<br />
already visit, is a gym.<br />
• Approximately half of children <strong>and</strong> young people in school years 6, 8 <strong>and</strong><br />
10 (aged 10 to 16) are satisfied with the <strong>physical</strong> <strong>activity</strong> facilities in their<br />
area.<br />
i. <strong>Knowledge</strong> of recommended levels of <strong>physical</strong> <strong>activity</strong><br />
The Chief Medical Officer advises that children <strong>and</strong> young people should participate in<br />
a minimum of 60 minutes of at least moderate intensity <strong>physical</strong> <strong>activity</strong> each day.<br />
The HSE 2007 found that 32% of children <strong>and</strong> young people age 11–15 believed that<br />
people their own age should take part in <strong>physical</strong> <strong>activity</strong> every day of the week <strong>and</strong><br />
that 37% believed that people their own age should exercise for 60 minutes for it to<br />
be good for their health. 11% of children <strong>and</strong> young people in this age group also<br />
believed both that young people should do <strong>physical</strong> <strong>activity</strong> seven days a week <strong>and</strong><br />
that they should do it for 60 minutes to be good for their health.<br />
c The BMI categories used were those assigned by the Information Centre, contained in the raw dataset. Following the<br />
publication of the 2007 data, the Information Centre issued an errata note relating to their methodology for assigning<br />
overweight <strong>and</strong> obese categories to children. However, these data have been used in this analysis on the basis that this<br />
misclassification affected a small number of children <strong>and</strong> no cases were significantly different from the published data.<br />
NOO | <strong>Knowledge</strong> <strong>and</strong> <strong>attitudes</strong> <strong>towards</strong> <strong>healthy</strong> <strong>eating</strong> <strong>and</strong> <strong>physical</strong> <strong>activity</strong>: what the data tell us 24
ii. Perceptions of <strong>physical</strong> <strong>activity</strong> facilities<br />
Data from the Tell Us 3 survey 2008 reveals children <strong>and</strong> young people’s perceptions<br />
of the facilities in their local area:<br />
• 49% thought they were either ‘very good’ or ‘fairly good’<br />
• 22% thought that they were ‘neither good nor poor’<br />
• 26% thought they were either ‘poor’ or ’very poor’<br />
The Tell Us 3 Survey 2008 asked children <strong>and</strong> young people what facilities they would<br />
like to go to (but had not already been to) to take part in <strong>physical</strong> activities. The most<br />
popular choices were the gym (38%) followed by swimming pools (29%) <strong>and</strong> a sports<br />
club or class (20%).<br />
iii. Appraisal of own participation in <strong>physical</strong> <strong>activity</strong><br />
The HSE 2007 asked children <strong>and</strong> young people how active they would describe<br />
themselves to be compared with children of their own age. The majority of girls (85%)<br />
<strong>and</strong> boys (90%) aged 11–15 considered themselves to be fairly or very <strong>physical</strong>ly active.<br />
This is particularly important as there is some evidence that young people’s <strong>attitudes</strong><br />
<strong>towards</strong> <strong>physical</strong> <strong>activity</strong> by the time they have completed secondary school is<br />
predictive of their <strong>physical</strong> <strong>activity</strong> levels as adults (see Appendix 3, Table 10). 9<br />
Discussion <strong>and</strong> conclusions<br />
The data show that diet, <strong>healthy</strong> <strong>eating</strong> <strong>and</strong> <strong>physical</strong> <strong>activity</strong> are important issues to<br />
people. Most people have an underst<strong>and</strong>ing of what constitutes a <strong>healthy</strong> diet <strong>and</strong><br />
the majority of adults would like to improve their own <strong>eating</strong> habits <strong>and</strong> those of<br />
their children. Most children <strong>and</strong> young people consider themselves to be about the<br />
right weight <strong>and</strong> their diet to be <strong>healthy</strong>.<br />
People who are obese appear to experience particular difficulties in translating<br />
knowledge of <strong>healthy</strong> behaviour into practice. Whilst they are more interested in<br />
making <strong>healthy</strong> changes to their diet, they are also more likely to consider this<br />
difficult to achieve. In addition, they generally express a preference for less <strong>healthy</strong><br />
foods <strong>and</strong> are less likely to consider themselves to be <strong>physical</strong>ly active.<br />
Health is highly prioritised as a motivating factor for both <strong>healthy</strong> <strong>eating</strong> <strong>and</strong> <strong>physical</strong><br />
<strong>activity</strong>. However, a dislike of <strong>healthy</strong> foods by individuals <strong>and</strong> their families, the<br />
higher costs of these foods <strong>and</strong> a lack of willpower may prevent them from <strong>eating</strong><br />
healthily. Similarly, time pressures <strong>and</strong> a lack of motivation may prevent people from<br />
taking part in <strong>physical</strong> <strong>activity</strong>.<br />
It is important to underst<strong>and</strong> people’s <strong>attitudes</strong> <strong>and</strong> beliefs in order to plan targeted<br />
<strong>and</strong> appropriate interventions. For example, analysis of the LIDNS 2005 data suggests<br />
that promoting ways of making <strong>healthy</strong> meals quickly <strong>and</strong> cheaply is likely to be most<br />
effective among low-income groups as this would address the main barriers identified.<br />
Another study, which investigated people’s <strong>attitudes</strong>, concluded that motivation to<br />
participate in <strong>physical</strong> <strong>activity</strong> is correlated with perceptions of local surroundings. 10<br />
People are less motivated to be <strong>physical</strong>ly active if they perceive their local<br />
surroundings to be unsafe or unpleasant.<br />
This is a complex area of work in which much more research is needed to really<br />
underst<strong>and</strong> how individuals can be motivated to make changes to their behaviour<br />
NOO | <strong>Knowledge</strong> <strong>and</strong> <strong>attitudes</strong> <strong>towards</strong> <strong>healthy</strong> <strong>eating</strong> <strong>and</strong> <strong>physical</strong> <strong>activity</strong>: what the data tell us 25
that will improve their health. It is clear that knowledge of <strong>and</strong> <strong>attitudes</strong> <strong>towards</strong><br />
<strong>healthy</strong> <strong>eating</strong> <strong>and</strong> <strong>physical</strong> <strong>activity</strong> are significant determinants of <strong>eating</strong> <strong>and</strong> <strong>activity</strong><br />
behaviour. <strong>Knowledge</strong> <strong>and</strong> <strong>attitudes</strong> ultimately impact on weight status, <strong>and</strong> may be<br />
central to the success of behaviour change interventions. The data also suggests that<br />
there are significant differences in barriers <strong>and</strong> motivators between those who are<br />
obese <strong>and</strong> those who are not.<br />
There are a number of national data sources that provide useful, population level<br />
information about personal <strong>and</strong> social correlates of <strong>healthy</strong> <strong>eating</strong> <strong>and</strong> <strong>physical</strong><br />
<strong>activity</strong>. Further analyses of the data, particularly from the HSE 2007, to investigate<br />
differences between reported dietary intake <strong>and</strong> <strong>physical</strong> <strong>activity</strong> levels of respondents<br />
against their <strong>attitudes</strong>, knowledge <strong>and</strong> perceptions of their own diet <strong>and</strong> <strong>physical</strong><br />
<strong>activity</strong> levels would yield further useful insights.<br />
The National Institute for Health <strong>and</strong> Clinical Excellence (NICE) has produced guidance<br />
for behaviour change interventions. 11 This guidance supports the conclusions in the<br />
review <strong>and</strong> advocates a holistic approach that takes into account individual needs. The<br />
guidance describes a stepped approach to building behaviour change interventions<br />
including planning <strong>and</strong> design, delivery <strong>and</strong> evaluation. It discusses how interventions<br />
may be tailored to specific populations.<br />
NOO | <strong>Knowledge</strong> <strong>and</strong> <strong>attitudes</strong> <strong>towards</strong> <strong>healthy</strong> <strong>eating</strong> <strong>and</strong> <strong>physical</strong> <strong>activity</strong>: what the data tell us 26
Appendix 1: glossary of terms<br />
Attitude The way a person responds to people, concepts <strong>and</strong> events in an evaluative<br />
way.<br />
Behaviour The actions by which an individual adjusts to their environment.<br />
Belief Confidence or trust in a given opinion in the absence of rigorous proof.<br />
Body Mass Index (BMI) A measure of body mass calculated by dividing weight in<br />
kilograms by height in metres squared. The recognised categories for BMI are:<br />
BMI less than 18.5 – underweight<br />
BMI 18.6 – 24.9 – <strong>healthy</strong> weight<br />
BMI 25 – 29.9 – overweight<br />
BMI 30 – 39.9 – obese<br />
BMI 40 or more – morbidly obese<br />
Cognitive therapy A type of psychotherapeutic treatment that attempts to change<br />
feelings <strong>and</strong> behaviours by changing the way a person thinks about or perceives<br />
significant life experiences.<br />
Determinant A factor or circumstance that affects an outcome or behaviour.<br />
Emotion A complex pattern of changes, including physiological arousal, feelings,<br />
cognitive processes <strong>and</strong> behavioural reactions, made in response to a situation<br />
perceived to be personally significant.<br />
Incentives External stimuli or rewards that motivate behaviour.<br />
Motivation The process of starting, directing <strong>and</strong> maintaining <strong>physical</strong> <strong>and</strong><br />
psychological activities. This includes mechanisms involved in preferences for one<br />
<strong>activity</strong> over another <strong>and</strong> the vigour <strong>and</strong> persistence of responses.<br />
Non-response bias Where results of a survey may be affected by particular groups of<br />
individuals choosing not to answer specific questions.<br />
Opinion A personal view, attitude or appraisal.<br />
Perception The process by which a person detects <strong>and</strong> interprets external stimuli.<br />
Response bias Where results of a survey may be affected by individuals, who are<br />
interested in the subject matter, being more likely to consent to take part.<br />
Sample bias Where the results of a survey may be affected by the use of a sample<br />
that is not representative of the population of concern.<br />
Self-efficacy The set of beliefs that one can perform adequately in a particular<br />
situation.<br />
NOO | <strong>Knowledge</strong> <strong>and</strong> <strong>attitudes</strong> <strong>towards</strong> <strong>healthy</strong> <strong>eating</strong> <strong>and</strong> <strong>physical</strong> <strong>activity</strong>: what the data tell us 27
Self-esteem A generalised evaluative attitude toward the self that influences both<br />
moods <strong>and</strong> behaviour <strong>and</strong> that exerts a powerful effect on a range of personal <strong>and</strong><br />
social behaviours.<br />
Skill The ability to carry out a task effectively.<br />
Value An ideal or custom which is considered important.<br />
NOO | <strong>Knowledge</strong> <strong>and</strong> <strong>attitudes</strong> <strong>towards</strong> <strong>healthy</strong> <strong>eating</strong> <strong>and</strong> <strong>physical</strong> <strong>activity</strong>: what the data tell us 28
Appendix 2: summary of data sources <strong>and</strong> availability<br />
Health Survey for Engl<strong>and</strong> 12<br />
The Health Survey for Engl<strong>and</strong> (HSE) is an annual survey designed to measure health<br />
<strong>and</strong> health-related behaviours in adults <strong>and</strong> children living in private households in<br />
Engl<strong>and</strong>. It has been undertaken since 1991. In recent years, sample sizes have typically<br />
been around 16,000. The survey consists of an interview <strong>and</strong> a nurse visit for a<br />
subsample. The HSE sample size is currently not sufficiently robust to enable analyses<br />
of data at geographical boundaries smaller than strategic health authority level.<br />
The HSE is modular but has a number of core elements which are included each year.<br />
Since 2001 these have included a number of dietary recall questions relating to fruit<br />
<strong>and</strong> vegetable consumption in the last 24 hours. The HSE 2007 had a focus on <strong>healthy</strong><br />
lifestyles: knowledge, <strong>attitudes</strong> <strong>and</strong> behaviour. The total sample size for the 2007<br />
survey was 14,386 of which 7,504 were children aged 0-15 due to a boost sample. 2007<br />
is the only year in which specific questions relating to <strong>attitudes</strong> <strong>towards</strong> <strong>healthy</strong> <strong>eating</strong><br />
<strong>and</strong> <strong>physical</strong> <strong>activity</strong> have been asked, meaning that this data source is of limited use<br />
in terms of surveillance of <strong>attitudes</strong> over time.<br />
Raw data from the HSE 2007 has been accessed from the UK data archive at individual<br />
level. Information presented in this paper is, therefore, based on crude rates with no<br />
weightings applied.<br />
Active People Survey 13<br />
The Active People Survey (APS) is conducted by Sport Engl<strong>and</strong> <strong>and</strong> aims to measure<br />
variance in adult participation in sport <strong>and</strong> <strong>physical</strong> <strong>activity</strong>. It also includes questions<br />
relating to what people feel about the amount of exercise they do <strong>and</strong> what they<br />
think of sports facilities in their area.<br />
The first APS was conducted between October 2005 <strong>and</strong> October 2006 <strong>and</strong><br />
interviewed 363,724 people across Engl<strong>and</strong> by telephone (approximately 1,000 in each<br />
local authority).<br />
The APS has been running annually. However, the total sample size has been halved<br />
to 500 per local authority (180,000 in total) with an opportunity for local authorities<br />
to fund boost samples for their own areas. This opportunity was taken up by 14 local<br />
authorities in the 2007/08 survey.<br />
Raw data from the APS 2008 has been accessed from the UK data archive at individual<br />
level. Information presented in this paper is, therefore, based on crude rates with no<br />
weightings applied.<br />
The Place Survey 14<br />
The Place Survey was conducted between September <strong>and</strong> December 2008 <strong>and</strong><br />
explored people’s <strong>attitudes</strong> <strong>towards</strong> their local area, including access to health services<br />
<strong>and</strong> sports facilities. The questionnaires contained the same core questions nationally,<br />
although local authorities were able to add further questions from a central bank for<br />
use in their own locality. The Place Survey must be conducted by every local authority<br />
bi-annually, although individual local authorities may undertake it on an annual basis<br />
if they choose.<br />
NOO | <strong>Knowledge</strong> <strong>and</strong> <strong>attitudes</strong> <strong>towards</strong> <strong>healthy</strong> <strong>eating</strong> <strong>and</strong> <strong>physical</strong> <strong>activity</strong>: what the data tell us 29
The Place Survey was completed by a sample of 543,713 nationally, although sample<br />
sizes varied between local authorities. Measures were put in place to protect the<br />
quality of the data due to the surveys being carried out by local authorities<br />
independently, including guidance on sampling method <strong>and</strong> the use of an appropriate<br />
sampling frame. In addition, results were submitted centrally using st<strong>and</strong>ardised tools.<br />
Data from the Place Survey 2008 is taken from the further findings report published<br />
by the Audit Commission as no raw data was available for this dataset.<br />
Tell Us Survey 15<br />
Tell Us is a series of annual online surveys to gather quantitative information on the<br />
views <strong>and</strong> experiences of children <strong>and</strong> young people. It is commissioned by The Office<br />
for St<strong>and</strong>ards in Education, Children's Services <strong>and</strong> Skills (Ofsted) <strong>and</strong> the Department<br />
of Children, Schools <strong>and</strong> Families, <strong>and</strong> is carried out by Ipsos MORI. The surveys have<br />
been running since 2006 <strong>and</strong> are intended to provide evidence for the national<br />
indicators for local authorities <strong>and</strong> local authority partnerships. The survey aims to<br />
help local authorities judge the impact of their services on perceived quality of life for<br />
children <strong>and</strong> young people. Tell Us asks children <strong>and</strong> young people questions relating<br />
to the five Every Child Matters outcomes which include <strong>healthy</strong> <strong>eating</strong>. Children are<br />
asked attitude questions on their perceptions of the information <strong>and</strong> advice they get<br />
on <strong>eating</strong> <strong>healthy</strong> food.<br />
Tell Us is completed by a sample of children in all local authority areas across Engl<strong>and</strong>.<br />
Pupils complete questionnaires online via a dedicated website. The sample size is<br />
calculated with a view to obtaining a sufficient number of responses to allow robust<br />
analysis at local area level. Sampling mechanisms take account of different types <strong>and</strong><br />
sizes of schools together with socio-economic factors. The sample includes maintained<br />
schools, pupil referral units, academies <strong>and</strong> city technology colleges. Data are collected<br />
at school level, <strong>and</strong> aggregated up to local authority level.<br />
Data from Tell Us 3 is taken from the report published by Ofsted as no raw data were<br />
available for this dataset.<br />
Food St<strong>and</strong>ards Agency Consumer Attitudes Survey 16<br />
The Food St<strong>and</strong>ards Agency conducted the first Consumer Attitudes Survey in 2000<br />
<strong>and</strong> it has since been conducted annually, with the exception of 2008 when it was<br />
reviewed. The survey includes questions exploring <strong>attitudes</strong> to food safety as well as<br />
<strong>towards</strong> cooking <strong>and</strong> <strong>healthy</strong> <strong>eating</strong>.<br />
The latest data from 2007 was collected using face-to-face interviews in participants’<br />
homes. The total sample of 2,627 was stratified across Engl<strong>and</strong>, Scotl<strong>and</strong>, Wales <strong>and</strong><br />
Northern Irel<strong>and</strong> making the data robust at country level.<br />
Data from ‘Wave 8’ of the survey was accessed at individual level directly from the<br />
Food St<strong>and</strong>ards Agency. Information presented in this paper is, therefore, based on<br />
crude rates with no weightings applied.<br />
Low Income Diet <strong>and</strong> Nutrition Survey 17<br />
The Low Income Diet <strong>and</strong> Nutrition Survey (LIDNS) was commissioned by the FSA to<br />
provide nationally-representative evidence on food <strong>and</strong> nutrient intakes, sources of<br />
NOO | <strong>Knowledge</strong> <strong>and</strong> <strong>attitudes</strong> <strong>towards</strong> <strong>healthy</strong> <strong>eating</strong> <strong>and</strong> <strong>physical</strong> <strong>activity</strong>: what the data tell us 30
nutrients <strong>and</strong> the nutritional status of people with a low income. An additional aim<br />
was to examine the relationship between dietary intake <strong>and</strong> factors associated with<br />
food choices in low-income populations. The survey was carried out by a consortium<br />
of three organisations <strong>and</strong> led by the Health Research Group at the National Centre<br />
for Social Research.<br />
The survey aimed to study 15% of the most materially deprived populations within<br />
the UK. A total of 3,728 people from 2,477 households were included in the survey,<br />
which took place between November 2003 <strong>and</strong> January 2005. The survey included<br />
adults (aged 19 <strong>and</strong> above) <strong>and</strong> children (aged 2-18). Information was collected in<br />
face-to-face interviews <strong>and</strong> self-completion questionnaires, <strong>and</strong> included<br />
environmental, economic <strong>and</strong> social factors. The LIDNS also gives information about<br />
how capable people feel about cooking <strong>and</strong> preparing food for themselves, <strong>and</strong> the<br />
impact this has on their food choices.<br />
Data from the LIDNS 2005 has been accessed from the UK data archive at individual level.<br />
Information presented in this paper is based on crude rates with no weightings applied.<br />
British Social Attitudes Survey 18<br />
The British Social Attitudes Survey (BSAS) has been conducted annually since 1983 with<br />
the exceptions of 1988 <strong>and</strong> 1992 when funding was diverted to the British Election<br />
Study (BES) following general elections. In 1997 a scaled-down version was conducted<br />
alongside the BES.<br />
The central aim of the BSAS is, as the name suggests, to examine <strong>attitudes</strong> <strong>towards</strong><br />
various social, economic, political <strong>and</strong> moral issues, including sporting activities <strong>and</strong><br />
<strong>physical</strong>ly active modes of transport.<br />
The National Centre for Social Research holds primary responsibility for the BSAS <strong>and</strong><br />
use a combination of face-to-face interviews <strong>and</strong> self-completion questionnaires to<br />
collect data.<br />
A multi-stage stratified r<strong>and</strong>om sample of British adults (over 18) is conducted using<br />
the postcode address file: the total sample in 2007 being 4,124.<br />
Data from the BSAS 2008 has been accessed from the UK data archive at individual<br />
level. Information presented in this paper is based on crude rates with no weightings<br />
applied.<br />
Sodexho School Meals <strong>and</strong> Lifestyles Survey 19<br />
Sodexho are a private sector company providing various food services including school<br />
meals. In 1990 they began carrying out surveys on the types of food school children<br />
eat as well as their preferences <strong>and</strong> <strong>attitudes</strong> <strong>towards</strong> food <strong>and</strong> nutrition. The latest<br />
available survey data is from the 2005 survey <strong>and</strong> it included core questions as well as<br />
extra questions on intake of fruit <strong>and</strong> vegetables <strong>and</strong> water consumption. No<br />
information was available in the report on the size or demographics of the sample.<br />
Data from the Sodexho School Meals <strong>and</strong> Lifestyles Survey is taken from the report<br />
published by Sodexho as no raw data was available for this dataset.<br />
NOO | <strong>Knowledge</strong> <strong>and</strong> <strong>attitudes</strong> <strong>towards</strong> <strong>healthy</strong> <strong>eating</strong> <strong>and</strong> <strong>physical</strong> <strong>activity</strong>: what the data tell us 31
National Diet <strong>and</strong> Nutrition Survey 20<br />
The National Diet <strong>and</strong> Nutrition Survey (NDNS) was established in 1992 by the Ministry<br />
of Agriculture, Fisheries <strong>and</strong> Food (MAFF) <strong>and</strong> the Department of Health (DH). It is<br />
currently jointly funded <strong>and</strong> managed by the Food St<strong>and</strong>ards Agency (FSA), with a<br />
contribution from the DH. The NDNS was originally set up as a series of cross-sectional<br />
surveys of diet <strong>and</strong> nutritional status of the population. The surveys have been split<br />
into four age groups: pre-school children in 1992 to 1993; older adults in 1994 to 1995;<br />
school-age children in 1997; <strong>and</strong> adults 2000 to 2001. One survey was carried out every<br />
two to three years. Data on consumption by individuals was gathered using a weighed<br />
intake dietary record for four to seven days.<br />
In April 2008, the NDNS changed to a rolling programme with data collected annually<br />
from approximately 500 adults <strong>and</strong> 500 children (older than 18 months old). The<br />
survey sample is designed to be representative of the UK population. Sample boosts<br />
have been carried out in Scotl<strong>and</strong>, Wales <strong>and</strong> Northern Irel<strong>and</strong>. There is scope for<br />
boosts in other population groups or add-on studies.<br />
The NDNS 2000/01 asked a series of questions relating to <strong>attitudes</strong> <strong>towards</strong> <strong>eating</strong> <strong>and</strong><br />
exercise, specifically exploring the motivation to eat <strong>healthy</strong> or un<strong>healthy</strong> foods <strong>and</strong><br />
the extent to which this is emotionally motivated – these were not included in<br />
subsequent surveys. For this reason 2000/01 data is considered within this report.<br />
Data from the NDNS 2000/01 has been accessed from the UK data archive at individual<br />
level. Information presented in this paper is based on crude rates with no weightings<br />
applied.<br />
Target Group Index data 21<br />
Target Group Index (TGI) surveys collect information from samples of the population<br />
on a variety of aspects of life, including product <strong>and</strong> br<strong>and</strong> use, leisure activities, use<br />
of services, media exposure, preferences, <strong>attitudes</strong> <strong>and</strong> motivations. TGI data is<br />
collected in a continuous rolling fieldwork programme <strong>and</strong> is released quarterly (12<br />
months data), with a sample size of around 20,000 people in Engl<strong>and</strong>.<br />
The East Midl<strong>and</strong>s Public Health Observatory has access to the DH’s Healthy<br />
Foundations dataset, which includes TGI data from October 2008 to September 2009.<br />
These data are used to create modelled profiles of groups of the population with<br />
particular characteristics. The data presented in this report is taken from the TGI data<br />
used for this segmentation.<br />
NOO | <strong>Knowledge</strong> <strong>and</strong> <strong>attitudes</strong> <strong>towards</strong> <strong>healthy</strong> <strong>eating</strong> <strong>and</strong> <strong>physical</strong> <strong>activity</strong>: what the data tell us 32
Appendix 3: data tables d<br />
Adults<br />
Table 1: Appraisal of one’s own diet<br />
Overall what I usually eat is…<br />
N= All %<br />
Under<br />
weight %<br />
Healthy<br />
weight %<br />
Over<br />
weight %<br />
Obese %<br />
Morbidly<br />
obese %<br />
Very <strong>healthy</strong> 1179 18.5 12.7 20.5 19.0 13.6 9.6<br />
Quite <strong>healthy</strong> 4579 72.0 68.4 70.6 73.3 73.9 78.8<br />
Not very <strong>healthy</strong> 564 8.9 19 8.5 7.3 11.5 11.5<br />
Very un<strong>healthy</strong> 35 0.6 0.0 0.4 0.5 1.0 0.0<br />
Source: HSE 2007<br />
Table 2: Attitudes to <strong>healthy</strong> <strong>eating</strong>: proportions answering positively to statements<br />
(precise question not provided in data source)<br />
All %<br />
Under<br />
weight<br />
%<br />
Healthy<br />
weight<br />
%<br />
Over<br />
weight<br />
%<br />
Obese<br />
%<br />
Morbidly<br />
obese %<br />
Not<br />
stated<br />
%<br />
Total Sample (N=) 4928 126 2016 1464 829 108 385<br />
I always think of the<br />
calories in what I eat<br />
I think health foods<br />
are only bought by<br />
fanatics<br />
I think fast food is all<br />
junk<br />
I should do a lot<br />
more about my<br />
health<br />
I consider my diet to<br />
be very <strong>healthy</strong><br />
I am <strong>eating</strong> more<br />
<strong>healthy</strong> food than I<br />
have in the past<br />
I wouldn't let my<br />
children eat junk food<br />
I get a lot of pleasure<br />
out of food<br />
I like to treat myself<br />
to foods that are not<br />
good for me<br />
Source: TGI 2008/09<br />
25.4 19.8 27.5 25.4 22.1 21.3 23.9<br />
14.4 12.7 12.7 15.9 16.2 20.3 12.2<br />
35.0 35.7 35.9 35.9 34.0 33.3 29.6<br />
50.1 54.0 49.4 46.5 55.2 ↑ 53.7 54.3<br />
45.9 34.1 ↓ 46.9 47.8 42.8 36.1 46.2<br />
60.2 50.8 61.0 61.8 58.6 58.3 57.7<br />
26.1 17.5 27.9 24.9 24.0 25.9 28.8<br />
59.6 54.8 59.6 61.7 57.1 66.7 56.4<br />
47.3 54.0 48.7 45.9 45.5 52.8 45.5<br />
Note: A ↑ symbol indicates a value that is significantly higher than that from the total sample <strong>and</strong> a ↓ symbol one<br />
that is significantly lower.<br />
d Percentages may not add up to 100% because numbers have been rounded to one decimal place.<br />
NOO | <strong>Knowledge</strong> <strong>and</strong> <strong>attitudes</strong> <strong>towards</strong> <strong>healthy</strong> <strong>eating</strong> <strong>and</strong> <strong>physical</strong> <strong>activity</strong>: what the data tell us 33
Table 3: Assessment of possible improvement to diet<br />
How easy or difficult would it be to make improvements to the way you eat<br />
N= All<br />
Under<br />
Weight<br />
%<br />
Healthy<br />
Weight<br />
%<br />
Over<br />
Weight<br />
%<br />
Obese<br />
%<br />
Morbidly<br />
Obese<br />
%<br />
N= 6344 79 2029 2093 1300 105<br />
Very easy 702 8.9% 16.5 12.1 11.2 10.2 10.5<br />
Quite easy 2869 37.1 41.8 47.8 45.4 45.8 43.8<br />
Quite<br />
difficult<br />
1192 19.5 20.3 15.5 17.5 25.1 23.8<br />
Very difficult 149 2.7 1.3 1.8 2.3 2.9 5.7<br />
No changes<br />
necessary<br />
Source: HSE 2007<br />
1432 31.7 20.3 22.8 23.6 16.1 16.2<br />
Table 4: Barriers to a <strong>healthy</strong> lifestyle: proportions answering positively to<br />
statements (precise question not provided in data source)<br />
All %<br />
Under<br />
weight<br />
%<br />
Healthy<br />
weight<br />
%<br />
Over<br />
weight<br />
%<br />
Obese<br />
%<br />
Morbidly<br />
obese %<br />
Not<br />
stated<br />
%<br />
Total sample (N=) 4928 126 2016 1464 829 108 385<br />
Time 33.0 31.8 37.5 ↑ 32.2 28.1 ↓ 15.7 ↓ 27.5<br />
I already live a <strong>healthy</strong><br />
lifestyle<br />
Other health problems<br />
I have<br />
31.2 36.5 37.3 ↑ 28.5 23.2 ↓ 16.7 ↓ 28.6<br />
29.5 23.0 20.0 ↓ 30.7 44.9 ↑ 62.0 ↑ 34.0<br />
Cost 22.4 26.2 22.1 22.8 20.6 33.3 ↑ 21.6<br />
Lack of will power 17.3 10.3 15.5 17.2 23.9 ↑ 25.9 ↑ 12.2 ↓<br />
Can't be bothered 8.1 6.4 7.6 8.2 11.5 ↑ 0.9 ↓ 5.7<br />
Other responsibilities/<br />
caring/child care<br />
Access to facilities/<br />
healthier choices<br />
Family influence/what<br />
family will do<br />
Eating habits/<strong>eating</strong><br />
the wrong foods<br />
Source: TGI 2008/09<br />
6.5 3.2 5.5 6.4 6.4 11.1 11.9 ↑<br />
3.8 3.2 3.5 3.3 3.6 8.3 ↑ 6.0<br />
2.8 2.4 3.1 2.1 2.6 2.8 4.2<br />
2.1 2.4 1.9 1.8 3.4 1.9 0.8<br />
Note: A ↓ symbol indicates that the proportion of individuals within that BMI category who answered positively<br />
was significantly lower than the total sample <strong>and</strong> a ↑ symbol that it was significantly higher.<br />
NOO | <strong>Knowledge</strong> <strong>and</strong> <strong>attitudes</strong> <strong>towards</strong> <strong>healthy</strong> <strong>eating</strong> <strong>and</strong> <strong>physical</strong> <strong>activity</strong>: what the data tell us 34
Table 5: Underst<strong>and</strong>ing of recommendations for <strong>physical</strong> <strong>activity</strong> levels<br />
Which of the following statements applies to you<br />
Respondents<br />
No. %<br />
I know what the recommended level of <strong>physical</strong> <strong>activity</strong> is 1320 27.5<br />
I have heard of the recommended level of <strong>physical</strong> <strong>activity</strong> but don't<br />
know what it is 1966 40.9<br />
I have not heard about the recommended level of <strong>physical</strong> <strong>activity</strong> 1523 31.7<br />
Source: HSE 2007<br />
Table 6: Use of <strong>physical</strong> <strong>activity</strong> facilities<br />
Used in the last 6 months (%) Used in the last year (%)<br />
Sport <strong>and</strong> leisure facilities 47.5 58.0<br />
Parks <strong>and</strong> open spaces 80.9 88.4<br />
Source: Place Survey<br />
Table 7: Appraisal of one’s own <strong>physical</strong> <strong>activity</strong> participation<br />
All (%) Underweight (%)<br />
Healthy Weight<br />
(%)<br />
Overweight (%) Obese (%)<br />
Morbidly Obese<br />
(%)<br />
Very<br />
<strong>physical</strong>ly<br />
active<br />
Fairly<br />
<strong>physical</strong>ly<br />
active<br />
Not very<br />
<strong>physical</strong>ly<br />
active<br />
Not at all<br />
<strong>physical</strong>ly<br />
active<br />
M F Total M F Total M F Total M F Total M F Total M F Total<br />
17.5 10.9 13.8 25.0 9.5 15.2 25.3 14.9 19.0 18.8 11.1 15.1 7.3 4.8 6.0 3.4 3.4 3.4<br />
57.2 56.5 56.8 58.3 66.7 63.6 56.8 62.8 60.5 60.4 58.8 59.6 54.3 47.9 50.9 20.7 35.6 30.7<br />
20.7 26.9 24.2 16.7 21.4 19.7 15.2 18.9 17.4 17.4 24.5 20.7 32.5 39.4 36.2 48.3 52.5 51.1<br />
4.6 5.6 5.2 0.0 2.4 1.5 2.8 3.4 3.1 3.5 5.6 4.5 5.9 7.9 7.0 27.6 8.5 14.8<br />
Source: HSE 2007<br />
NOO | <strong>Knowledge</strong> <strong>and</strong> <strong>attitudes</strong> <strong>towards</strong> <strong>healthy</strong> <strong>eating</strong> <strong>and</strong> <strong>physical</strong> <strong>activity</strong>: what the data tell us 35
Children<br />
Table 8: Estimation of own weight (8–15 year olds)<br />
Given your age <strong>and</strong> height would you say that you are...<br />
Normal weight (%) Overweight (%) Obese (%)<br />
About the right weight 79.9 77.3 46.3<br />
Too heavy 5.1 21.1 53.5<br />
Too light 15.0 1.6 0.2<br />
Source: HSE 2007<br />
Table 9: Current dieting status (8–15 year olds)<br />
At the present time are you trying to lose weight, trying to gain weight or not trying to change<br />
your weight<br />
Normal weight (%) Overweight (%) Obese (%)<br />
Trying to lose weight 11.7 37.6 65.1<br />
Trying to gain weight 9.8 1.9 0.6<br />
Not trying to change weight 78.5 60.5 34.3<br />
Source: HSE 2007<br />
Table 10: Physical <strong>activity</strong> levels compared with other people of same age by gender<br />
(11–15 year olds)<br />
Compared to other people of your own age would you describe yourself as.....<br />
Males (%) Females (%) All (%)<br />
Very <strong>physical</strong>ly active 42.4 29.3 35.8<br />
Fairly <strong>physical</strong>ly active 47.6 55.3 51.2<br />
Not very <strong>physical</strong>ly<br />
active<br />
Not at all <strong>physical</strong>ly<br />
active<br />
9.0 14.2 11.5<br />
1.1 1.2 1.2<br />
Source: HSE 2007<br />
NOO | <strong>Knowledge</strong> <strong>and</strong> <strong>attitudes</strong> <strong>towards</strong> <strong>healthy</strong> <strong>eating</strong> <strong>and</strong> <strong>physical</strong> <strong>activity</strong>: what the data tell us 36
References<br />
1. Nutbeam D <strong>and</strong> Harris E. Theory in a Nutshell: A Practical Guide to Health<br />
Promotion. Sydney: McGraw-Hill, 2004.<br />
2. MacDowell W, Bonnell C <strong>and</strong> Davies M. Health Promotion Practice. Maidenhead:<br />
McGraw-Hill, 2006.<br />
3. B<strong>and</strong>ura A. Self-efficacy in Changing Societies. New York: Cambridge University<br />
Press, 1995.<br />
4. Allender S, Cowburn G, Foster C. Underst<strong>and</strong>ing Participation in Sport <strong>and</strong><br />
Physical Activity Among Children <strong>and</strong> Adults: A Review of Qualitative Studies,<br />
Health Education Research, 2006, 21(6), 826-835.<br />
5. Sallis JF, Cervero RB, Ascher W, Henderson KA, Kraft KM, Kerr J. An Ecological<br />
Approach to Cr<strong>eating</strong> Active Living Communities, Annual Review of Public<br />
Health, 2006, 27, 297-322.<br />
6. Brug J. Determinantes of Healthy Eating: Motivation, Abilities <strong>and</strong> Environmental<br />
Opportunities, Family Practice, 2008, 25 (Supplement 1) i50-i55.<br />
7. Shaw KA, O’Rourke P, Del Mar C, Kenardy J. Psychological Interventions for<br />
Overweight or Obesity, Cochrane Database of Systematic Reviews, 2005, Issue 2.<br />
8. Roberts K. Data Sources: <strong>Knowledge</strong> of an Attitudes to Healthy Eating <strong>and</strong><br />
Physical Activity Oxford: National Obesity Observatory, 2010<br />
9. The Information Centre, Health Survey for Engl<strong>and</strong> 2007: Summary of key<br />
findings. Leeds: The Information Centre, 2008.<br />
10. Sallis JF, Cervero RB, Ascher W, Henderson, KA, Kraft, KM, Kerr, J. An Ecological<br />
Approach to Cr<strong>eating</strong> Active Living Communities, Annual Review of Public<br />
Health, 2006, 27, 297-322<br />
11. National Institute for Health <strong>and</strong> Clinical Excellence. Behaviour Change at<br />
Population, Community <strong>and</strong> Individual Levels. London: Department of Health,<br />
2007.<br />
12. National Centre for Social Research <strong>and</strong> University College London. Department<br />
of Epidemiology <strong>and</strong> Public Health, Health Survey for Engl<strong>and</strong>, 2007 [computer<br />
file]. 2nd Edition. Colchester, Essex: UK Data Archive [distributor], April 2010. SN:<br />
6112.<br />
13. Sport Engl<strong>and</strong>, Active People Survey, 2007-2008 [computer file]. Colchester, Essex:<br />
UK Data Archive [distributor], December 2009. SN: 6347.<br />
14. Communities <strong>and</strong> Local Government <strong>and</strong> Audit Commission, Place Survey, 2008<br />
[computer file]. Colchester, Essex: UK Data Archive [distributor], September 2010.<br />
SN: 6519.<br />
15. Ofsted Tell Us 3 National Report. London: Department for Education <strong>and</strong> Skills,<br />
2008.<br />
NOO | <strong>Knowledge</strong> <strong>and</strong> <strong>attitudes</strong> <strong>towards</strong> <strong>healthy</strong> <strong>eating</strong> <strong>and</strong> <strong>physical</strong> <strong>activity</strong>: what the data tell us 37
16. Food St<strong>and</strong>ards Agency Consumer Attitudes to Food St<strong>and</strong>ards: Wave 8, UK Final<br />
Report. London: Food St<strong>and</strong>ards Agency, 2007.<br />
17. National Centre for Social Research et al., Low Income Diet <strong>and</strong> Nutrition Survey,<br />
2003-2005 [computer file]. Colchester, Essex: UK Data Archive [distributor], March<br />
2008. SN: 5808.<br />
18. National Centre for Social Research, British Social Attitudes Survey, 2008<br />
[computer file]. Colchester, Essex: UK Data Archive [distributor], March 2010. SN:<br />
6390.<br />
19. Sodexho Ltd The Sodexho School Meals <strong>and</strong> Lifestyle Survey 2005. Swindon:<br />
Sodexho Ltd, 2005.<br />
20. Office for National Statistics. Social <strong>and</strong> Vital Statistics Division <strong>and</strong> Food<br />
St<strong>and</strong>ards Agency, National Diet <strong>and</strong> Nutrition Survey : Adults Aged 19 to 64<br />
Years, 2000-2001 [computer file]. Colchester, Essex: UK Data Archive [distributor],<br />
May 2005. SN: 5140.<br />
21. Department of Health Healthy Foundations: A Segmentation Model. London:<br />
Department of Health, 2010.<br />
NOO | <strong>Knowledge</strong> <strong>and</strong> <strong>attitudes</strong> <strong>towards</strong> <strong>healthy</strong> <strong>eating</strong> <strong>and</strong> <strong>physical</strong> <strong>activity</strong>: what the data tell us 38
Reader Information<br />
Title<br />
Author(s)<br />
Reviewer(s)<br />
<strong>Knowledge</strong> <strong>and</strong> <strong>attitudes</strong> <strong>towards</strong> <strong>healthy</strong> <strong>eating</strong><br />
<strong>and</strong> <strong>physical</strong> <strong>activity</strong>: what the data tell us.<br />
Kath Roberts<br />
Katie Marvin<br />
Ken Fox, University of Bristol<br />
Jane Appleton, Oxford Brookes University<br />
Jilly Martin, Oxford Brookes University<br />
Publication date May 2011<br />
Target audience<br />
Description<br />
How to cite<br />
Contact<br />
Public health <strong>and</strong> other professionals working in<br />
local authorities <strong>and</strong> other public health<br />
organisations who are interested in <strong>attitudes</strong> to<br />
<strong>and</strong> knowledge of <strong>healthy</strong> <strong>eating</strong> <strong>and</strong> <strong>physical</strong><br />
<strong>activity</strong> in the population.<br />
This paper draws on the data sources identified in<br />
the paper; ‘Data sources: knowledge of <strong>and</strong><br />
<strong>attitudes</strong> to <strong>healthy</strong> <strong>eating</strong> <strong>and</strong> <strong>physical</strong> <strong>activity</strong>’,<br />
presents analysis of the data <strong>and</strong> provides some<br />
background to its relevance to <strong>healthy</strong> <strong>eating</strong> <strong>and</strong><br />
<strong>physical</strong> <strong>activity</strong> behaviours.<br />
Roberts, K <strong>and</strong> Marvin, K. <strong>Knowledge</strong> <strong>and</strong> <strong>attitudes</strong><br />
<strong>towards</strong> <strong>healthy</strong> <strong>eating</strong> <strong>and</strong> <strong>physical</strong> <strong>activity</strong>: what<br />
the data tell us. Oxford: National Obesity<br />
Observatory, 2011.<br />
National Obesity Observatory<br />
www.noo.org.uk<br />
info@noo.org.uk<br />
Electronic location<br />
Copyright<br />
http://www.noo.org.uk/NOO_pub/briefing_papers<br />
© National Obesity Observatory<br />
National Obesity Observatory<br />
NOO | <strong>Knowledge</strong> <strong>and</strong> <strong>attitudes</strong> <strong>towards</strong> <strong>healthy</strong> <strong>eating</strong> <strong>and</strong> <strong>physical</strong> <strong>activity</strong>: what the data tell us 39