A Parent's Guide to MAP
A Parent's Guide to MAP
A Parent's Guide to MAP

You also want an ePaper? Increase the reach of your titles
YUMPU automatically turns print PDFs into web optimized ePapers that Google loves.
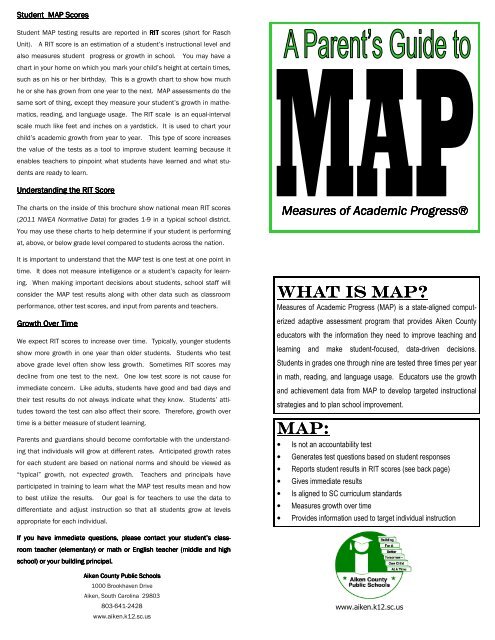
Student <strong>MAP</strong> Scores<br />
Student <strong>MAP</strong> testing results are reported in RIT scores (short for Rasch<br />
Unit). A RIT score is an estimation of a student’s instructional level and<br />
also measures student progress or growth in school. You may have a<br />
chart in your home on which you mark your child’s height at certain times,<br />
such as on his or her birthday. This is a growth chart <strong>to</strong> show how much<br />
he or she has grown from one year <strong>to</strong> the next. <strong>MAP</strong> assessments do the<br />
same sort of thing, except they measure your student’s growth in mathematics,<br />
reading, and language usage. The RIT scale is an equal-interval<br />
scale much like feet and inches on a yardstick. It is used <strong>to</strong> chart your<br />
child’s academic growth from year <strong>to</strong> year. This type of score increases<br />
the value of the tests as a <strong>to</strong>ol <strong>to</strong> improve student learning because it<br />
enables teachers <strong>to</strong> pinpoint what students have learned and what students<br />
are ready <strong>to</strong> learn.<br />
Understanding the RIT Score<br />
The charts on the inside of this brochure show national mean RIT scores<br />
(2011 NWEA Normative Data) for grades 1-9 in a typical school district.<br />
You may use these charts <strong>to</strong> help determine if your student is performing<br />
at, above, or below grade level compared <strong>to</strong> students across the nation.<br />
It is important <strong>to</strong> understand that the <strong>MAP</strong> test is one test at one point in<br />
time. It does not measure intelligence or a student’s capacity for learning.<br />
When making important decisions about students, school staff will<br />
consider the <strong>MAP</strong> test results along with other data such as classroom<br />
performance, other test scores, and input from parents and teachers.<br />
Growth Over Time<br />
We expect RIT scores <strong>to</strong> increase over time. Typically, younger students<br />
show more growth in one year than older students. Students who test<br />
above grade level often show less growth. Sometimes RIT scores may<br />
decline from one test <strong>to</strong> the next. One low test score is not cause for<br />
immediate concern. Like adults, students have good and bad days and<br />
their test results do not always indicate what they know. Students’ attitudes<br />
<strong>to</strong>ward the test can also affect their score. Therefore, growth over<br />
time is a better measure of student learning.<br />
Parents and guardians should become comfortable with the understanding<br />
that individuals will grow at different rates. Anticipated growth rates<br />
for each student are based on national norms and should be viewed as<br />
“typical” growth, not expected growth. Teachers and principals have<br />
participated in training <strong>to</strong> learn what the <strong>MAP</strong> test results mean and how<br />
<strong>to</strong> best utilize the results. Our goal is for teachers <strong>to</strong> use the data <strong>to</strong><br />
differentiate and adjust instruction so that all students grow at levels<br />
appropriate for each individual.<br />
Measures of Academic Progress®<br />
What is <strong>MAP</strong><br />
Measures of Academic Progress (<strong>MAP</strong>) is a state-aligned computerized<br />
adaptive assessment program that provides Aiken County<br />
educa<strong>to</strong>rs with the information they need <strong>to</strong> improve teaching and<br />
learning and make student-focused, data-driven decisions.<br />
Students in grades one through nine are tested three times per year<br />
in math, reading, and language usage. Educa<strong>to</strong>rs use the growth<br />
and achievement data from <strong>MAP</strong> <strong>to</strong> develop targeted instructional<br />
strategies and <strong>to</strong> plan school improvement.<br />
<strong>MAP</strong>:<br />
• Is not an accountability test<br />
• Generates test questions based on student responses<br />
• Reports student results in RIT scores (see back page)<br />
• Gives immediate results<br />
• Is aligned <strong>to</strong> SC curriculum standards<br />
• Measures growth over time<br />
• Provides information used <strong>to</strong> target individual instruction<br />
If you have immediate questions, please contact your student’s class-<br />
room teacher (elementary) or math or English teacher (middle and high<br />
school) or your building principal.<br />
Aiken County Public Schools<br />
1000 Brookhaven Drive<br />
Aiken, South Carolina 29803<br />
803-641-2428<br />
www.aiken.k12.sc.us<br />
www.aiken.k12.sc.us
September/Oc<strong>to</strong>ber<br />
W h e n a r e t e s t s g i v e n <br />
Three (3) times per year<br />
December/January<br />
March<br />
(Fall) (Winter) (Spring)<br />
H o w a r e t e s t s g i v e n <br />
• On the computer under adult supervision in the school setting<br />
• Adjusts <strong>to</strong> a student’s skill level so that each student takes an<br />
individualized test<br />
Grade<br />
Grade<br />
W h a t t e s t s a r e g i v e n <br />
Reading<br />
Math<br />
Language<br />
1st <br />
9th <br />
2nd—9th<br />
Fall <strong>MAP</strong> Reading RIT Score<br />
Above<br />
Grade Level<br />
At Grade<br />
Level<br />
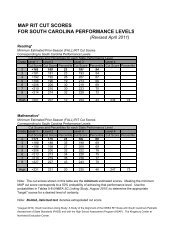
Growth <strong>Guide</strong>line Chart<br />
The chart below shows the NATIONAL grade level scores for 1st-9th<br />
graders who tested in Fall and Spring. This shows the yearly growth<br />
that is typical for each grade level. When you review your child’s scores,<br />
you can check <strong>to</strong> see if his/her growth is above, at, or below average,<br />
compared <strong>to</strong> students in the same grade.<br />
Reading Year's<br />
Math Year's<br />
Fall Spring Growth Fall Spring Growth<br />
1 160 177 17 1 163 179 16<br />
2 176 190 14 2 178 191 13<br />
3 190 199 9 3 192 203 11<br />
4 200 207 7 4 204 213 9<br />
5 207 212 5<br />
6 212 216 4<br />
7 216 220 4<br />
8 219 222 3<br />
9 221 223 2<br />
Is my child on grade level<br />
Below<br />
Grade Level<br />
1-Grade<br />
Below<br />
2-Grades<br />
Below<br />
1 161+ 160 144-159 143-<br />
2 177+ 176 161-175 144-160 143-<br />
3 191+ 190 177-189 161-176 160-<br />
4 201+ 200 191-199 177-190 176-<br />
5 208+ 207 201-206 191-200 190-<br />
6 213+ 212 208-211 201-207 200-<br />
7 217+ 216 213-215 208-212 207-<br />
8 220+ 219 217-218 213-215 212-<br />
9 222+ 221 220 216-218 216-<br />
Grade<br />
Grade<br />
Fall <strong>MAP</strong> Math RIT Score<br />
Above<br />
Grade Level<br />
At Grade<br />
Level<br />
Grade<br />
5 213 221 8<br />
6 220 226 6<br />
7 226 231 5<br />
8 230 235 5<br />
9 234 236 2<br />
Below<br />
Grade Level<br />
1-Grade<br />
Below<br />
2-Grades<br />
Below<br />
1 164+ 163 144-162 143-<br />
2 179+ 178 164-177 144-163 143-<br />
3 193+ 192 179-191 164-178 163-<br />
4 205+ 204 193-203 179-192 178-<br />
5 214+ 213 205-212 193-204 192-<br />
6 221+ 220 214-219 205-213 204-<br />
7 227+ 226 221-225 214-220 213-<br />
8 231+ 230 227-229 221-226 220-<br />
9 235+ 234 231-233 227-230 226-<br />
Grade<br />
Grade<br />
Winter <strong>MAP</strong> Reading RIT Score<br />
Above<br />
Grade Level<br />
At Grade<br />
Level<br />
Below<br />
Grade Level<br />
1-Grade<br />
Below<br />
2-Grades<br />
Below<br />
1 172+ 171 152-169 151-<br />
2 185+ 184 171-183 152-170 151-<br />
3 196+ 195 184-194 171-183 170-<br />
4 204+ 203 196-202 184-195 183-<br />
5 211+ 210 204-209 196-203 195-<br />
6 215+ 214 211-213 204-210 203-<br />
7 219+ 218 215-217 211-214 210-<br />
8 222+ 221 219-220 215-218 214-<br />
9 223+ 222 219-221 218-<br />
Spring <strong>MAP</strong> Reading RIT Score<br />
Above<br />
Grade Level<br />
At Grade<br />
Level<br />
Below<br />
Grade Level<br />
1-Grade<br />
Below<br />
2-Grades<br />
Below<br />
1 178-187 177 157-176 156-<br />
2 190-209 190 178-189 157-177 156-<br />
3 200-218 199 191-198 178-190 177-<br />
4 207-225 207 200-206 191-199 190-<br />
5 213-230 212 208-211 200-207 199-<br />
6 217-234 216 213-215 208-212 207-<br />
7 221-237 220 217-219 213-216 212-<br />
8 224-242 222 221 217-220 216-<br />
9 224-242 223 221-222 220-<br />
Grade Grade<br />
Winter <strong>MAP</strong> Math RIT Score<br />
Above Grade<br />
Level<br />
At Grade<br />
Level<br />
Below<br />
Grade Level<br />
1-Grade<br />
Below<br />
2-Grades<br />
Below<br />
1 173+ 172 152-171 151-<br />
2 187+ 186 173-185 152-172 151-<br />
3 200+ 199 187-198 173-186 172-<br />
4 210+ 209 200-208 187-199 186-<br />
5 219+ 218 210-217 200-209 199-<br />
6 224+ 223 219-222 210-218 209-<br />
7 229+ 228 224-227 219-223 218-<br />
8 234+ 233 229-232 224-228 223-<br />
9 235+ 235 234 229-233 228-<br />
Spring <strong>MAP</strong> Math RIT Score<br />
Above Grade<br />
Level<br />
At Grade<br />
Level<br />
Below<br />
Grade Level<br />
1-Grade<br />
Below<br />
2-Grades<br />
Below<br />
1 179+ 178 156-177 155-<br />
2 191+ 191 179-190 156-178 155-<br />
3 203+ 203 192-202 179-191 178-<br />
4 213+ 211 204-210 192-203 191-<br />
5 221+ 220 212-219 204-211 203-<br />
6 226+ 225 221-224 212-220 211-<br />
7 231+ 230 226-229 221-225 220-<br />
8 235+ 234 231-233 226-230 225-<br />
9 236+ 236 235 231-234 230-