StraighterLine Business Statistics Syllabus - CollegeTransfer.net
StraighterLine Business Statistics Syllabus - CollegeTransfer.net
StraighterLine Business Statistics Syllabus - CollegeTransfer.net

You also want an ePaper? Increase the reach of your titles
YUMPU automatically turns print PDFs into web optimized ePapers that Google loves.
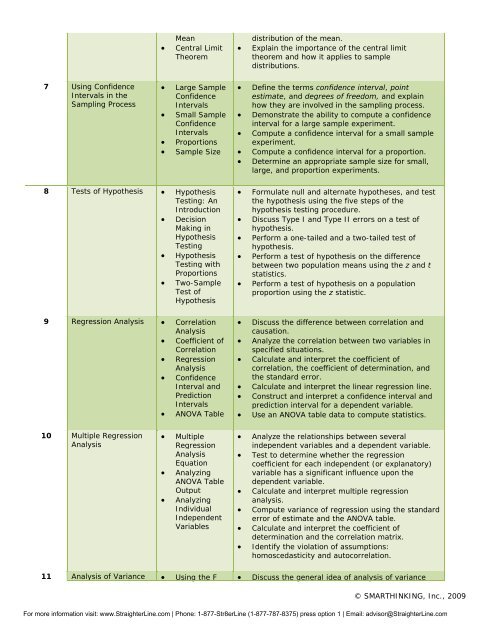
Mean<br />
• Central Limit<br />
Theorem<br />
distribution of the mean.<br />
• Explain the importance of the central limit<br />
theorem and how it applies to sample<br />
distributions.<br />
7 Using Confidence<br />
Intervals in the<br />
Sampling Process<br />
• Large Sample<br />
Confidence<br />
Intervals<br />
• Small Sample<br />
Confidence<br />
Intervals<br />
• Proportions<br />
• Sample Size<br />
• Define the terms confidence interval, point<br />
estimate, and degrees of freedom, and explain<br />
how they are involved in the sampling process.<br />
• Demonstrate the ability to compute a confidence<br />
interval for a large sample experiment.<br />
• Compute a confidence interval for a small sample<br />
experiment.<br />
• Compute a confidence interval for a proportion.<br />
• Determine an appropriate sample size for small,<br />
large, and proportion experiments.<br />
8 Tests of Hypothesis • Hypothesis<br />
Testing: An<br />
Introduction<br />
• Decision<br />
Making in<br />
Hypothesis<br />
Testing<br />
• Hypothesis<br />
Testing with<br />
Proportions<br />
• Two-Sample<br />
Test of<br />
Hypothesis<br />
9 Regression Analysis • Correlation<br />
Analysis<br />
• Coefficient of<br />
Correlation<br />
• Regression<br />
Analysis<br />
• Confidence<br />
Interval and<br />
Prediction<br />
Intervals<br />
• ANOVA Table<br />
• Formulate null and alternate hypotheses, and test<br />
the hypothesis using the five steps of the<br />
hypothesis testing procedure.<br />
• Discuss Type I and Type II errors on a test of<br />
hypothesis.<br />
• Perform a one-tailed and a two-tailed test of<br />
hypothesis.<br />
• Perform a test of hypothesis on the difference<br />
between two population means using the z and t<br />
statistics.<br />
• Perform a test of hypothesis on a population<br />
proportion using the z statistic.<br />
• Discuss the difference between correlation and<br />
causation.<br />
• Analyze the correlation between two variables in<br />
specified situations.<br />
• Calculate and interpret the coefficient of<br />
correlation, the coefficient of determination, and<br />
the standard error.<br />
• Calculate and interpret the linear regression line.<br />
• Construct and interpret a confidence interval and<br />
prediction interval for a dependent variable.<br />
• Use an ANOVA table data to compute statistics.<br />
10 Multiple Regression<br />
Analysis<br />
• Multiple<br />
Regression<br />
Analysis<br />
Equation<br />
• Analyzing<br />
ANOVA Table<br />
Output<br />
• Analyzing<br />
Individual<br />
Independent<br />
Variables<br />
• Analyze the relationships between several<br />
independent variables and a dependent variable.<br />
• Test to determine whether the regression<br />
coefficient for each independent (or explanatory)<br />
variable has a significant influence upon the<br />
dependent variable.<br />
• Calculate and interpret multiple regression<br />
analysis.<br />
• Compute variance of regression using the standard<br />
error of estimate and the ANOVA table.<br />
• Calculate and interpret the coefficient of<br />
determination and the correlation matrix.<br />
• Identify the violation of assumptions:<br />
homoscedasticity and autocorrelation.<br />
11 Analysis of Variance • Using the F • Discuss the general idea of analysis of variance<br />
© SMARTHINKING, Inc., 2009<br />
For more information visit: www.<strong>StraighterLine</strong>.com | Phone: 1-877-Str8erLine (1-877-787-8375) press option 1 | Email: advisor@<strong>StraighterLine</strong>.com