StraighterLine Business Statistics Syllabus - CollegeTransfer.net
StraighterLine Business Statistics Syllabus - CollegeTransfer.net
StraighterLine Business Statistics Syllabus - CollegeTransfer.net

Create successful ePaper yourself
Turn your PDF publications into a flip-book with our unique Google optimized e-Paper software.
<strong>Business</strong> <strong>Statistics</strong><br />
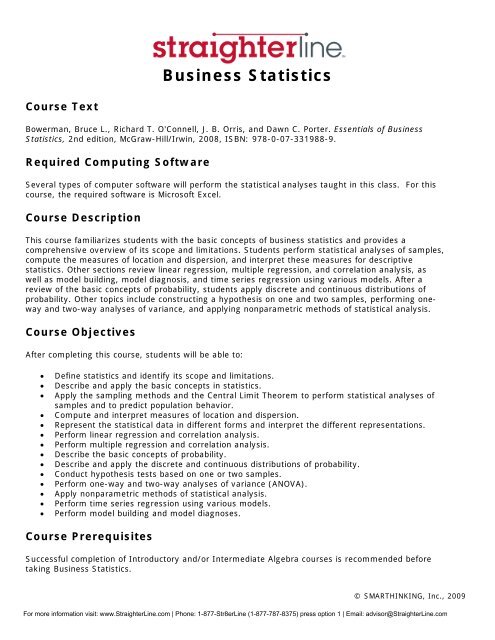
Course Text<br />
Bowerman, Bruce L., Richard T. O'Connell, J. B. Orris, and Dawn C. Porter. Essentials of <strong>Business</strong><br />
<strong>Statistics</strong>, 2nd edition, McGraw-Hill/Irwin, 2008, ISBN: 978-0-07-331988-9.<br />
Required Computing Software<br />
Several types of computer software will perform the statistical analyses taught in this class. For this<br />
course, the required software is Microsoft Excel.<br />
Course Description<br />
This course familiarizes students with the basic concepts of business statistics and provides a<br />
comprehensive overview of its scope and limitations. Students perform statistical analyses of samples,<br />
compute the measures of location and dispersion, and interpret these measures for descriptive<br />
statistics. Other sections review linear regression, multiple regression, and correlation analysis, as<br />
well as model building, model diagnosis, and time series regression using various models. After a<br />
review of the basic concepts of probability, students apply discrete and continuous distributions of<br />
probability. Other topics include constructing a hypothesis on one and two samples, performing oneway<br />
and two-way analyses of variance, and applying nonparametric methods of statistical analysis.<br />
Course Objectives<br />
After completing this course, students will be able to:<br />
• Define statistics and identify its scope and limitations.<br />
• Describe and apply the basic concepts in statistics.<br />
• Apply the sampling methods and the Central Limit Theorem to perform statistical analyses of<br />
samples and to predict population behavior.<br />
• Compute and interpret measures of location and dispersion.<br />
• Represent the statistical data in different forms and interpret the different representations.<br />
• Perform linear regression and correlation analysis.<br />
• Perform multiple regression and correlation analysis.<br />
• Describe the basic concepts of probability.<br />
• Describe and apply the discrete and continuous distributions of probability.<br />
• Conduct hypothesis tests based on one or two samples.<br />
• Perform one-way and two-way analyses of variance (ANOVA).<br />
• Apply nonparametric methods of statistical analysis.<br />
• Perform time series regression using various models.<br />
• Perform model building and model diagnoses.<br />
Course Prerequisites<br />
Successful completion of Introductory and/or Intermediate Algebra courses is recommended before<br />
taking <strong>Business</strong> <strong>Statistics</strong>.<br />
© SMARTHINKING, Inc., 2009<br />
For more information visit: www.<strong>StraighterLine</strong>.com | Phone: 1-877-Str8erLine (1-877-787-8375) press option 1 | Email: advisor@<strong>StraighterLine</strong>.com
Important Terms<br />
In this course, different terms are used to designate tasks:<br />
• Practice Exercise: A non-graded set of problems that where skills discussed in a topic are<br />
practiced.<br />
• Graded Quiz: A graded online assessment that is usually shorter than a graded exam.<br />
• Graded Exam: A graded online assessment that is comprehensive.<br />
Course Evaluation Criteria<br />
<strong>StraighterLine</strong> does not apply letter grades. Students earn a score as a percentage of 100%. A<br />
passing percentage is 70% or higher. If you have chosen a Partner College to award credit for this<br />
course, your final grade will be based upon that college's grading scale. Only passing scores will be<br />
considered by Partner Colleges for an award of credit.<br />
There are a total of 540 points in the course:<br />
Topic Assessment Points Available<br />
2 Graded Quiz 2.1 60<br />
4 Graded Quiz 4.1 60<br />
6 Graded Quiz 6.1 60<br />
8 Graded Quiz 8.1 60<br />
10 Graded Quiz 10.1 60<br />
13 Graded Quiz 13.1 60<br />
14 Graded Final Exam 180<br />
Course Topics and Objectives<br />
Topic Lesson Topic Subtopics Objectives<br />
1 <strong>Statistics</strong>: An<br />
Introduction and<br />
Basic Concepts<br />
• Use of<br />
<strong>Statistics</strong><br />
• Types of<br />
Variables<br />
• Levels of<br />
Measurement<br />
• Ethics in<br />
<strong>Statistics</strong><br />
• Software and<br />
<strong>Statistics</strong><br />
• Graphical<br />
Displays of<br />
Categorical<br />
Data<br />
• Differentiate between the word “statistics” and the<br />
science of statistics.<br />
• Describe the importance of statistics and situations<br />
where statistics are used in business and everyday<br />
life; identify business situations in which statistics<br />
can be used appropriately and inappropriately.<br />
• Identify qualitative versus quantitative and<br />
discrete versus continuous variables.<br />
• Discuss the levels of measurement and choose the<br />
most appropriate level of measurement for a<br />
specified situation.<br />
• Explain the role of computer software in statistical<br />
analysis and identify some of the most popular<br />
software packages.<br />
• Construct bar charts to display categorical data.<br />
2 Sampling Methods • Sampling a<br />
Population<br />
• Sampling<br />
Errors<br />
• Define the terms population and sample.<br />
• Explain the need for sampling.<br />
• Use a simple random sampling technique to select<br />
members of the general populate.<br />
• Understand more complex sampling techniques,<br />
such as stratified, cluster, and systematic random<br />
sampling.<br />
© SMARTHINKING, Inc., 2009<br />
For more information visit: www.<strong>StraighterLine</strong>.com | Phone: 1-877-Str8erLine (1-877-787-8375) press option 1 | Email: advisor@<strong>StraighterLine</strong>.com
• Identify sampling errors in a given situation.<br />
3 Descriptive <strong>Statistics</strong>:<br />
Numerical Measures<br />
• Arithmetic<br />
Mean<br />
• Geometric<br />
Mean<br />
• Median and<br />
Mode<br />
• Measures of<br />
Dispersion<br />
• Chebyshev's<br />
Theorem and<br />
the Empirical<br />
Rule<br />
• Using<br />
Software to<br />
Compute<br />
Descriptive<br />
<strong>Statistics</strong><br />
• Calculate the arithmetic mean for a given set of<br />
data.<br />
• Calculate the geometric mean for a given set of<br />
data.<br />
• Calculate the median and mode for a given set of<br />
data.<br />
• Compute and interpret the range, mean deviation,<br />
variance, and standard deviation for data<br />
observations.<br />
• Interpret data using Chebyshev's theorem and the<br />
Empirical rule.<br />
• Understand how software can be used in<br />
computing various measures of location and<br />
dispersion.<br />
4 Descriptive <strong>Statistics</strong>:<br />
Representational<br />
• Dot Plot,<br />
Stem Plot,<br />
and<br />
Histogram<br />
• Quartiles,<br />
Deciles, and<br />
Percentiles<br />
• Skewness<br />
• Bivariate Data<br />
• Create and interpret dot plot, box plot, and scatter<br />
diagrams.<br />
• Define and compute quartiles, deciles, and<br />
percentiles.<br />
• Compute and interpret the coefficient of skewness.<br />
• Construct a contingency table.<br />
5 Probability • Probability<br />
Approaches<br />
• Probability<br />
Calculations<br />
• Tools of<br />
Analysis<br />
• Computing<br />
the Number of<br />
Possible<br />
Outcomes<br />
• Discuss the objective and subjective approaches to<br />
probability analysis.<br />
• Calculate probability using the rules of addition<br />
and multiplication.<br />
• Use and interpret contingency tables, Venn<br />
diagrams, and tree diagrams.<br />
• Compute the number of possible outcomes for<br />
combinations and permutations using formulae<br />
and Excel functions.<br />
6 Discrete and<br />
Continuous<br />
Probability<br />
Distributions<br />
• Discrete<br />
Probability<br />
Distributions<br />
• Binomial<br />
Probability<br />
Distributions<br />
• Poisson<br />
Probability<br />
Distributions<br />
• Uniform<br />
Probability<br />
Distributions<br />
• Normal<br />
Probability<br />
Distributions<br />
• Sampling<br />
Distribution of<br />
the Sample<br />
• Explain the difference between discrete and<br />
continuous distribution.<br />
• Compute the mean and the standard deviation for<br />
a uniform distribution.<br />
• Calculate the mean, variance, and standard<br />
deviation of a probability distribution.<br />
• Compute probabilities using the binomial<br />
probability distribution.<br />
• Compute probabilities using the uniform<br />
distribution.<br />
• Calculate areas under a normal curve using the<br />
Empirical Rule.<br />
• Compute probabilities using the Poisson probability<br />
distribution.<br />
• Compute probabilities using the normal probability<br />
distribution.<br />
• Select a sample and construct a sampling<br />
© SMARTHINKING, Inc., 2009<br />
For more information visit: www.<strong>StraighterLine</strong>.com | Phone: 1-877-Str8erLine (1-877-787-8375) press option 1 | Email: advisor@<strong>StraighterLine</strong>.com
Mean<br />
• Central Limit<br />
Theorem<br />
distribution of the mean.<br />
• Explain the importance of the central limit<br />
theorem and how it applies to sample<br />
distributions.<br />
7 Using Confidence<br />
Intervals in the<br />
Sampling Process<br />
• Large Sample<br />
Confidence<br />
Intervals<br />
• Small Sample<br />
Confidence<br />
Intervals<br />
• Proportions<br />
• Sample Size<br />
• Define the terms confidence interval, point<br />
estimate, and degrees of freedom, and explain<br />
how they are involved in the sampling process.<br />
• Demonstrate the ability to compute a confidence<br />
interval for a large sample experiment.<br />
• Compute a confidence interval for a small sample<br />
experiment.<br />
• Compute a confidence interval for a proportion.<br />
• Determine an appropriate sample size for small,<br />
large, and proportion experiments.<br />
8 Tests of Hypothesis • Hypothesis<br />
Testing: An<br />
Introduction<br />
• Decision<br />
Making in<br />
Hypothesis<br />
Testing<br />
• Hypothesis<br />
Testing with<br />
Proportions<br />
• Two-Sample<br />
Test of<br />
Hypothesis<br />
9 Regression Analysis • Correlation<br />
Analysis<br />
• Coefficient of<br />
Correlation<br />
• Regression<br />
Analysis<br />
• Confidence<br />
Interval and<br />
Prediction<br />
Intervals<br />
• ANOVA Table<br />
• Formulate null and alternate hypotheses, and test<br />
the hypothesis using the five steps of the<br />
hypothesis testing procedure.<br />
• Discuss Type I and Type II errors on a test of<br />
hypothesis.<br />
• Perform a one-tailed and a two-tailed test of<br />
hypothesis.<br />
• Perform a test of hypothesis on the difference<br />
between two population means using the z and t<br />
statistics.<br />
• Perform a test of hypothesis on a population<br />
proportion using the z statistic.<br />
• Discuss the difference between correlation and<br />
causation.<br />
• Analyze the correlation between two variables in<br />
specified situations.<br />
• Calculate and interpret the coefficient of<br />
correlation, the coefficient of determination, and<br />
the standard error.<br />
• Calculate and interpret the linear regression line.<br />
• Construct and interpret a confidence interval and<br />
prediction interval for a dependent variable.<br />
• Use an ANOVA table data to compute statistics.<br />
10 Multiple Regression<br />
Analysis<br />
• Multiple<br />
Regression<br />
Analysis<br />
Equation<br />
• Analyzing<br />
ANOVA Table<br />
Output<br />
• Analyzing<br />
Individual<br />
Independent<br />
Variables<br />
• Analyze the relationships between several<br />
independent variables and a dependent variable.<br />
• Test to determine whether the regression<br />
coefficient for each independent (or explanatory)<br />
variable has a significant influence upon the<br />
dependent variable.<br />
• Calculate and interpret multiple regression<br />
analysis.<br />
• Compute variance of regression using the standard<br />
error of estimate and the ANOVA table.<br />
• Calculate and interpret the coefficient of<br />
determination and the correlation matrix.<br />
• Identify the violation of assumptions:<br />
homoscedasticity and autocorrelation.<br />
11 Analysis of Variance • Using the F • Discuss the general idea of analysis of variance<br />
© SMARTHINKING, Inc., 2009<br />
For more information visit: www.<strong>StraighterLine</strong>.com | Phone: 1-877-Str8erLine (1-877-787-8375) press option 1 | Email: advisor@<strong>StraighterLine</strong>.com
Distribution in<br />
Variance<br />
Analysis<br />
• Analysis of<br />
Variance<br />
(ANOVA)<br />
• Computing<br />
the Analysis<br />
of Variance<br />
(ANOVA) –<br />
Sum of<br />
Squares<br />
• Analyzing the<br />
Variance<br />
• Use of<br />
Software in<br />
Variance<br />
Analysis<br />
and analyze the given F distribution.<br />
• Test a hypothesis to determine whether the<br />
variances of two populations are equal.<br />
• Test a hypothesis about three or more treatment<br />
means and develop confidence intervals for the<br />
difference between treatment means.<br />
• Perform an analysis of variance (ANOVA).<br />
• Understand how to use statistical software in<br />
variance analysis.<br />
12 Nonparametric<br />
Methods<br />
• Chi-Square<br />
Test<br />
• Contingency<br />
Table Analysis<br />
• Test a hypothesis comparing an observed set of<br />
frequencies to an expected set of frequencies<br />
using the chi-square test.<br />
• Identify the limitation of the chi-square test in a<br />
specified situation.<br />
• Analyze relationships in statistical data using a<br />
contingency table.<br />
13 Process Improvement<br />
Using Control Charts<br />
• Statistical<br />
Process<br />
Control<br />
• Creating<br />
Control Charts<br />
• Analyzing<br />
Control Charts<br />
• Natural<br />
Tolerance<br />
Limits<br />
• p Chart<br />
• Identify the causes of process variation and apply<br />
statistical process control to reduce process<br />
variation.<br />
• Sample a process and use rational sub-grouping to<br />
control process.<br />
• Use statistical software to create X-bar and R-<br />
charts.<br />
• Interpret information presented in control charts<br />
and R-charts to identify assignable causes and<br />
analyze patterns.<br />
• Calculate and analyze the upper and lower natural<br />
tolerance limits to evaluate whether a process is<br />
capable of meeting specifications.<br />
• Construct p chart for fraction nonconforming.<br />
14 Review • Course<br />
Review<br />
None<br />
© SMARTHINKING, Inc., 2009<br />
For more information visit: www.<strong>StraighterLine</strong>.com | Phone: 1-877-Str8erLine (1-877-787-8375) press option 1 | Email: advisor@<strong>StraighterLine</strong>.com