2011 Annual Report - Internet Crime Complaint Center
2011 Annual Report - Internet Crime Complaint Center
2011 Annual Report - Internet Crime Complaint Center

You also want an ePaper? Increase the reach of your titles
YUMPU automatically turns print PDFs into web optimized ePapers that Google loves.
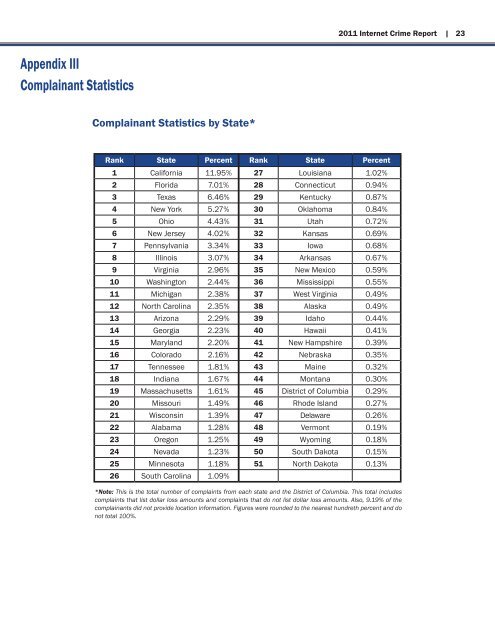
<strong>2011</strong> <strong>Internet</strong> <strong>Crime</strong> <strong>Report</strong> | 23<br />
Appendix III<br />
Complainant Statistics<br />
Complainant Statistics by State*<br />
Rank State Percent Rank State Percent<br />
1 California 11.95% 27 Louisiana 1.02%<br />
2 Florida 7.01% 28 Connecticut 0.94%<br />
3 Texas 6.46% 29 Kentucky 0.87%<br />
4 New York 5.27% 30 Oklahoma 0.84%<br />
5 Ohio 4.43% 31 Utah 0.72%<br />
6 New Jersey 4.02% 32 Kansas 0.69%<br />
7 Pennsylvania 3.34% 33 Iowa 0.68%<br />
8 Illinois 3.07% 34 Arkansas 0.67%<br />
9 Virginia 2.96% 35 New Mexico 0.59%<br />
10 Washington 2.44% 36 Mississippi 0.55%<br />
11 Michigan 2.38% 37 West Virginia 0.49%<br />
12 North Carolina 2.35% 38 Alaska 0.49%<br />
13 Arizona 2.29% 39 Idaho 0.44%<br />
14 Georgia 2.23% 40 Hawaii 0.41%<br />
15 Maryland 2.20% 41 New Hampshire 0.39%<br />
16 Colorado 2.16% 42 Nebraska 0.35%<br />
17 Tennessee 1.81% 43 Maine 0.32%<br />
18 Indiana 1.67% 44 Montana 0.30%<br />
19 Massachusetts 1.61% 45 District of Columbia 0.29%<br />
20 Missouri 1.49% 46 Rhode Island 0.27%<br />
21 Wisconsin 1.39% 47 Delaware 0.26%<br />
22 Alabama 1.28% 48 Vermont 0.19%<br />
23 Oregon 1.25% 49 Wyoming 0.18%<br />
24 Nevada 1.23% 50 South Dakota 0.15%<br />
25 Minnesota 1.18% 51 North Dakota 0.13%<br />
26 South Carolina 1.09%<br />
*Note: This is the total number of complaints from each state and the District of Columbia. This total includes<br />
complaints that list dollar loss amounts and complaints that do not list dollar loss amounts. Also, 9.19% of the<br />
complainants did not provide location information. Figures were rounded to the nearest hundreth percent and do<br />
not total 100%.