2011 Annual Report - Internet Crime Complaint Center
2011 Annual Report - Internet Crime Complaint Center
2011 Annual Report - Internet Crime Complaint Center

Create successful ePaper yourself
Turn your PDF publications into a flip-book with our unique Google optimized e-Paper software.
<strong>2011</strong> <strong>Internet</strong> <strong>Crime</strong> <strong>Report</strong> | 9<br />
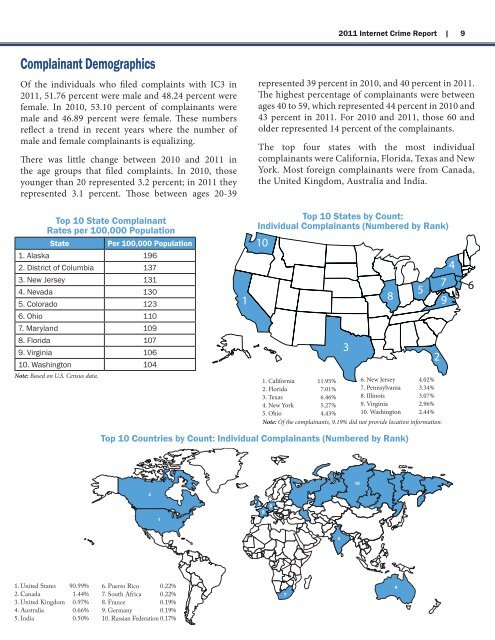
Complainant Demographics<br />
Of the individuals who filed complaints with IC3 in<br />
<strong>2011</strong>, 51.76 percent were male and 48.24 percent were<br />
female. In 2010, 53.10 percent of complainants were<br />
male and 46.89 percent were female. These numbers<br />
reflect a trend in recent years where the number of<br />
male and female complainants is equalizing.<br />
There was little change between 2010 and <strong>2011</strong> in<br />
the age groups that filed complaints. In 2010, those<br />
younger than 20 represented 3.2 percent; in <strong>2011</strong> they<br />
represented 3.1 percent. Those between ages 20-39<br />
Top 10 State Complainant<br />
Rates per 100,000 Population<br />
State<br />
Per 100,000 Population<br />
1. Alaska 196<br />
2. District of Columbia 137<br />
3. New Jersey 131<br />
4. Nevada 130<br />
5. Colorado 123<br />
6. Ohio 110<br />
7. Maryland 109<br />
8. Florida 107<br />
9. Virginia 106<br />
10. Washington 104<br />
Note: Based on U.S. Census data.<br />
1<br />
represented 39 percent in 2010, and 40 percent in <strong>2011</strong>.<br />
The highest percentage of complainants were between<br />
ages 40 to 59, which represented 44 percent in 2010 and<br />
43 percent in <strong>2011</strong>. For 2010 and <strong>2011</strong>, those 60 and<br />
older represented 14 percent of the complainants.<br />
The top four states with the most individual<br />
complainants were California, Florida, Texas and New<br />
York. Most foreign complainants were from Canada,<br />
the United Kingdom, Australia and India.<br />
Top 10 States by Count:<br />
Individual Complainants (Numbered by Rank)<br />
10<br />
1. California 11.95%<br />
2. Florida 7.01%<br />
3. Texas 6.46%<br />
4. New York 5.27%<br />
5. Ohio 4.43%<br />
3<br />
2<br />
4<br />
7<br />
5 6<br />
8 9<br />
6. New Jersey 4.02%<br />
7. Pennsylvania 3.34%<br />
8. Illinois 3.07%<br />
9. Virginia 2.96%<br />
10. Washington 2.44%<br />
Note: Of the complainants, 9.19% did not provide location information.<br />
Top 10 Countries by Count: Individual Complainants (Numbered by Rank)<br />
2<br />
10<br />
1<br />
3<br />
8<br />
9<br />
6<br />
5<br />
1. United States 90.99%<br />
2. Canada 1.44%<br />
3. United Kingdom 0.97%<br />
4. Australia 0.66%<br />
5. India 0.50%<br />
6. Puerto Rico 0.22%<br />
7. South Africa 0.22%<br />
8. France 0.19%<br />
9. Germany 0.19%<br />
10. Russian Federation 0.17%<br />
7<br />
4